
Rural spending, tax cuts and new channels widen demand
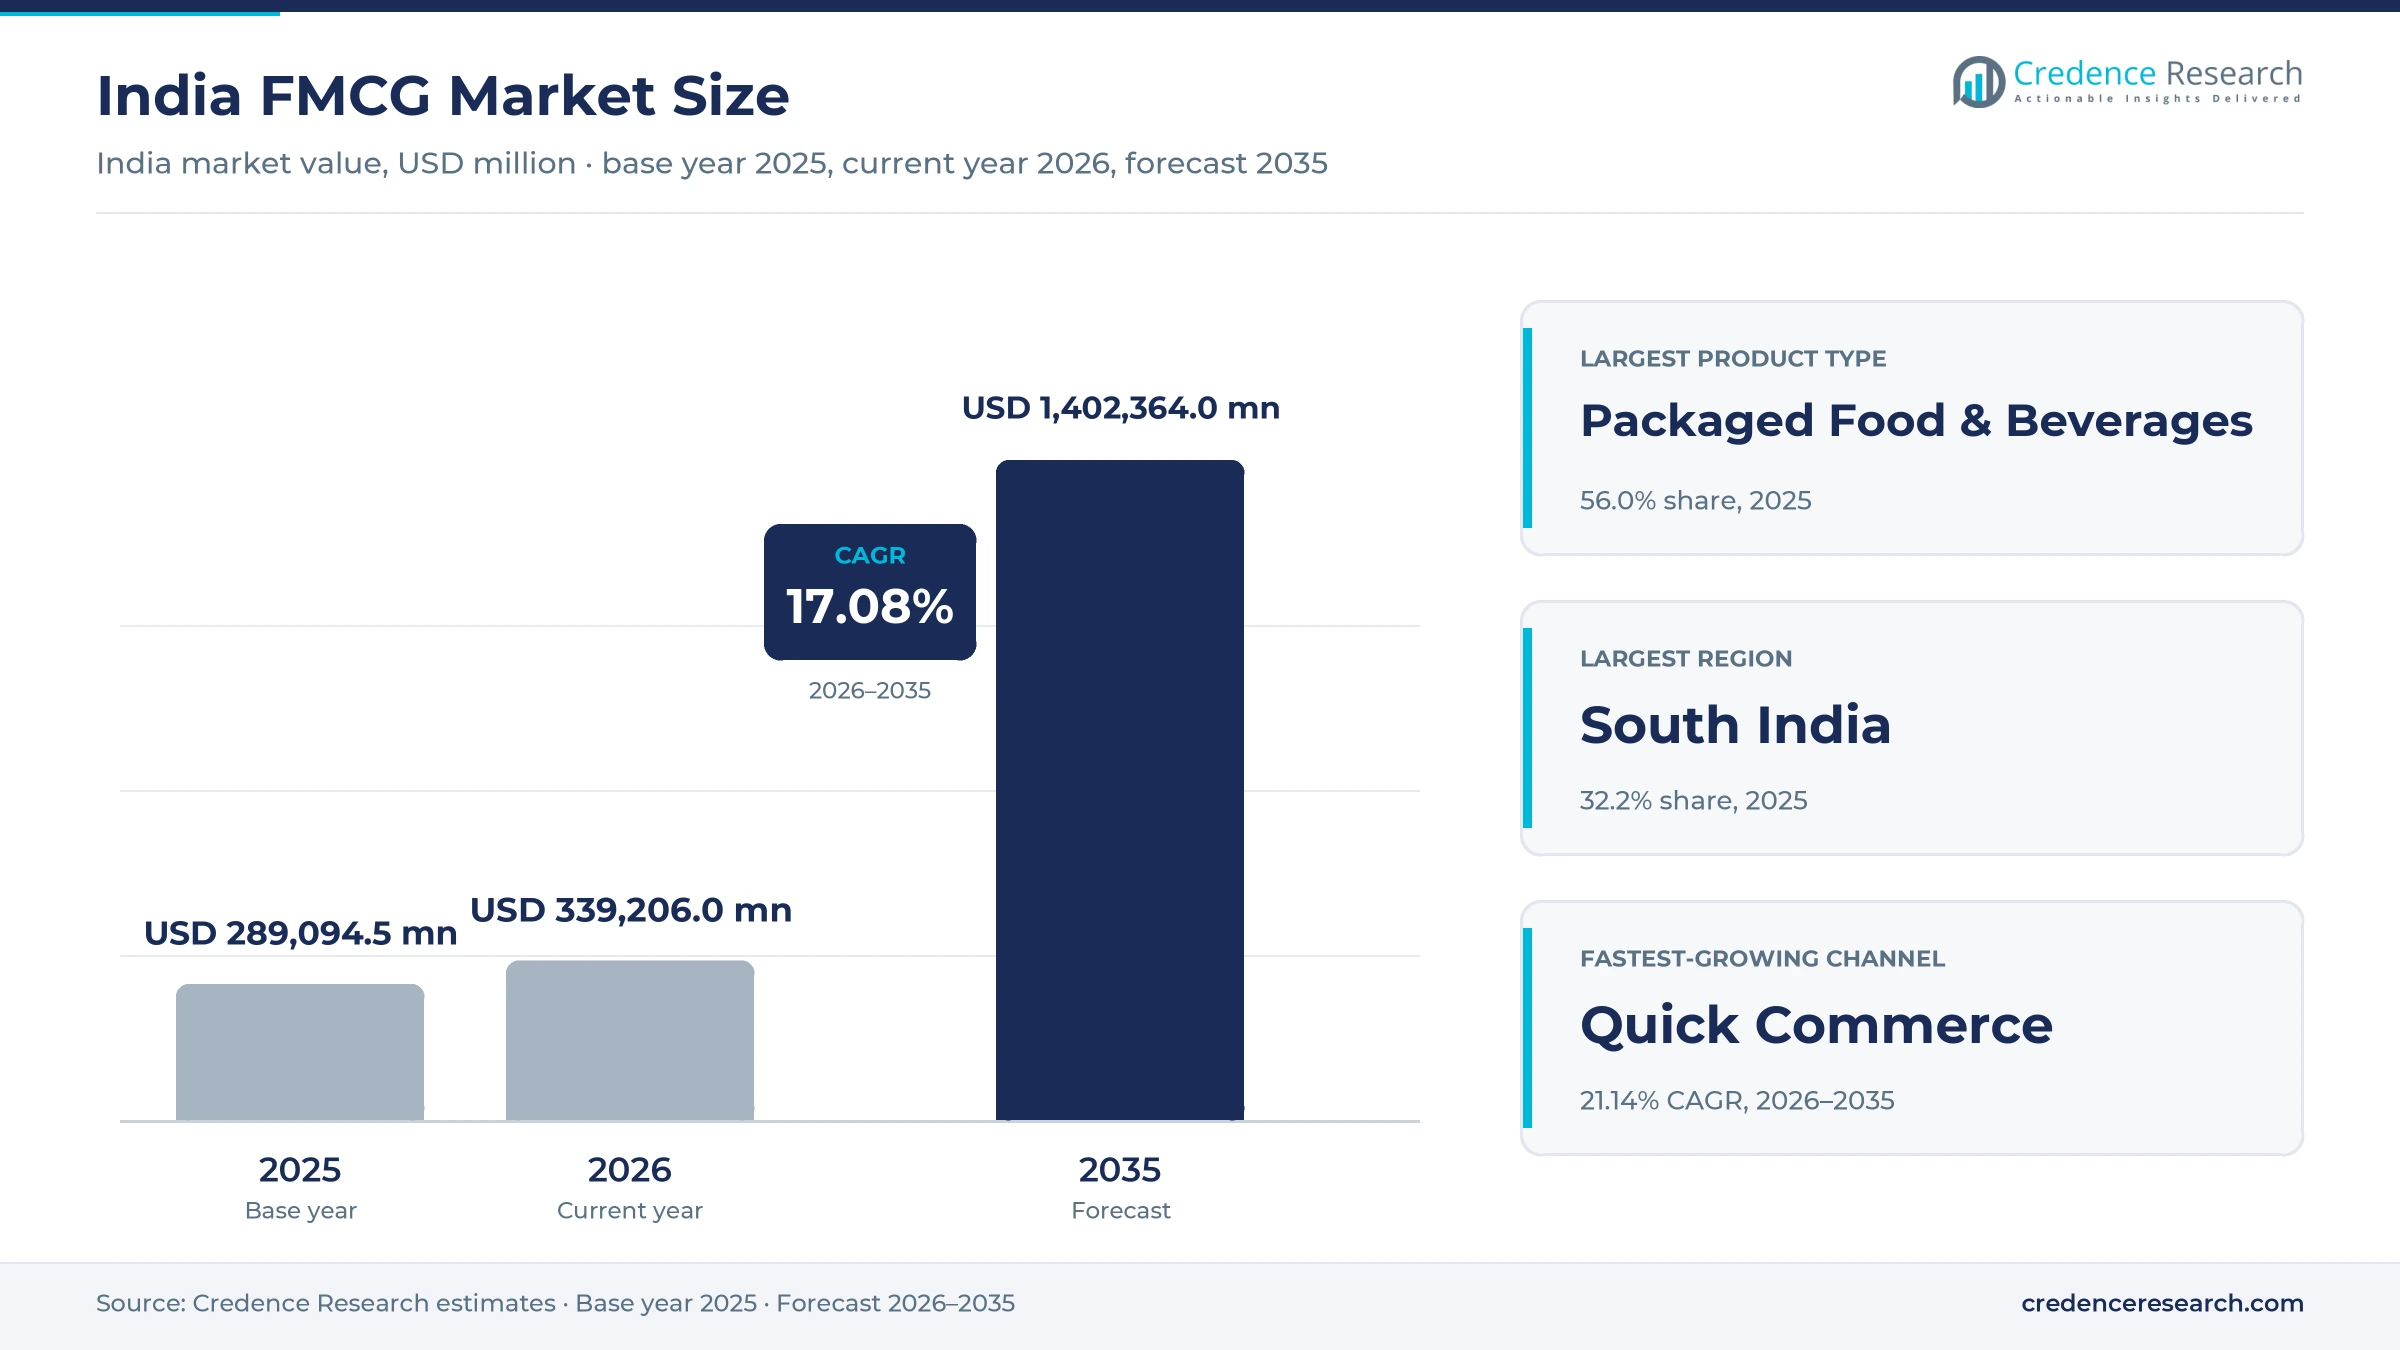
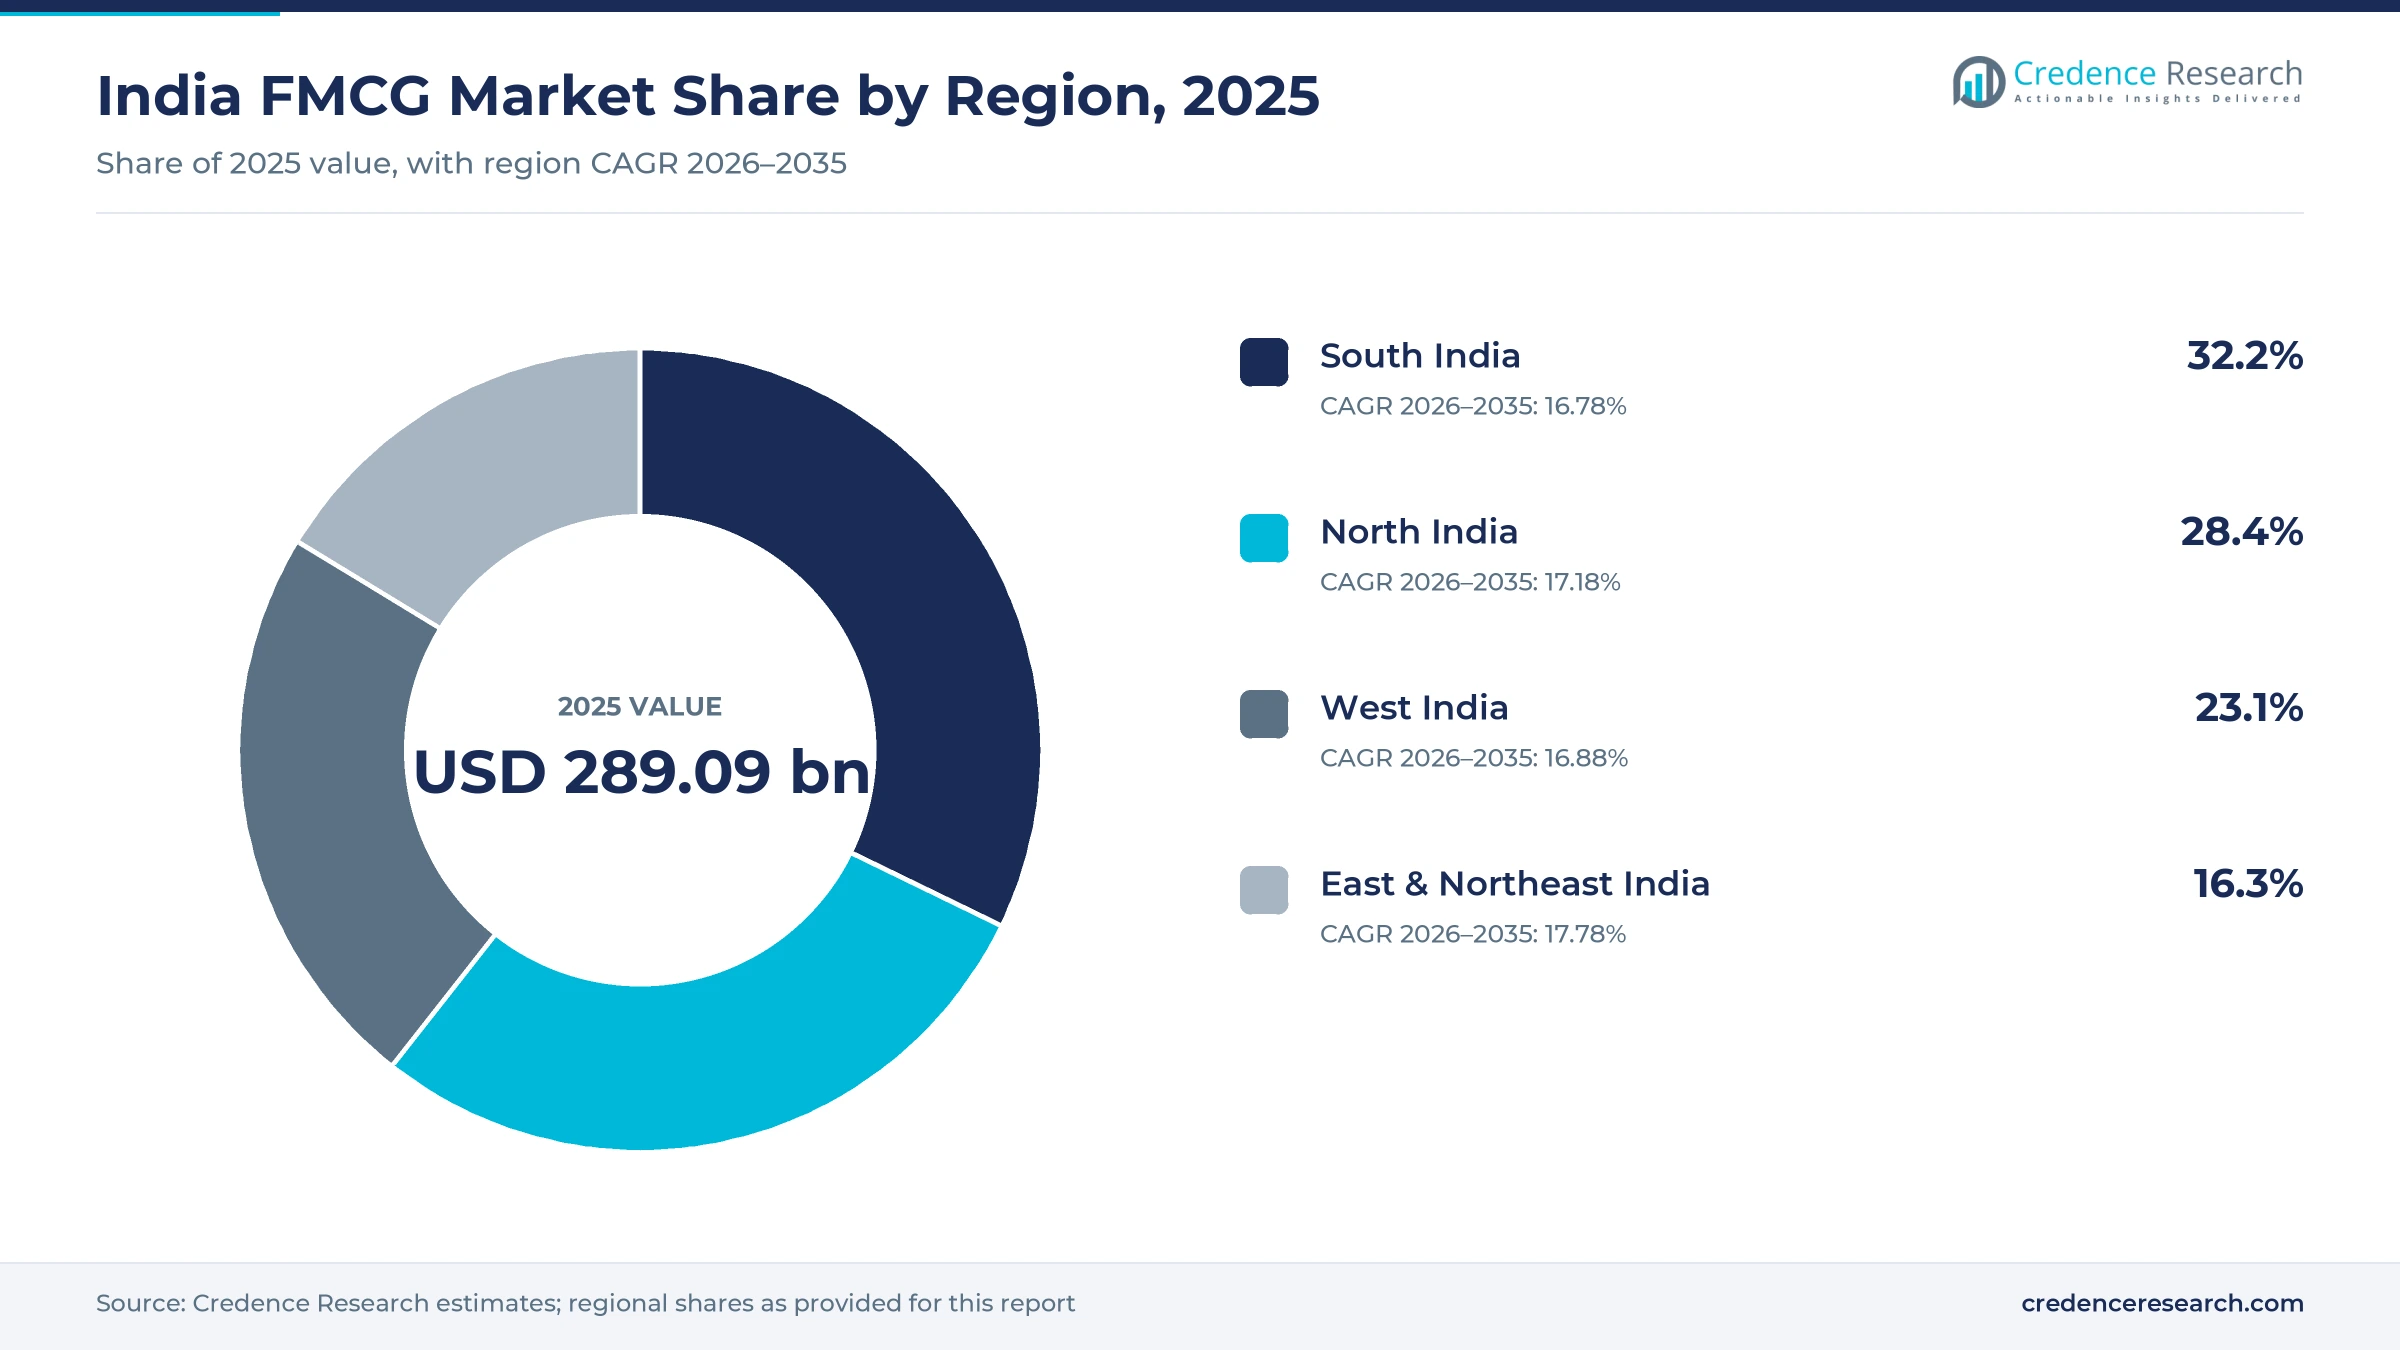
The India FMCG market was valued at USD 289.09 billion in 2025 and is projected to increase from USD 339.21 billion in 2026 to USD 1,402.36 billion by 2035, registering a CAGR of 17.08% during 2026–2035. Demand comes from more than 1.4 billion consumers who buy food, home care and personal care items every week, rising rural spending and the fast spread of online ordering. South India held the largest regional share, 32.2% in 2025, because higher urban spending in Tamil Nadu, Karnataka, Kerala and Telangana supports branded and premium products. East and Northeast India grows fastest at 17.78% a year, as households in Bihar, West Bengal, Odisha and the Northeast upgrade from loose goods to packaged brands. GST on soap, shampoo, toothpaste and many packaged foods was cut to 5% in September 2025, which lowered shelf prices across the category.
Which food, home and personal care goods are counted?
The estimate measures retail sales value of fast-moving consumer goods in India, including packaged food and beverages, household care, personal care and beauty, and health and wellness products. It covers sachets, standard packs, family packs and refills sold through kirana stores, modern retail, online marketplaces, quick commerce apps and brand stores. Values are stated in USD million at current prices, converted from Indian rupees at average annual exchange rates.
The estimate excludes fresh produce sold loose, tobacco, alcoholic drinks, prescription medicines and durable goods such as appliances and furniture. It also excludes food service sales by restaurants and caterers. The value chain runs from farm and chemical inputs through processors, contract and in-house manufacturers to distributors, retailers and households.
India FMCG Market Insights
- The India FMCG market was valued at USD 289.09 billion in 2025 and is projected to reach USD 1,402.36 billion by 2035, registering a CAGR of 17.08% during 2026–2035.
- South India held 32.2% of 2025 value, because higher urban spending in its southern states supports branded, premium and online purchases.
- Packaged food and beverages led with 56.0% of 2025 value, since staples, snacks, dairy and drinks make up most weekly household baskets.
- GST on soap, shampoo, toothpaste, namkeen, butter and ghee was cut to 5% in September 2025, which lowered prices on many everyday items.
- Quick commerce grows fastest at 21.14% a year during 2026–2035, as more than one billion internet subscribers order goods within minutes.
Packaged food and kirana stores carry most of the value
Why does packaged food lead FMCG sales?
Based on product type, the market is categorized into packaged food and beverages, household care, personal care and beauty, and health and wellness. Packaged Food & Beverages led with 56.0% of 2025 value, because staples, snacks, dairy, tea and coffee fill most weekly household baskets. Health & Wellness grows fastest at 18.28% a year, as buyers add organic foods, ayurvedic remedies and nutrition products to their routines.
Why do mainstream brands outsell value packs?
Based on price tier, the market is categorized into value, mainstream, premium and super-premium products. Mainstream products led with 44.0% of 2025 value, because most families buy trusted national brands at familiar price points. Super-Premium products grow fastest at 19.06% a year, as affluent urban households trade up to premium skin care, liquids and specialty foods.
Which channels sell most FMCG products in India?
Based on distribution channel, the market is categorized into general trade and kirana, modern trade, e-commerce marketplaces, quick commerce and direct-to-consumer brand stores. General Trade & Kirana led with 64.0% of 2025 value, because neighborhood stores serve most towns and villages on credit. Quick Commerce grows fastest at 21.14% a year, as apps deliver groceries and personal care items within minutes in large cities.
| Segment Group | Leading Sub-segment | Share, 2025 | Fastest-growing Sub-segment | CAGR, 2026–2035 |
|---|---|---|---|---|
| By Product Type | Packaged Food & Beverages | 56.0% | Health & Wellness | 18.28% |
| By Price Tier | Mainstream | 44.0% | Super-Premium | 19.06% |
| By Distribution Channel | General Trade & Kirana | 64.0% | Quick Commerce | 21.14% |
Request a Free Sample
Fill in your details and we'll send you a free sample report.
- Sample data tables & charts
- Research methodology
Rural recovery, digital reach and local plants lift sales
How is rural consumption recovery lifting volumes?
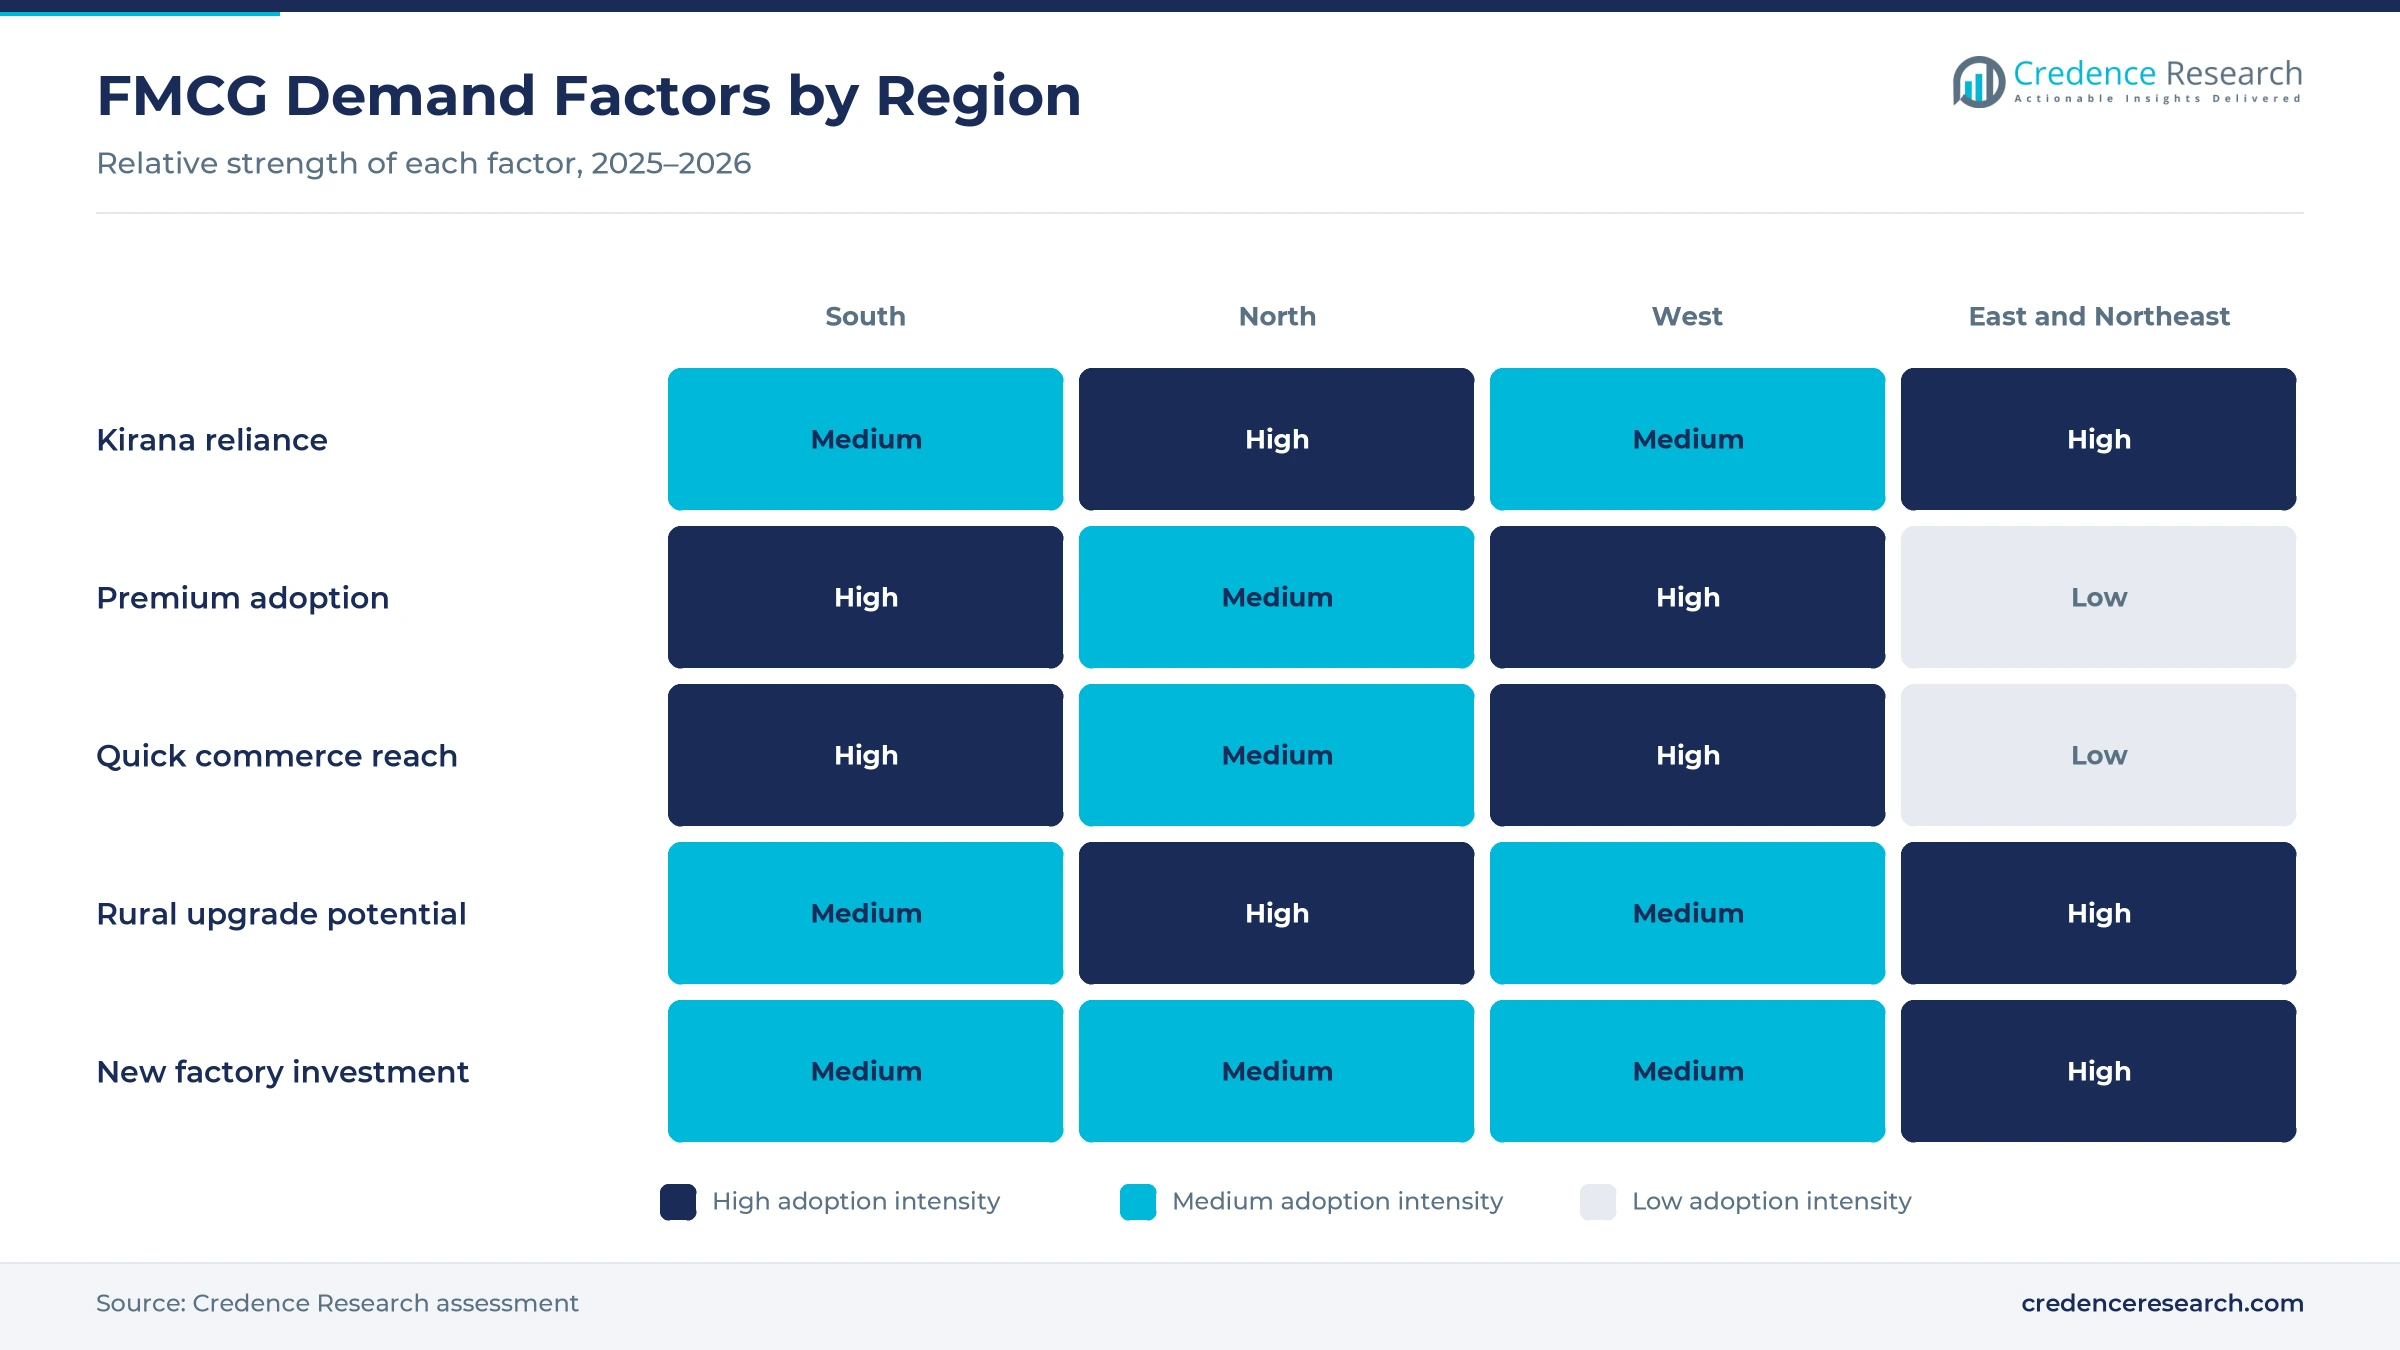
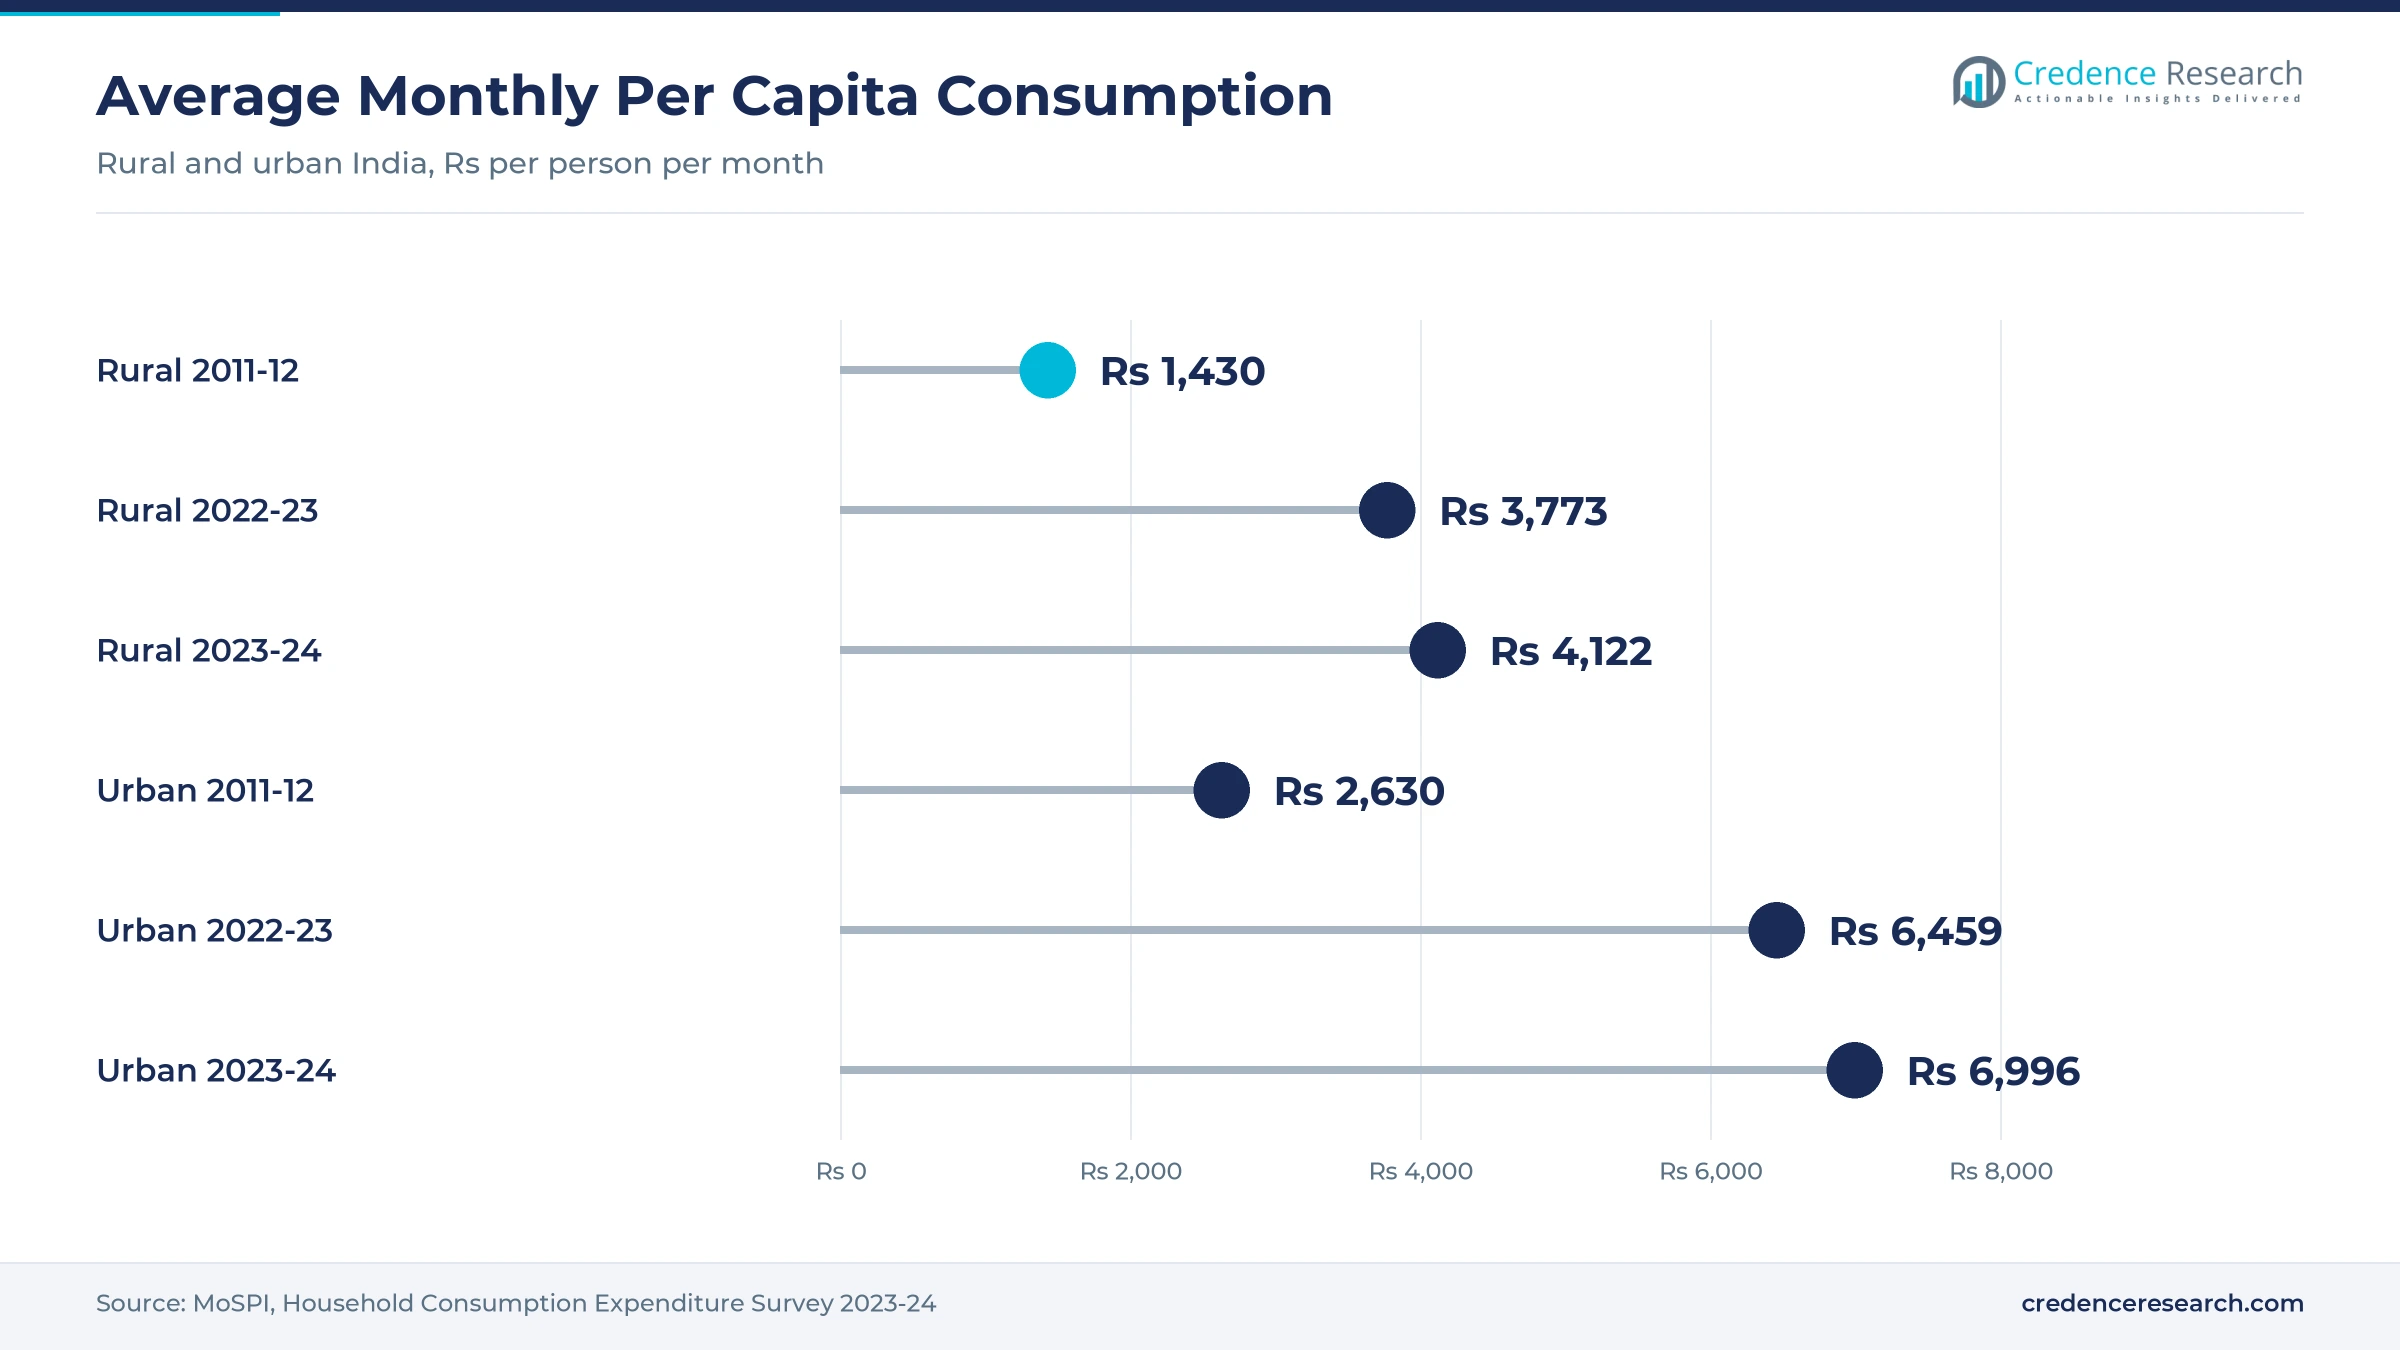
Rural consumption recovery lifts volumes, because village households are spending more on branded goods beyond basic food. Average monthly per capita consumption in rural India rose from Rs 3,773 in 2022-23 to Rs 4,122 in 2023-24, according to the Household Consumption Expenditure Survey. Non-food items took 52.96% of rural spending in 2023-24, which leaves more room for soaps, detergents and personal care. Rural areas held about 64.6% of the population in 2024, according to World Bank data, so small gains per household add large volumes. Consumption inequality in rural areas also fell to 0.237 in 2023-24. As a result, value and mainstream packs keep gaining rural buyers as households upgrade from loose goods.
Why is digital route-to-market accelerating?
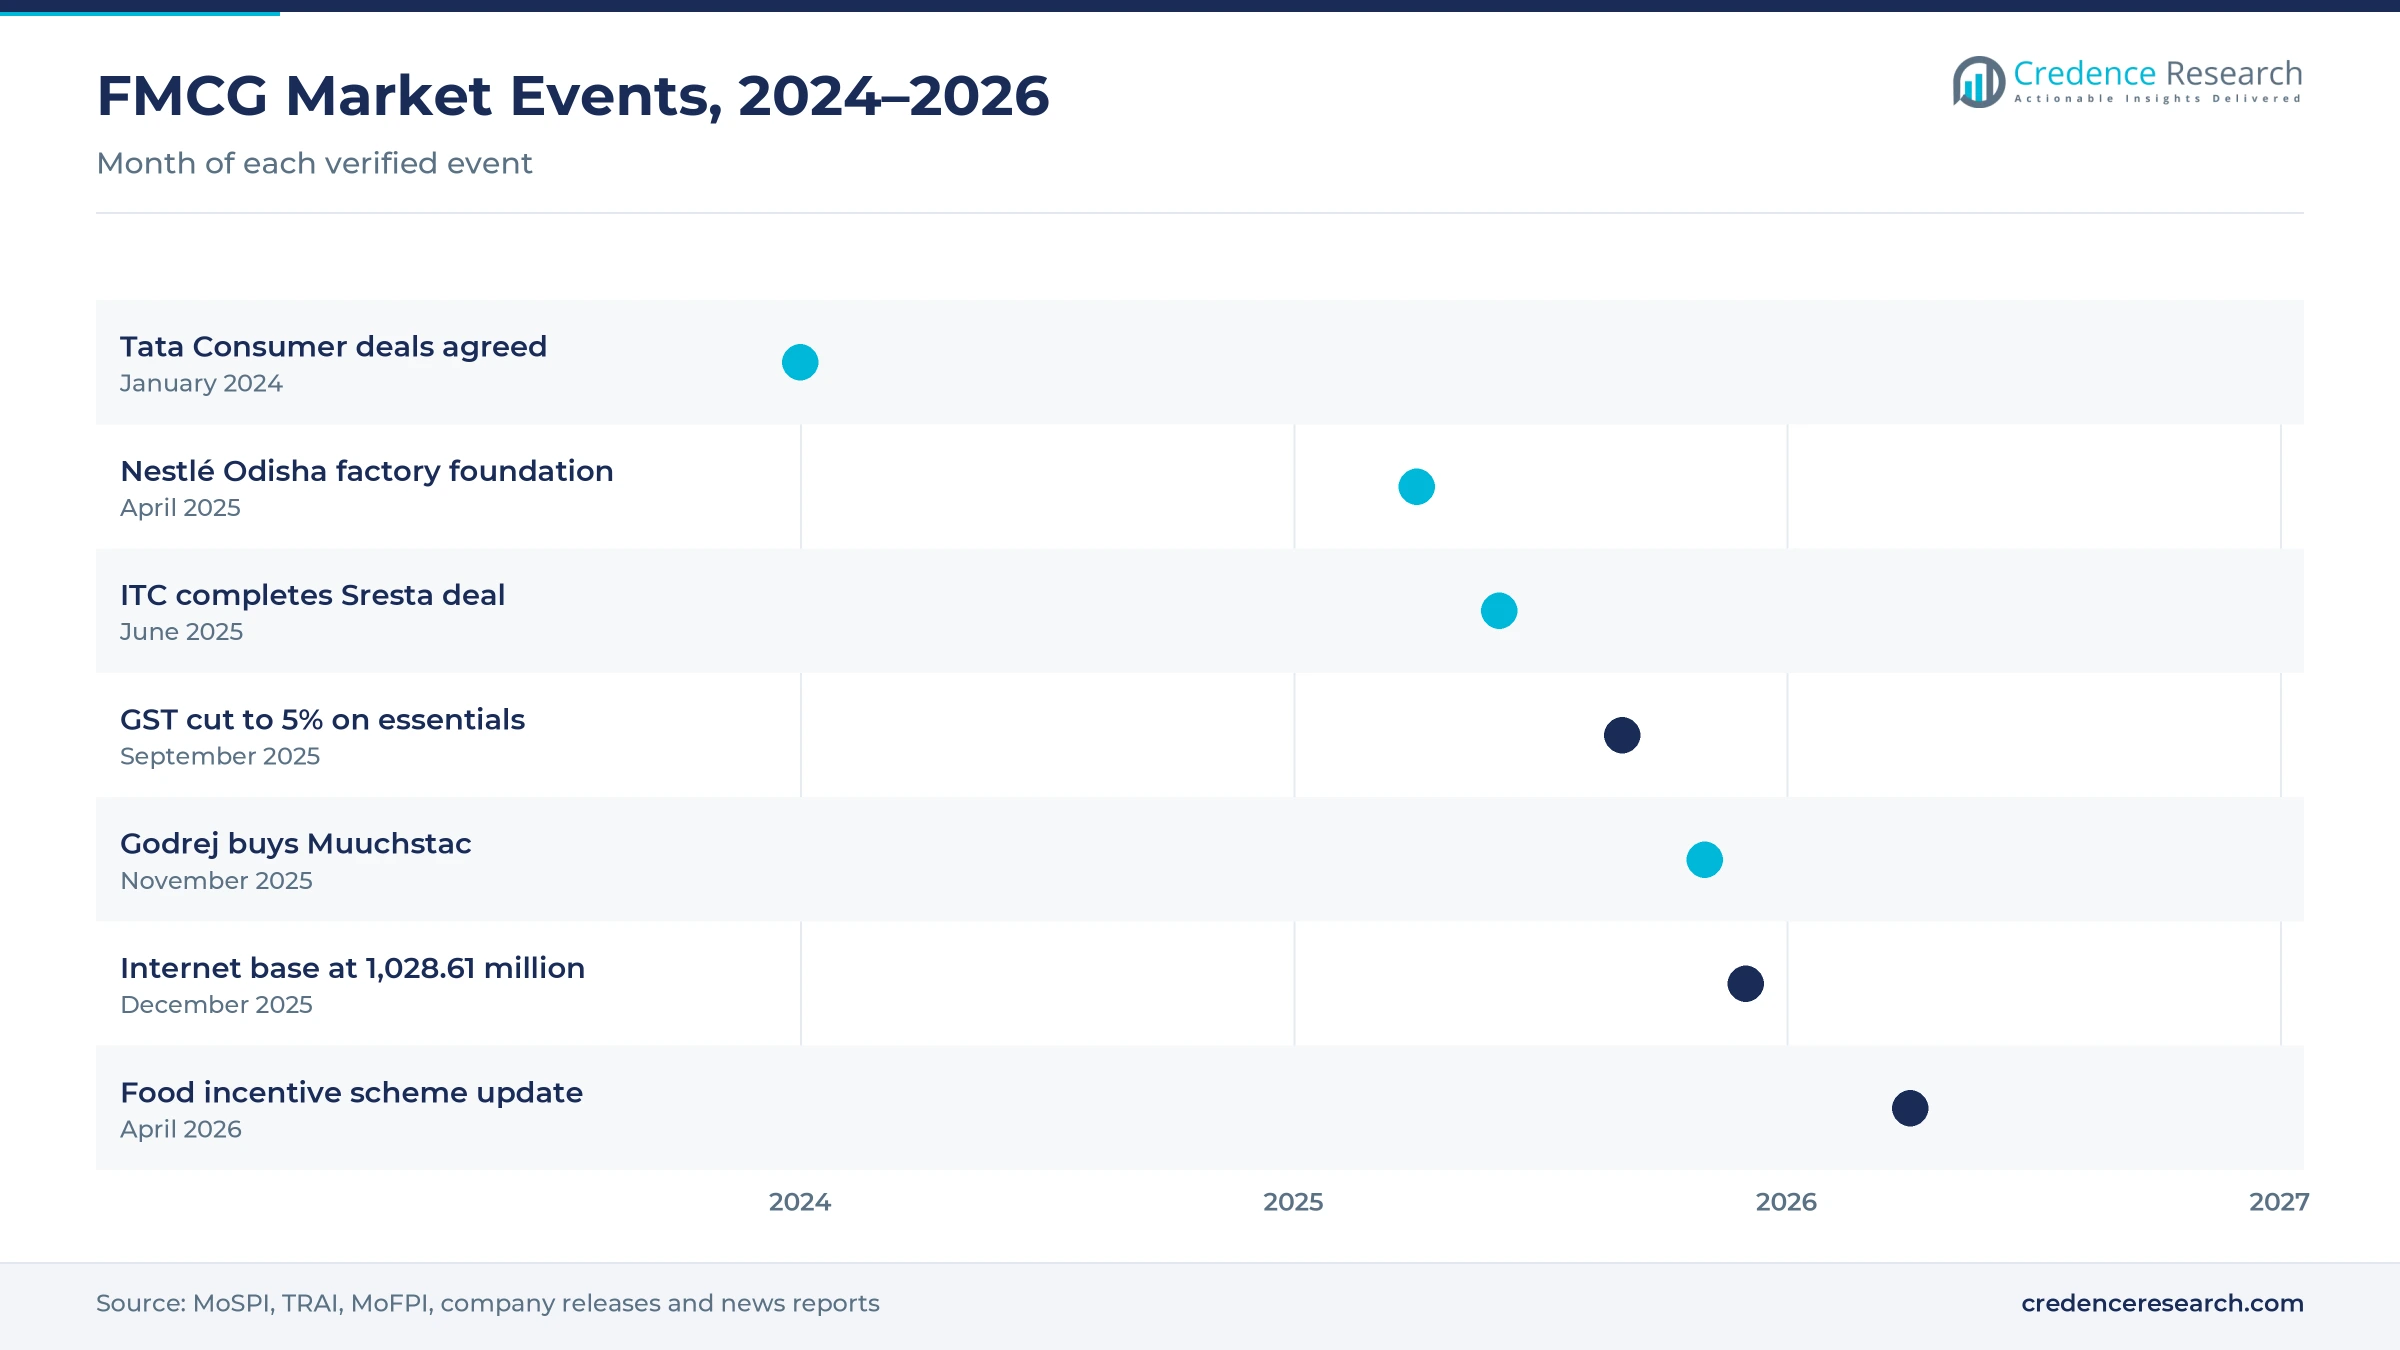
Digital route-to-market tools are accelerating, because brands can now reach shoppers and small retailers directly on their phones. India had 1,028.61 million internet subscribers at the end of December 2025, up 1.06% in one quarter, according to TRAI data. Broadband users reached 1,007.35 million in the same month, which supports video ads and app ordering. In May 2025, Dabur said it would double down on e-commerce, quick commerce and modern trade to revive urban and rural demand. Godrej Consumer Products bought Muuchstac, the second-largest online brand in men's face washes, in a Rs 450 crore deal on Nov. 10, 2025. In turn, quick commerce grows fastest at 21.14% a year, while online retail platforms widen reach in smaller towns.
How does domestic processing capacity support growth?
Domestic manufacturing and processing capacity supports growth, because local plants cut costs, shorten supply chains and add new product lines. The production-linked incentive scheme for food processing carries an outlay of Rs 10,900 crore from FY2021-22 to FY2026-27, according to IANS. Investment under the scheme reached Rs 9,207 crore against Rs 7,722 crore committed across 22 states, and about 34 lakh tons a year of processing capacity has been added. Nestlé India also laid the foundation for its 10th factory, in Khordha, Odisha, in April 2025 with an initial investment of about Rs 900 crore. Therefore, packaged food and beverages keep 56.0% of 2025 value and expand into eastern states.
Why did lower GST rates widen affordability?
Lower GST rates widened affordability, because many everyday products moved to a lower tax slab in September 2025. GST on hair oil, soap, shampoo, toothpaste, toothbrushes and shaving cream fell from 18% to 5%, according to All India Radio. Namkeen, sauces, pasta, noodles, chocolates, coffee, cornflakes, butter and ghee moved down from 12% to the same lower rate. Ultra-high temperature milk, paneer and Indian breads such as roti and paratha moved to zero tax. Urban monthly per capita spending had already reached Rs 6,996 in 2023-24. As a result, households can buy larger packs and branded variants, which supports mainstream products with 44.0% of 2025 value.
Premium portfolios, liquids and millets reshape shelves
How is the shift to health-led portfolios playing out?
Large companies are shifting their portfolios toward health, organic and premium foods through acquisitions and launches. Tata Consumer Products agreed in January 2024 to buy Capital Foods, owner of Ching's Secret, at an enterprise value of Rs 5,100 crore and Organic India at Rs 1,900 crore. ITC completed its purchase of Sresta Natural Bioproducts, owner of 24 Mantra Organic, on June 13, 2025, for an upfront Rs 400 crore. Sresta sells more than 100 organic products, from staples and spices to edible oils. As a result, health and wellness products grow fastest at 18.28% a year, and demand for ready-to-eat foods keeps widening.
Why are liquids and premium formats rising?
Liquids and premium formats are rising, because urban households now pay more for convenience and visible results. Hindustan Unilever reported its highest growth in 13 quarters for the quarter ended June 2026, with 10% underlying sales growth. Its home care business grew 14%, and liquids continued their double-digit growth, led by Vim Liquids. Beauty and wellbeing grew 12%, with double-digit growth in premium skin care and in the Minimalist brand. Bodywash also kept double-digit growth as buyers moved up from bars. In turn, premium products grow at 19.06% a year, and suppliers of flexible packaging supply more pouches and refill packs.
Can millets and better-for-you foods open new growth?
Millets and better-for-you foods offer a clear opening, because government support and buyer interest are rising together. Sales of millet-based products under the food processing incentive scheme rose from Rs 345.73 crore in FY23 to Rs 1,845.25 crore in FY25. Sales of all scheme-supported products grew at a compound rate of 10.58% a year, while exports grew at 7.41% a year. The scheme also includes 68 small and medium applicants and 40 contract manufacturing units. Brands that launch millet snacks, breakfast cereals and ready meals could therefore win health-focused buyers in large cities and smaller towns.
Is there room to grow in eastern India?
Eastern India offers a second opening, because spending there remains below the national average while brands add capacity. West Bengal, Bihar, Uttar Pradesh and Madhya Pradesh had lower per capita spending than the national average in 2023-24. Chhattisgarh recorded the lowest rural monthly per capita spending at Rs 2,739, which shows how much room remains for upgrades. Nestlé India chose Odisha for its first factory in eastern India, with an initial investment of about Rs 900 crore. Better logistics links also cut delivery times to small towns. Therefore, East and Northeast India grows faster than any other region through 2035.
Input inflation, channel conflict and price wars weigh
How does input cost inflation squeeze margins?
Input cost inflation squeezes margins, because palm oil, milk, grains and packaging make up a large share of product cost. Hindustan Unilever said palm oil inflation persisted for a second consecutive year in the quarter ended June 2026, which forced price increases in personal care. Dabur also said high food inflation hurt both rural and urban demand in early 2025. As a result, companies raise prices or cut pack sizes, which can slow volume growth.
Why does channel conflict affect kirana stores?
Channel conflict affects kirana stores, because quick commerce apps and online marketplaces offer deep discounts that small shops cannot match. Distributors then face lower margins and slower stock turns in large cities. Consequently, brands must balance pricing across channels and support kirana owners with digital ordering tools and credit. Poor balance could weaken the channel that still serves most towns and villages, which is a real risk for rural reach and brand visibility.
How do regional brands and price wars weigh?
Regional brands and price wars weigh on national companies, because local makers sell staples, snacks and detergents at lower prices. Tax cuts were passed on to buyers through lower shelf prices, which left little room for margin gains. In turn, national brands rely on scale, distribution and advertising to defend share. Smaller companies with weak distribution struggle to fund the same reach, and this pressure limits the number of national launches each year.
Will labeling and packaging rules raise costs?
Labeling and packaging rules can raise costs, because brands must update front-of-pack claims, ingredient lists and plastic collection plans. Frequent label changes after tax and pricing revisions also add printing and stock costs. Therefore, companies invest in recyclable packs and simpler labels that work across states. Clear rules applied evenly help both large and small brands plan their spending, while sudden changes remain a cost risk for smaller makers.
South India leads while the East grows fastest
| Region | Value, 2025 (USD billion) | Share, 2025 | CAGR, 2026–2035 |
|---|---|---|---|
| South India | 93.09 | 32.2% | 16.78% |
| North India | 82.10 | 28.4% | 17.18% |
| West India | 66.78 | 23.1% | 16.88% |
| East & Northeast India | 47.12 | 16.3% | 17.78% |
Why does South India lead FMCG spending?
South India held 32.2% of 2025 value and grows at 16.78% a year, because Tamil Nadu, Kerala and Telangana recorded higher-than-average per capita consumption in 2023-24. Higher incomes in Bengaluru, Chennai and Hyderabad also support premium foods, skin care and liquid detergents. Quick commerce apps operate across these large southern cities, which makes the region an early market for new launches. Southern states therefore lead in both value and online adoption.
How does North India add volume?
North India held 28.4% of 2025 value and grows at 17.18% a year, because Uttar Pradesh, Punjab, Haryana and Delhi hold a very large population. Punjab recorded higher-than-average per capita spending in 2023-24, while Uttar Pradesh remained below the national average. As a result, North India mixes premium buying in Delhi with value packs in rural districts. Ayurvedic and dairy brands hold strong positions in the region.
What drives West India demand?
West India held 23.1% of 2025 value and grows at 16.88% a year, because Maharashtra and Gujarat have large urban populations and dense modern retail. Maharashtra recorded higher-than-average per capita spending in 2023-24, which supports branded foods and personal care. Mumbai, Pune and Ahmedabad also lead adoption of online grocery, which favors premium and super-premium launches. Dense modern trade in these cities also gives new brands quick shelf access and visibility.
Why is East and Northeast India growing fastest?
East and Northeast India held 16.3% of 2025 value and grows fastest at 17.78% a year, because households in West Bengal, Bihar, Odisha and the Northeast are moving from loose goods to packaged brands. West Bengal and Bihar recorded lower-than-average per capita spending in 2023-24, which leaves room for growth. Nestlé India's Odisha factory will also bring packaged food production closer to these buyers.
Acquisitions, new plants and tax cuts from 2024 to 2026
| Development | Status and market relevance |
|---|---|
| In January 2024, Tata Consumer Products agreed to acquire Capital Foods and Organic India at enterprise values of Rs 5,100 crore and Rs 1,900 crore. | Adds sauces, noodles and wellness products to its portfolio |
| In April 2025, Nestlé India laid the foundation for its 10th factory, in Khordha, Odisha, with an initial investment of about Rs 900 crore. | Its first factory in eastern India |
| In June 2025, ITC completed its acquisition of Sresta Natural Bioproducts, owner of 24 Mantra Organic, for an upfront Rs 400 crore. | Expands ITC in organic staples and spices |
| In September 2025, GST on soap, shampoo, toothpaste and many packaged foods was cut to 5%. | Lower prices support larger packs and branded upgrades |
| In November 2025, Godrej Consumer Products acquired men's grooming brand Muuchstac in a Rs 450 crore deal. | Strengthens its online personal care presence |
Digital ordering, liquids and smaller packs change formats
- Digital ordering apps let kirana owners restock directly from brands and distributors, which cuts stockouts and speeds new launches in small towns.
- Liquid formats such as dishwash liquids, bodywash and liquid detergents replace bars and powders in urban homes, which lifts value per use.
- Small and sachet packs keep products affordable for rural buyers, while products like shampoo move up to bottles as incomes rise.
- Local processing lines for millets, ready meals and organic staples let brands launch health-led foods at lower cost and with fresher supply.
Need a Custom Version of This Report?
Tailor the scope, geography, or segments to your exact requirements.
- Custom geography or segment scope
- Direct access to our analyst team
Diversified groups and focused brands share the shelf
Competition is led by diversified consumer goods groups, with strong challenges from food specialists, ayurvedic companies and digital-first brands. Hindustan Unilever sells home care, beauty, personal care and foods, and reported double-digit growth in premium skin care and liquids in the quarter ended June 2026. ITC competes in packaged foods, personal care and organic staples after buying Sresta Natural Bioproducts. Nestlé India and Tata Consumer Products lead in packaged foods and beverages, while Dabur competes on ayurvedic health and personal care. Godrej Consumer Products adds digital-first brands such as Muuchstac to its home and personal care range. Companies compete on rural reach, price per pack, premium launches and speed on quick commerce platforms. Firms with strong distributor networks and local factories can also respond faster to tax and price changes.
Companies profiled and their roles in this market
| Company | Type | Role in the market |
|---|---|---|
| Hindustan Unilever Limited | Multinational subsidiary | Home care, beauty and foods; highest growth in 13 quarters in June 2026 quarter |
| ITC Limited | Domestic conglomerate | Packaged foods and personal care; acquired 24 Mantra Organic owner in 2025 |
| Nestlé India Limited | Multinational subsidiary | Packaged foods; building its 10th factory in Odisha |
| Tata Consumer Products Limited | Domestic company | Tea, salt and foods; acquired Capital Foods and Organic India |
| Dabur India Limited | Domestic company | Ayurvedic health and personal care; expanding e-commerce and quick commerce |
| Godrej Consumer Products Limited | Domestic company | Home and personal care; acquired Muuchstac in November 2025 |
Credence Research view on rural upgrades and new channels
Credence Research's view is that Indian FMCG demand will grow strongly through 2035, with value rising faster than volume as households trade up. Rural monthly spending rose from Rs 3,773 to Rs 4,122 in one year, which supports branded upgrades in villages and small towns. Lower GST rates since September 2025 also make larger packs more affordable. Packaged food and beverages should keep the largest share of India FMCG demand through 2035. However, input inflation and channel conflict will keep margins tight for mass brands and smaller regional players.
How the household goods spending estimate was built
The report uses 2025 as the base year, with values in USD million at current prices. Market values come from the Credence Research model, which combines household numbers, per capita spending, product penetration, pack mix and average prices. Regional shares are those set for this report, and segment splits by product type, price tier and channel are Credence Research estimates. Sources used are government statistics, World Bank data, telecom data, tax notices, company releases and news reports, and no interviews or surveys were used.
Premium upgrades and quick commerce set the path to 2035
The market is expected to reach USD 1,402.36 billion by 2035, a 17.08% CAGR during 2026–2035, as rural spending rises and buyers move to larger packs, premium products and online channels. Growth should be strongest in East and Northeast India and in quick commerce, while South India keeps the largest share. Health and wellness products will gain share in every region. Local factories and incentive schemes should keep supply costs in check. In contrast, a sharp rise in input costs or weak monsoon incomes would slow volume growth in value tiers.
Frequently Asked Questions
How big is the India FMCG market?
Which region leads FMCG sales in India?
Which region grows fastest?
How did the 2025 GST changes affect FMCG prices?
Which product type holds the largest share?
Which sales channel grows fastest?
Who are the leading FMCG companies in India?
What are the main risks to growth?
Table of Content
Chapter 1 Market Segmentation
- 1.1 Segmentation Framework
- 1.1.1 Product and Service Classification
- 1.1.2 Application and End-Use Classification
- 1.1.3 Technology and Solution Classification
- 1.1.4 Customer and Distribution Channel Classification
- 1.1.5 Geographic Segmentation
- 1.1.6 Market Segment Definitions and Boundaries
- 1.2 By Product Type
- 1.2.1 Packaged Food & Beverages
- 1.2.2 Household Care
- 1.2.3 Personal Care & Beauty
- 1.2.4 Health & Wellness
- 1.3 By Price Tier
- 1.3.1 Value
- 1.3.2 Mainstream
- 1.3.3 Premium
- 1.3.4 Super-Premium
Chapter 2 Introduction
- 2.1 Report Objectives and Scope
- 2.2 Product Definition and Industry Terminology
- 2.3 Market Inclusions and Exclusions
- 2.4 Research Process
- 2.4.1 Primary Research and Expert Interviews
- 2.4.2 Secondary Research and Source Review
- 2.4.3 Top-Down and Bottom-Up Estimation
- 2.4.4 Data Triangulation and Verification
- 2.5 Market Size Measurement Basis
- 2.5.1 2025: USD 289.09 billion → 2035: USD 1,402.36 billion
- 2.6 Historical and Forecast Reference Periods
- 2.6.1 Historical Period: 2018-2025
- 2.6.2 Base Year: 2025
- 2.6.3 Forecast Period: 2025-2035
- 2.7 Research Assumptions and Limitations
Chapter 3 Executive Summary
- 3.1 Market Snapshot and Key Findings
- 3.2 Base-Year Market Size, 2025
- 3.3 Forecast Market Size, 2035
- 3.4 Revenue and Volume Growth Outlook
- 3.5 Key Demand and Supply Indicators
- 3.6 Leading Market Segments
- 3.7 Fastest-Growing Market Opportunities
- 3.8 Regional Performance Highlights
- 3.9 Technology and Industry Transformation
- 3.10 Competitive Landscape Summary
- 3.11 Analyst View and Strategic Implications
Chapter 4 India FMCG Market Trends and Developments
- 4.1 Historical Industry Development, 2018-2025
- 4.2 Recent Market Trends and Developments
- 4.3 Demand and Customer Behavior Trends
- 4.4 Technology and Product Innovation
- 4.5 Artificial Intelligence, Automation and Digitalization
- 4.6 Local Manufacturing and Supply Chain Realignment
- 4.7 Industry Partnerships, Mergers and Acquisitions
- 4.8 Sustainability and Circular Economy Developments
- 4.9 Government and Private Sector Investment Trends
- 4.10 Emerging Business Models and Commercialization
- 4.11 Industry Developments and Announcements
Chapter 5 India FMCG Market Production, Supply and Demand Analysis
- 5.1 Demand Trend and Consumption Analysis, 2018-2025
- 5.2 Demand Forecast, 2025-2035
- 5.3 Production and Output Trend, 2018-2025
- 5.4 Production and Output Forecast, 2025-2035
- 5.5 Installed Capacity and Capacity Utilization
- 5.6 Company-Wise Production Plants and Statistics
- 5.6.1 Installed Production Capacity
- 5.6.2 Actual Production
- 5.6.3 Planned Capacity and Expansion Targets
- 5.7 Supply Chain Structure and Procurement Trends
- 5.8 Supply-Demand Gap and Bottlenecks
- 5.9 Import Dependence and Sourcing Structure
- 5.10 Contract Manufacturing and Outsourcing
- 5.11 Regional Supply and Demand Concentration
Chapter 6 India FMCG Market Pricing Analysis
- 6.1 Pricing Structure and Measurement
- 6.2 Historical Pricing Trends, 2018-2025
- 6.3 Pricing Outlook, 2025-2035
- 6.4 Average Selling Price and Unit Economics
- 6.5 Pricing by Product and Market Segment
- 6.6 Geographic Pricing Differences
- 6.7 Key Input, Energy, Labor and Logistics Costs
- 6.8 Contract Pricing and Purchasing Models
- 6.9 Pricing Sensitivity and Competitive Positioning
- 6.10 Price, Margin and Profitability Implications
Chapter 7 India FMCG Market Dynamics
- 7.1 Market Growth Drivers
- 7.1.1 Demand-Side Drivers
- 7.1.2 Technology and Innovation Drivers
- 7.1.3 Infrastructure and Investment Drivers
- 7.1.4 Regulatory and Policy Drivers
- 7.2 Market Restraints
- 7.2.1 Cost and Affordability Constraints
- 7.2.2 Technology and Adoption Barriers
- 7.2.3 Supply Chain and Operational Constraints
- 7.3 Market Challenges
- 7.3.1 Competitive Pressure and Margin Erosion
- 7.3.2 Skills, Infrastructure and Implementation Gaps
- 7.4 Emerging Market Opportunities
- 7.5 Market Dynamics Impact and Time-Horizon Assessment
Chapter 8 India FMCG Value Chain Analysis
- 8.1 Industry Value Chain Overview
- 8.2 Upstream Suppliers and Critical Inputs
- 8.3 Technology and Component Providers
- 8.4 Manufacturing or Service Delivery
- 8.5 Distribution, Channel Partners and Integrators
- 8.6 Downstream Applications and End Users
- 8.7 Value Addition and Profit Pools
- 8.8 Vertical Integration and Outsourcing
- 8.9 Supplier Concentration and Risk
- 8.10 Supply Chain Localization and Resilience
Chapter 9 India FMCG Market Regulations and Policies
- 9.1 Relevant Laws, Standards and Compliance Frameworks
- 9.2 Product, Service, Safety and Quality Requirements
- 9.3 Government Policies, Incentives and Subsidies
- 9.4 Imports, Exports and Trade Barriers
- 9.5 Public Procurement and Local Content Requirements
- 9.6 Environmental and Sustainability Compliance
- 9.7 Upcoming Policy Changes and Market Implications
Chapter 10 India FMCG Market Hotspots and Opportunities
- 10.1 Market Opportunity Mapping and Growth Hotspots
- 10.2 High-Growth Applications and Customer Groups
- 10.3 Underserved Markets and White-Space Opportunities
- 10.4 Emerging Technology and Product Opportunities
- 10.5 New Capacity and Investment Hotspots
- 10.6 Market Entry and Expansion Opportunities
- 10.7 Distribution and Partnership Opportunities
- 10.8 Near-Term and Long-Term Commercial Potential
- 10.9 Opportunity Attractiveness and Execution Risks
Chapter 11 India FMCG Market Outlook, 2025-2035
- 11.1 Market Size and Analysis
- 11.1.1 Revenue (Market Measurement: 2025: USD 289.09 billion → 2035: USD 1,402.36 billion)
- 11.1.2 Market Volume and Quantity Sold
- 11.1.3 Historical Market Size, 2018-2025
- 11.1.4 Base-Year Market Size, 2025
- 11.2 Market Forecast, 2025-2035
- 11.2.1 Revenue Forecast to 2035
- 11.2.2 Volume Forecast to 2035
- 11.2.3 CAGR and Year-on-Year Growth
- 11.2.4 Incremental Revenue Opportunity
- 11.3 Forecast Assumptions and Scenario Analysis
- 11.3.1 Base-Case Forecast
- 11.3.2 Optimistic and Conservative Scenarios
- 11.3.3 Technology, Pricing and Policy Sensitivities
- 11.4 Market Attractiveness and Growth Outlook
Chapter 12 India FMCG Market Segmentation and Outlook
- 12.1 Segmentation Summary and Market Shares, 2025
- 12.2 Largest and Fastest-Growing Segments
- 12.3 By Product Type - Market Size and Forecast, 2025-2035
- 12.3.1 Segment Definition and Scope
- 12.3.2 Historical Market Size, 2018-2025
- 12.3.3 Revenue Forecast, 2025-2035
- 12.3.4 Volume Forecast, 2025-2035
- 12.3.5 Base-Year Market Share, 2025
- 12.3.6 Segment CAGR and Growth Drivers
- 12.3.7 Subsegment Market Size and Forecast
- 12.3.7.1 Packaged Food & Beverages
- 12.3.7.2 Household Care
- 12.3.7.3 Personal Care & Beauty
- 12.3.7.4 Health & Wellness
- 12.3.8 Subsegment Pricing and Adoption Trends
- 12.3.9 Leading Suppliers and Competition
- 12.3.10 Regional Demand and Opportunities
- 12.4 By Price Tier - Market Size and Forecast, 2025-2035
- 12.4.1 Segment Definition and Scope
- 12.4.2 Historical Market Size, 2018-2025
- 12.4.3 Revenue Forecast, 2025-2035
- 12.4.4 Volume Forecast, 2025-2035
- 12.4.5 Base-Year Market Share, 2025
- 12.4.6 Segment CAGR and Growth Drivers
- 12.4.7 Subsegment Market Size and Forecast
- 12.4.7.1 Value
- 12.4.7.2 Mainstream
- 12.4.7.3 Premium
- 12.4.7.4 Super-Premium
- 12.4.8 Subsegment Pricing and Adoption Trends
- 12.4.9 Leading Suppliers and Competition
- 12.4.10 Regional Demand and Opportunities
- 12.5 Segment Growth Comparison
- 12.6 Segment Attractiveness and Priority Matrix
Chapter 13 India FMCG Geographic Market Outlook, 2025-2035
- 13.1 Regional Market Size and Country-Level Shares, 2025
- 13.2 Country Market Size Comparison, 2025
- 13.3 Country Market Forecasts, 2025-2035
- 13.4 Subregional Industrial and Demand Clusters
- 13.5 Intra-Regional Pricing and Cost Differences
- 13.6 Cross-Border Trade and Supply Networks
- 13.7 Regional Supply and Demand Balances
- 13.8 Country Opportunity Comparison and Prioritization
Note: Every listed country is covered on the structure shown under the first country.
Chapter 14 India FMCG Technology, Innovation and Sustainability Outlook
- 14.1 Technology Landscape and Maturity
- 14.2 Product, Process and Service Innovation
- 14.3 AI, Automation and Digital Tools in the Industry
- 14.4 Technology Adoption and Performance Benchmarking
- 14.5 Innovation Pipeline and R&D Investment
- 14.6 Patent and Intellectual Property Trends
- 14.7 Energy Efficiency and Resource Management
- 14.8 Sustainability, Recycling and Circularity
- 14.9 Technology Roadmap, 2025-2035
- 14.10 Risks of Obsolescence and Technology Substitution
Chapter 15 India FMCG Market Key Strategic Imperatives
- 15.1 Growth and Market Entry Priorities
- 15.2 High-Return Products and Segments
- 15.3 Pricing, Profitability and Cost Optimization
- 15.4 Technology Investment and Product Differentiation
- 15.5 Supply Chain Localization and Resilience
- 15.6 Distribution and Customer Acquisition
- 15.7 Partnership, Acquisition and Capacity Strategy
- 15.8 Regional Expansion Priorities
- 15.9 Short-, Medium- and Long-Term Actions
Chapter 16 Competition Outlook
- 16.1 Industry Competition Characteristics
- 16.2 Market Structure and Concentration
- 16.3 Market Share and Competitive Positioning, 2025
- 16.4 Company-Wise Revenue and Product Benchmarking
- 16.5 Production and Service Capacity Benchmarking
- 16.6 Technology, Pricing and Differentiation
- 16.7 Regional Footprint and Distribution Strength
- 16.8 Mergers, Acquisitions and Strategic Alliances
- 16.9 New Entrants and Competitive Threats
- 16.10 Porter's Five Forces and Industry Attractiveness
- 16.11 Competitive Outlook, 2025-2035
Chapter 17 Company Profiles
- 17.1 Company Coverage and Selection Criteria
- 17.2 Hindustan Unilever Limited
- 17.2.1 Business Description
- 17.2.2 Company Ownership and Geographic Presence
- 17.2.3 Product and Service Portfolio
- 17.2.4 Manufacturing and Operating Footprint
- 17.2.5 Production Capacity and Expansion Plans
- 17.2.6 Financial Performance and Investment
- 17.2.7 Market Share and Competitive Position
- 17.2.8 Technology and Innovation Capabilities
- 17.2.9 Strategic Alliances or Partnerships
- 17.2.10 Recent Developments
- 17.2.11 Growth Strategy and Outlook
- 17.3 ITC Limited
- 17.4 Nestlé India Limited
- 17.5 Britannia Industries Limited
- 17.6 Dabur India Limited
- 17.7 Marico Limited
- 17.8 Godrej Consumer Products Limited
- 17.9 Tata Consumer Products Limited
- 17.10 Colgate-Palmolive (India) Limited
- 17.11 Procter & Gamble Hygiene and Health Care Limited
- 17.12 Other Relevant Market Participants
Note: Every listed company is profiled on the structure shown under the first company. The company list is preliminary and may change based on research findings, market developments, data availability and client requirements.
Chapter 18 Disclaimer
- 18.1 Research and Forecast Disclaimer
- 18.2 Data Source and Estimation Limitations
Note: The depth of individual sections depends on data availability for this market. Volume, capacity, trade and other unit-based metrics are included where applicable.

