
Halal trust and botanical formulas widen natural care demand
The Indonesia natural personal care market was valued at USD 1.09 billion in 2025 and is projected to increase from USD 1.23 billion in 2026 to USD 3.17 billion by 2035, registering a CAGR of 11.16% during 2026–2035. Demand comes from young Muslim shoppers who want halal, plant-based skin and hair care, from families that trust jamu traditions, and from fast growth in social commerce. Java held the largest regional share, 58.4% in 2025, because most cosmetic plants, modern retailers and online buyers sit on the island. Sulawesi, Bali and Nusa Tenggara grow fastest at 11.95% a year, helped by spa tourism in Bali and the fastest regional economic growth in Sulawesi. All cosmetics sold in Indonesia must carry halal certification from Oct. 17, 2026, which turns certified botanical formulas into a clear trust signal for buyers.
Which botanical skin, hair and body products are counted?
The estimate measures retail sales value of natural and botanical personal care products in Indonesia, including skin care, hair care, bath and body and oral care made mainly from plant, mineral or traditional jamu ingredients. It covers products sold through online marketplaces, social commerce, beauty stores, pharmacies, supermarkets and brand outlets. Values are stated in USD million at current prices, converted from rupiah at average annual exchange rates.
The estimate excludes color cosmetics, fragrances, medicated products sold only through doctors and spa treatment fees. It also excludes conventional synthetic formulas that make no natural or botanical claim on the pack. The value chain runs from herb growers and imported ingredient suppliers through local and contract manufacturers to distributors, retailers, online sellers and households.
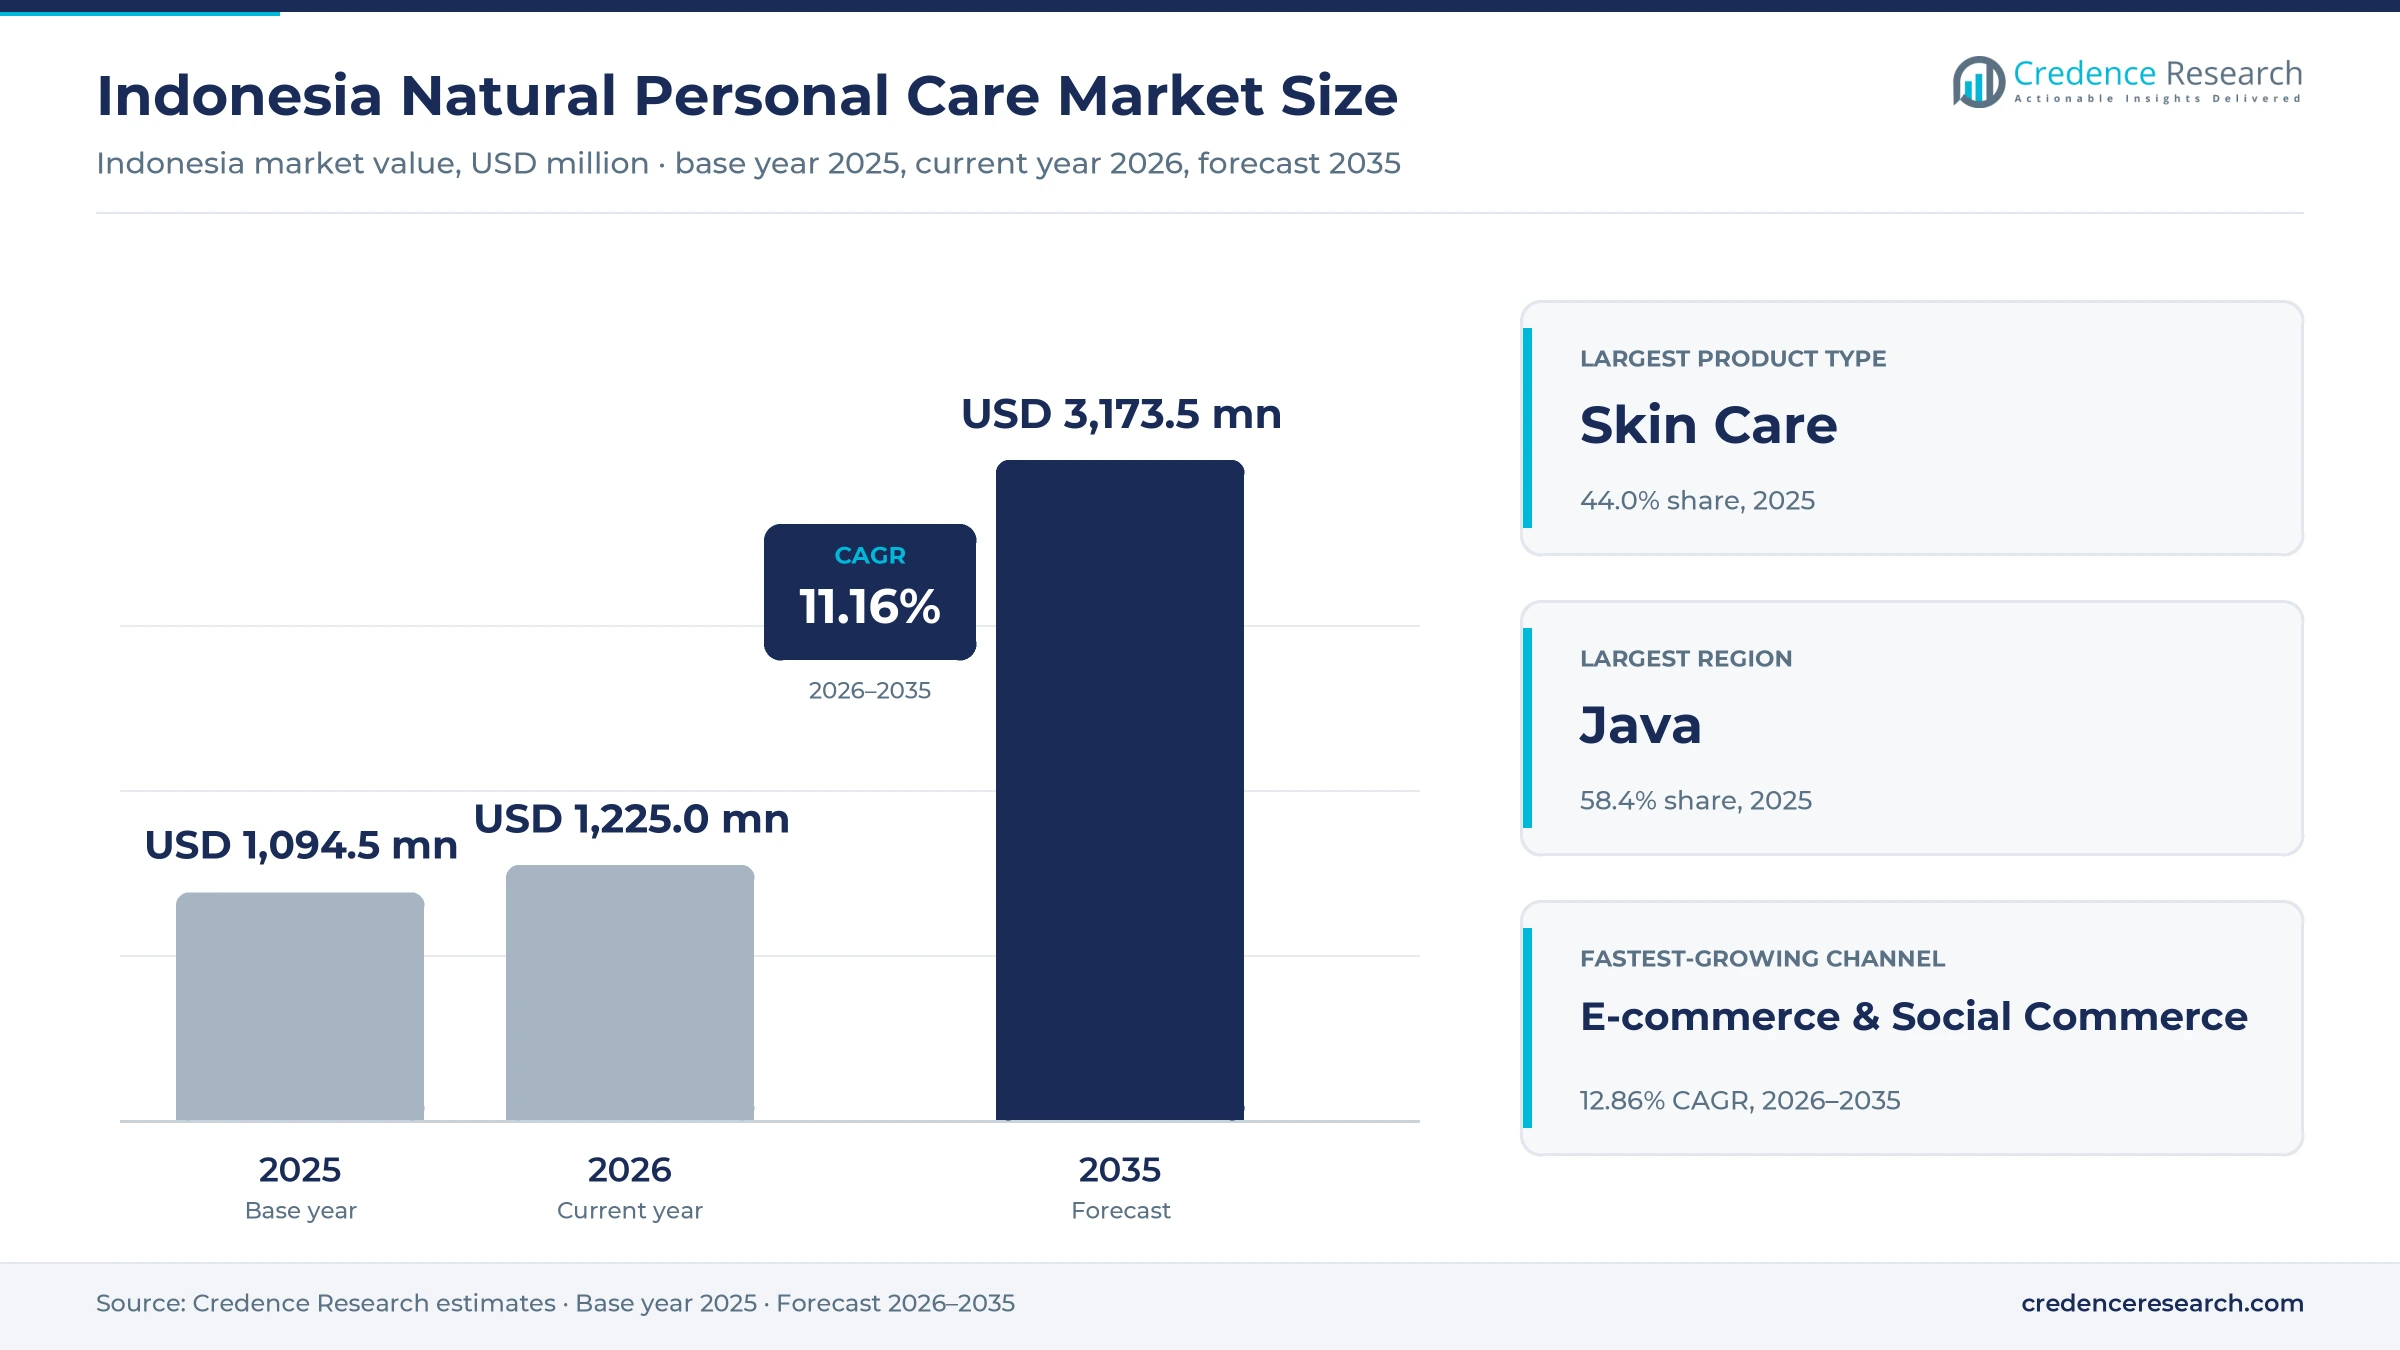
Indonesia Natural Personal Care Market Insights
- The Indonesia natural personal care market was valued at USD 1.09 billion in 2025 and is projected to reach USD 3.17 billion by 2035, registering a CAGR of 11.16% during 2026–2035.
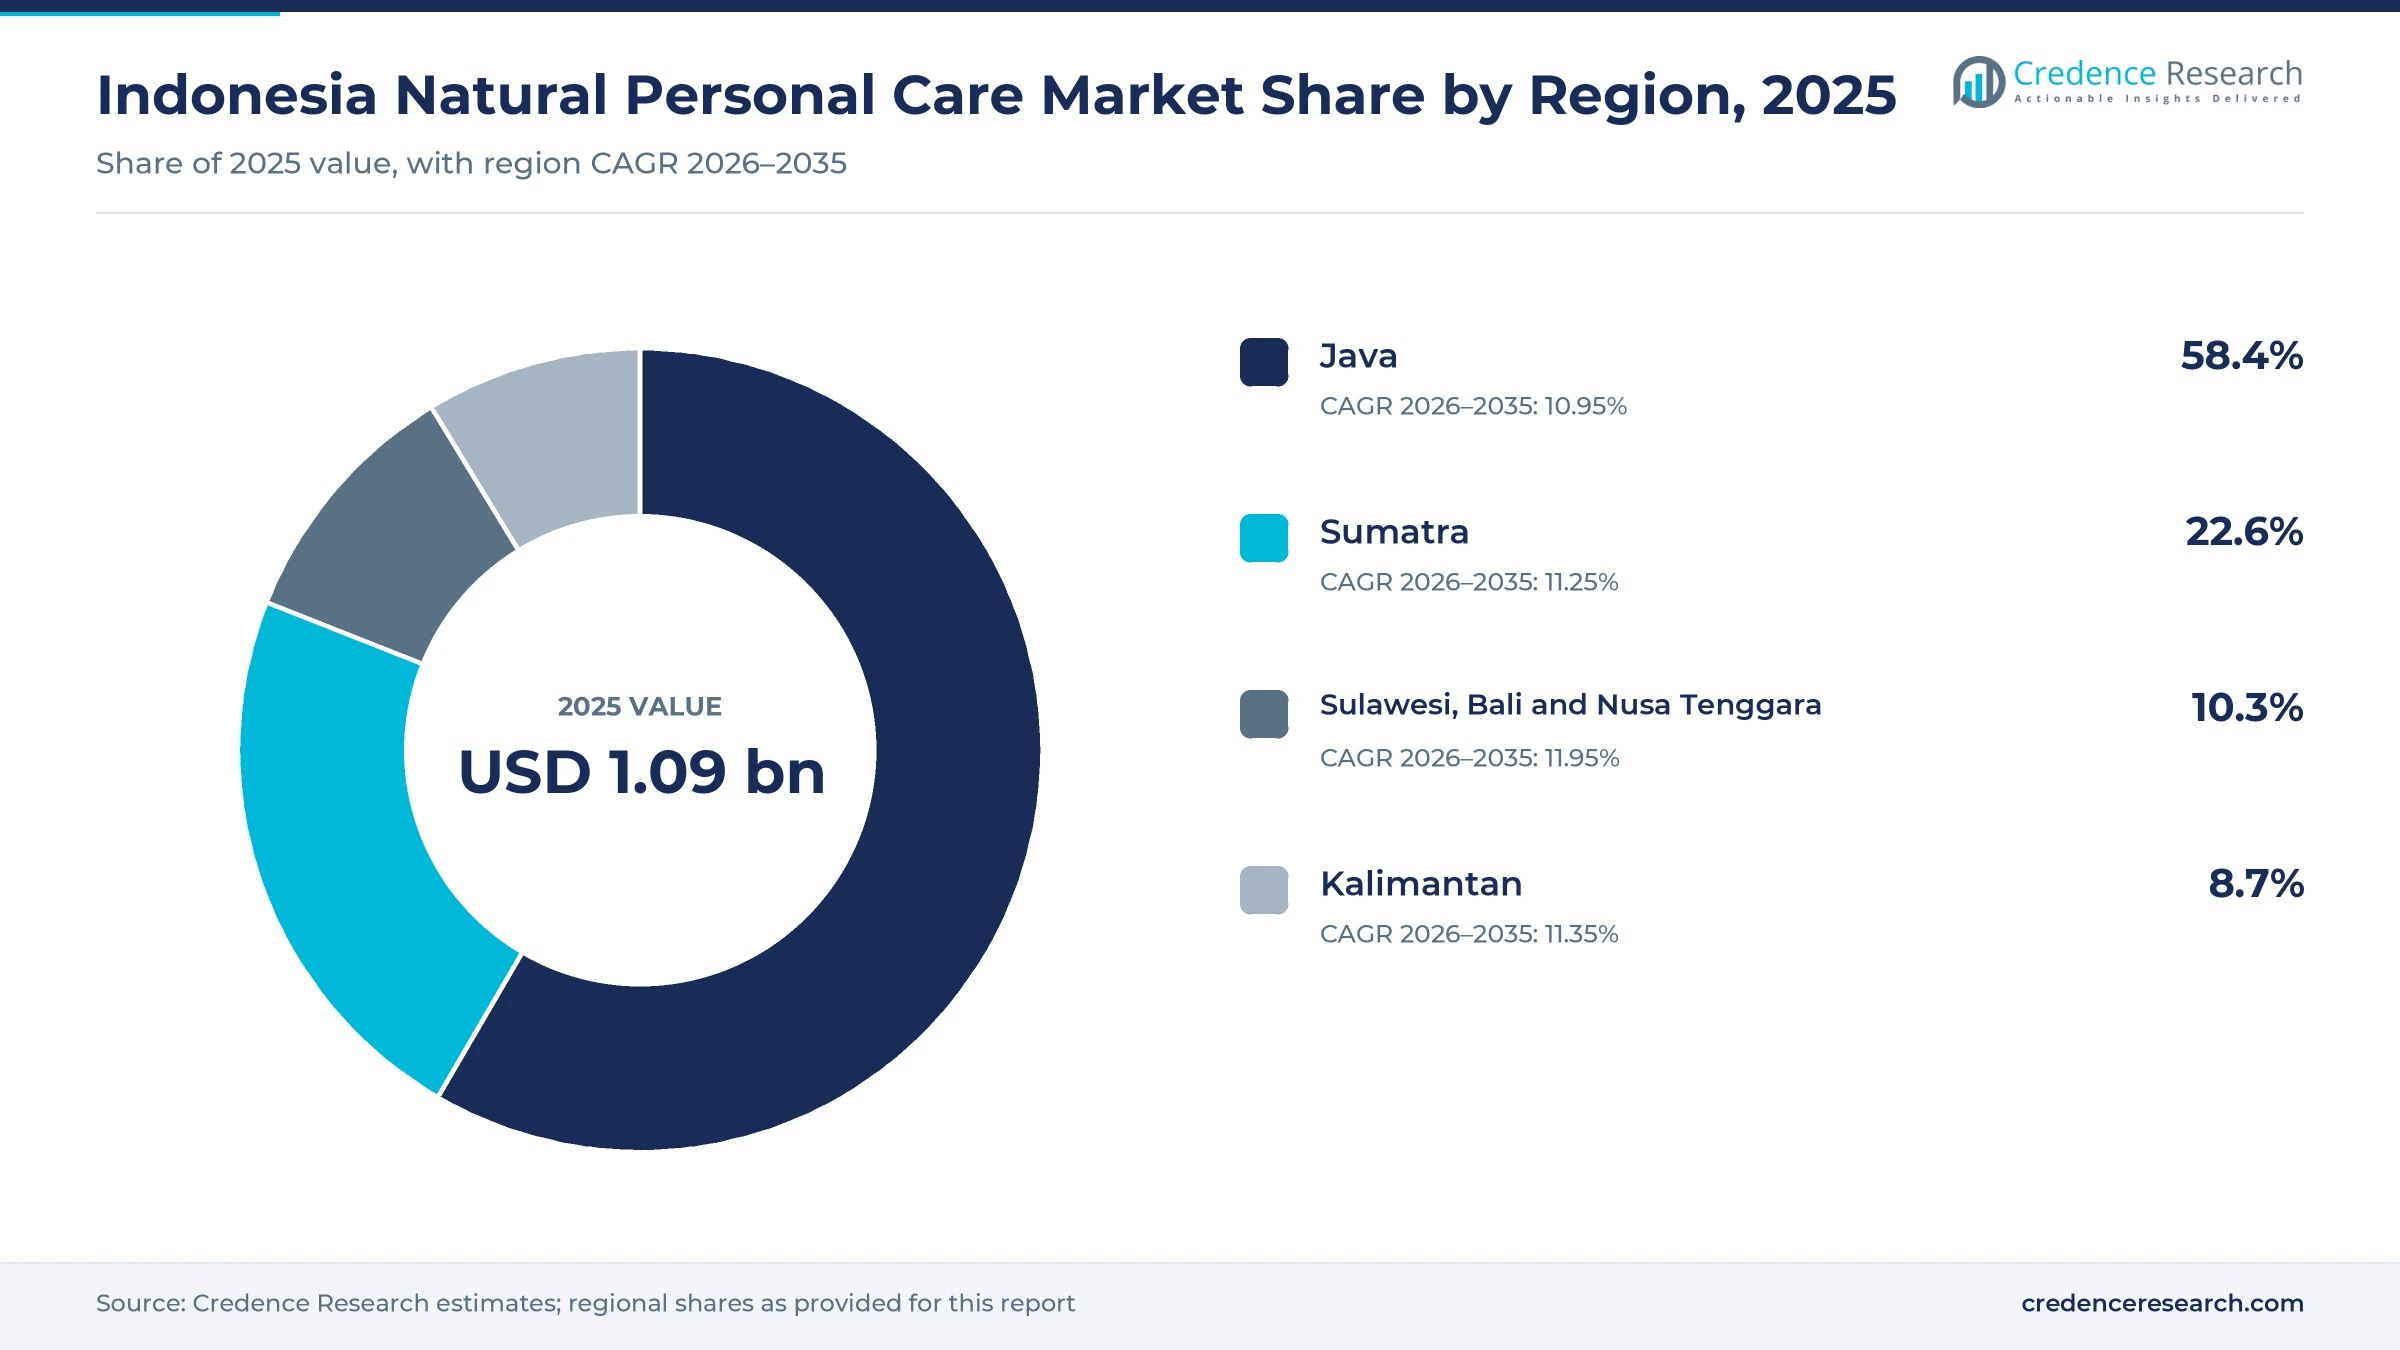
- Java held 58.4% of 2025 value, because the island hosts most cosmetic plants, modern retail outlets and online beauty buyers in the country.
- Skin care led with 44.0% of 2025 value, as young buyers build daily routines around cleansers, serums, moisturizers and sunscreen.
- Halal certification becomes mandatory for all cosmetics distributed in Indonesia from Oct. 17, 2026, which favors brands with certified botanical supply chains.
- E-commerce and social commerce grow fastest at 12.86% a year during 2026–2035, as more than 229 million internet users discover brands online.
Skin care and supermarket shelves carry the most value
Why does skin care lead natural personal care sales?
Based on product type, the market is categorized into skin care, hair care, bath and body, and oral care. Skin Care led with 44.0% of 2025 value, because young buyers build daily routines around cleansers, serums, moisturizers and sunscreen. Skin Care also grows fastest at 11.62% a year, as local brands launch plant-based barrier care, brightening and acne lines for teens and young adults.
How do price tiers shape natural care demand?
Based on price tier, the market is categorized into entry natural, masstige natural, premium natural and prestige botanical products. Entry Natural products led with 38.0% of 2025 value, because herbal soaps, shampoos and lotions sell widely in small packs and sachets. Premium Natural products grow fastest at 12.10% a year, as urban buyers pay more for clean formulas, local spa brands and visible ingredient claims.
Which channels sell most natural care products?
Based on distribution channel, the market is categorized into e-commerce and social commerce, beauty specialty retail, pharmacies and drugstores, and supermarkets and hypermarkets. Supermarkets & Hypermarkets led with 38.0% of 2025 value, because families buy herbal soaps, shampoos and toothpaste during weekly grocery trips. E-commerce & Social Commerce grows fastest at 12.86% a year, as live streaming and creator reviews push new botanical launches.
| Segment Group | Leading Sub-segment | Share, 2025 | Fastest-growing Sub-segment | CAGR, 2026–2035 |
|---|---|---|---|---|
| By Product Type | Skin Care | 44.0% | Skin Care | 11.62% |
| By Price Tier | Entry Natural | 38.0% | Premium Natural | 12.10% |
| By Distribution Channel | Supermarkets & Hypermarkets | 38.0% | E-commerce & Social Commerce | 12.86% |
Request a Free Sample
Fill in your details and we'll send you a free sample report.
- Sample data tables & charts
- Research methodology
Social commerce, local labs and halal rules lift sales
How do digital discovery and e-commerce widen reach?
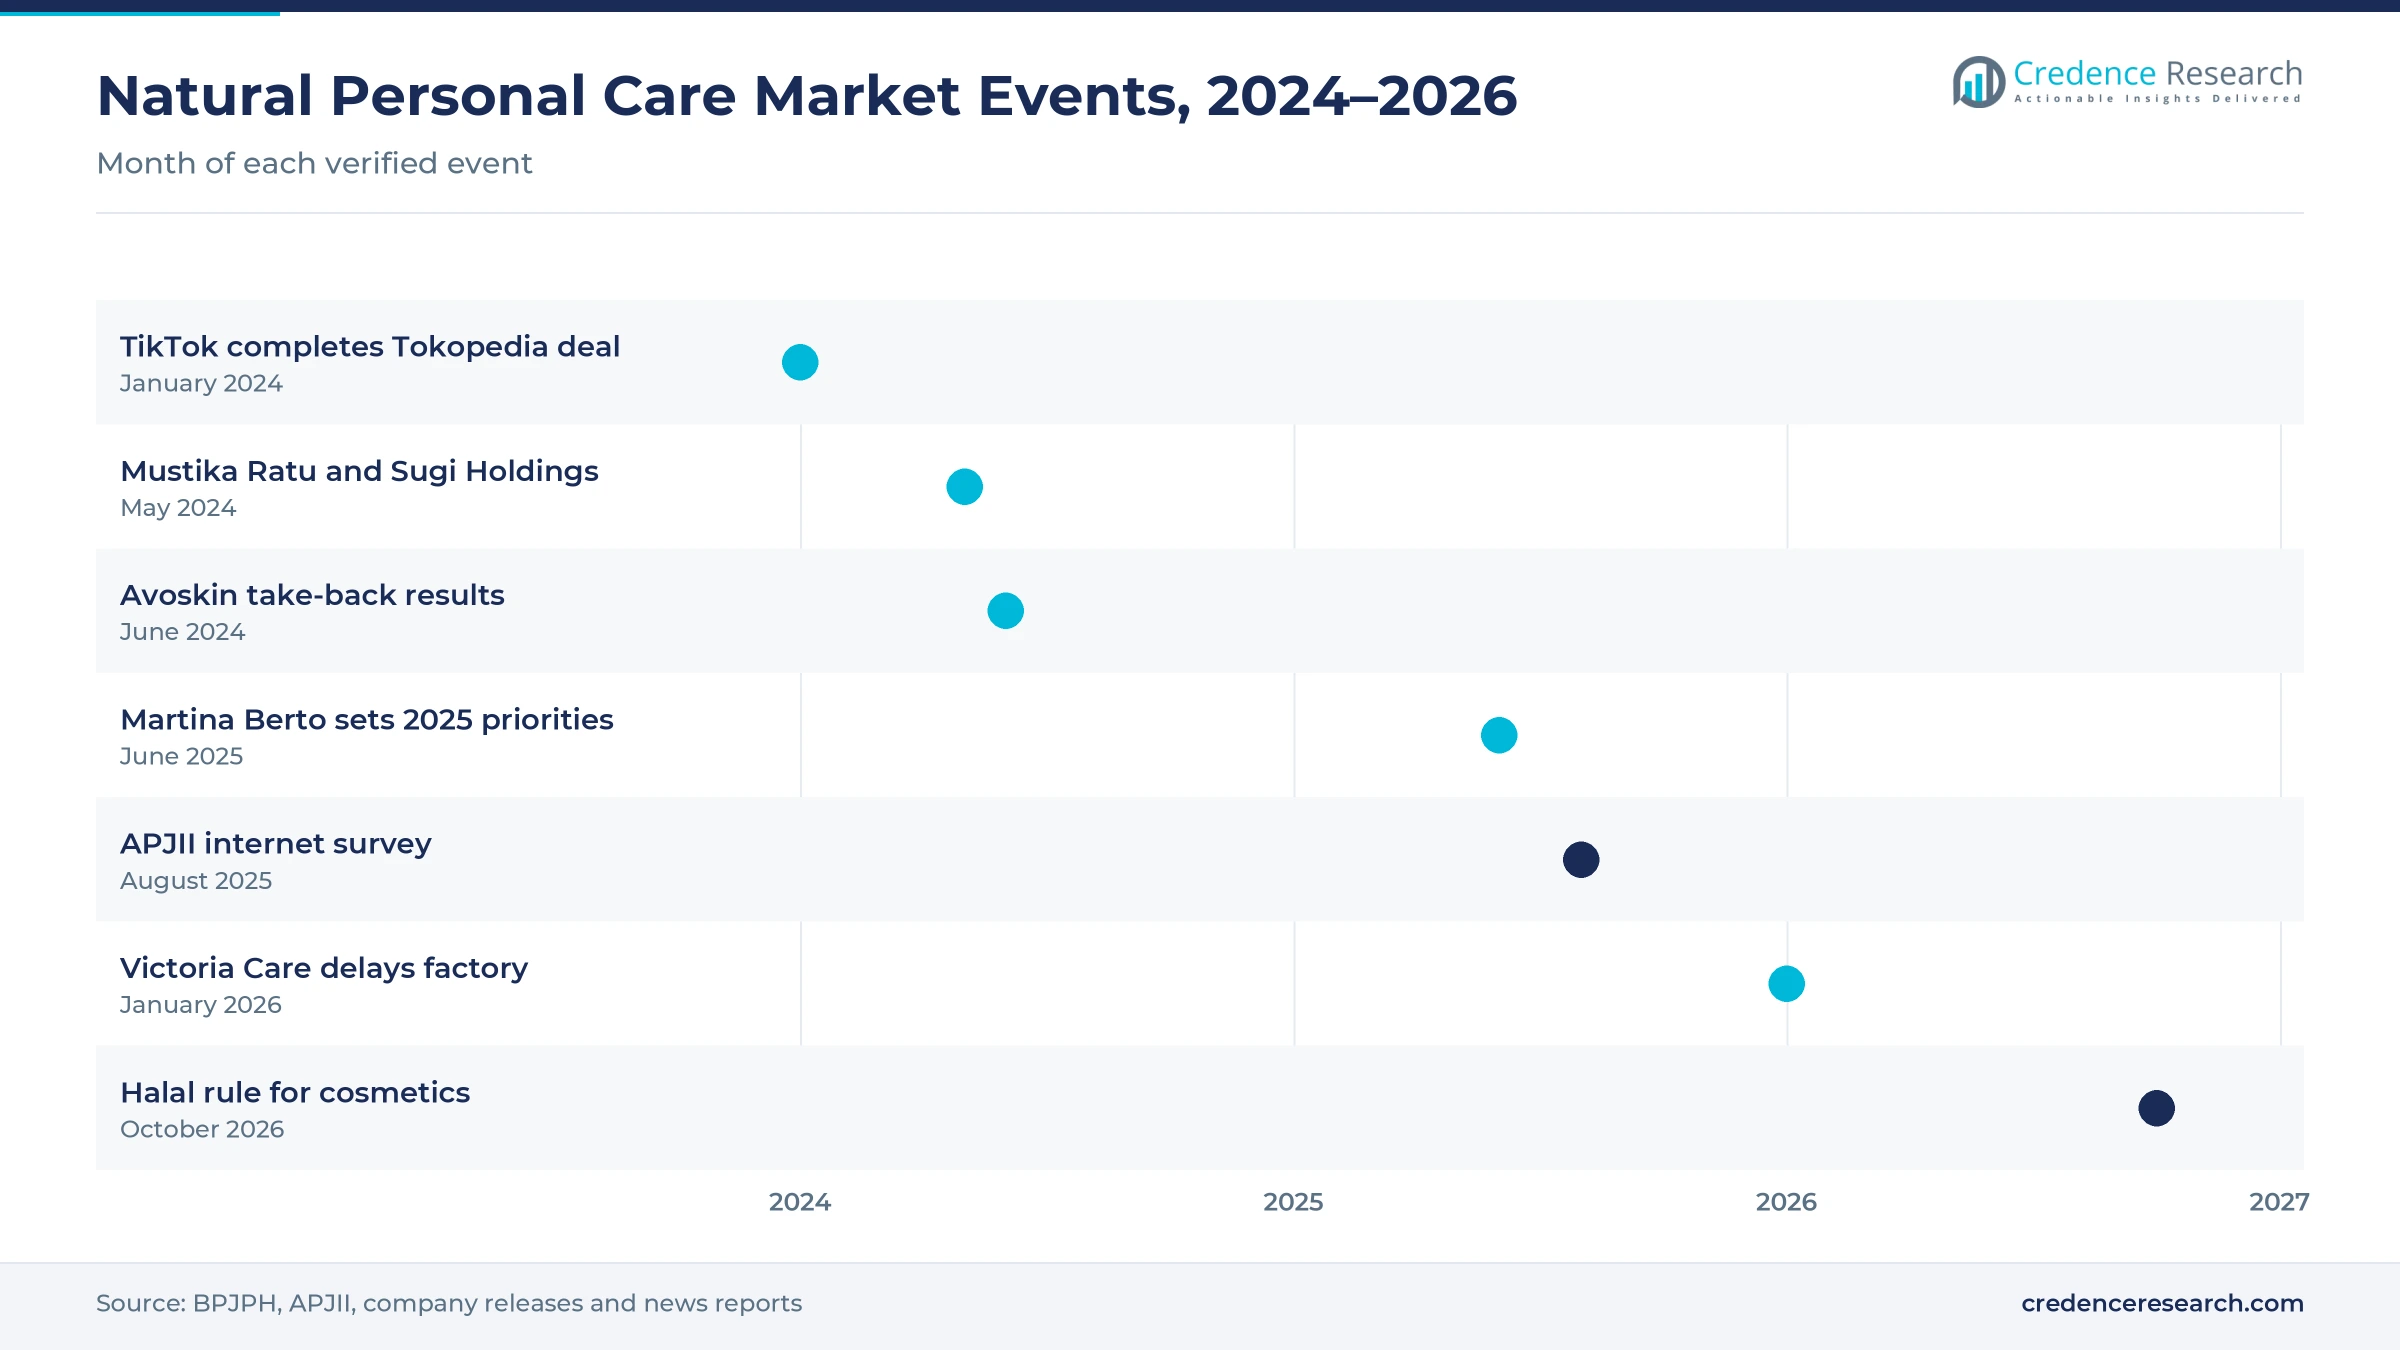
Digital discovery and e-commerce widen reach for natural brands, because shoppers now compare ingredients, halal labels and prices on their phones before buying. Indonesia had 229.43 million internet users in 2025, a penetration rate of 80.66%, according to an APJII survey. Java recorded the highest penetration at 84.69%, which keeps most online beauty orders on the island. TikTok completed its purchase of 75.01% of Tokopedia for $840 million in January 2024 and folded its Indonesian shop business into the merged platform. Martina Berto also named live streaming on TikTok Shop, Shopee and Tokopedia as a 2025 priority for its herbal brands. As a result, e-commerce and social commerce grow fastest at 12.86% a year through 2035.
Why does local manufacturing speed botanical innovation?
Local manufacturing speeds botanical innovation, because domestic producers can turn native herbs and plant oils into new formulas quickly. The number of cosmetic manufacturers in Indonesia rose from 1,292 in 2024 to more than 1,500 by the end of 2025, and about 90% are small and medium firms, according to BPOM data reported by Industry.co.id. Cosmetic exports also rose from USD 417 million in 2024 to USD 473.8 million in 2025. Wardah has launched several products since early 2025 that pair natural ingredients with beauty technology developed by ParagonCorp scientists. Sensatia Botanicals added a Cica and Mugwort skin care line for teens in 2025. In turn, skin care keeps attracting more new local launches than any other product type in the country.
How does halal certification build buyer trust?
Halal certification works as trust infrastructure, because Muslim shoppers use the label to judge both religious compliance and product safety. All cosmetics distributed in Indonesia must hold halal certification from Oct. 17, 2026, according to Personal Care Insights. A draft BPJPH decree asks each company to adopt a written halal policy and appoint a dedicated halal supervisor. Plant-derived ingredients are presumed halal under the draft, although processing additives still need checks, which favors botanical formulas. About 85% to 90% of cosmetic raw materials are still imported, according to LPPOM, so early certification gives local natural brands an edge. In May 2024, Mustika Ratu also partnered with Sugi Holdings of Japan to develop halal-certified beauty and health products.
Why does steady household spending support upgrades?
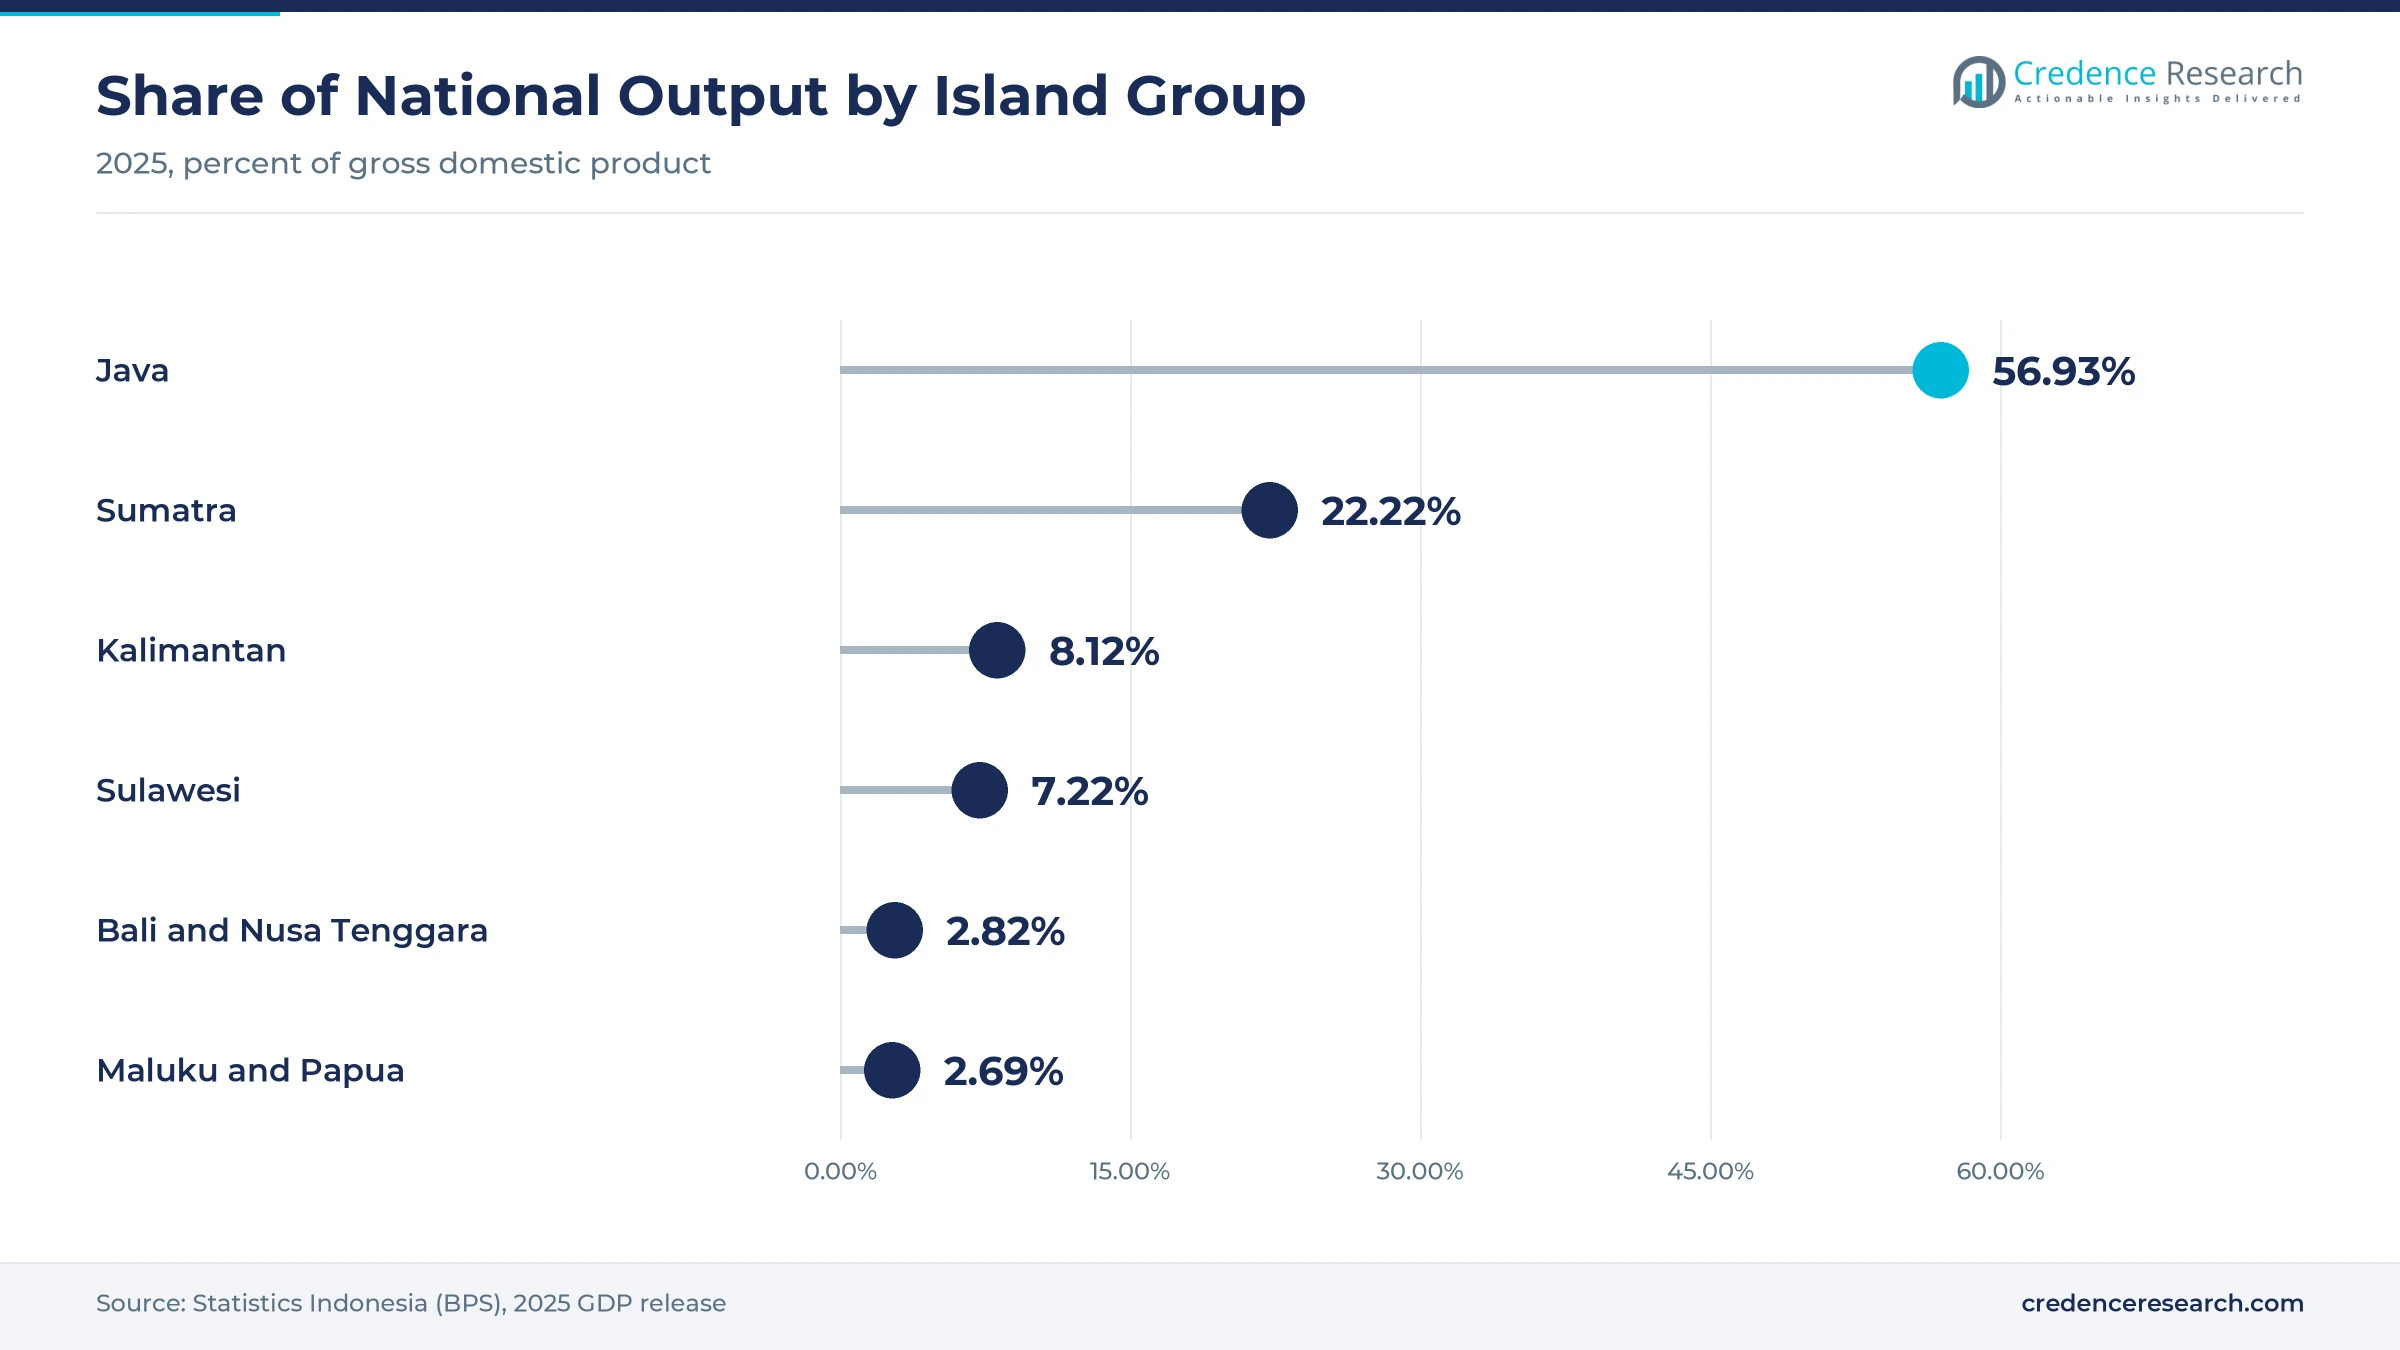
Steady household spending supports upgrades from basic herbal soaps and shampoos to natural formulas with clearer ingredient stories. Household final consumption in Indonesia grew 5.1% in 2024, according to World Bank data. The national economy then grew 5.11% in 2025, up from 5.03% in 2024, according to Statistics Indonesia. Java contributed 56.93% of national output in 2025, while Sulawesi posted the fastest regional growth at 6.23%. These gains let more households add a serum, a body lotion or a premium shampoo to their routine. Therefore, premium natural products grow at 12.10% a year through 2035, faster than entry packs, as urban buyers trade up within the natural category.
Teen lines, refills and halal exports reshape the category
How is the shift to teen and barrier care lines playing out?
Natural care brands are shifting toward gentle barrier care lines for teens and young adults, who now start skin routines earlier. Sensatia Botanicals launched a Cica and Mugwort collection for teens during 2025, its 25th year in business. The brand also expanded its retail network to more than 40 stores across Indonesia in 2025. Mustika Ratu introduced a fragranced body lotion and a body serum with five growth factors at the Puteri Indonesia 2025 pageant, claiming 12 times more effective hydration for the lotion. Wardah also built Light+ with nano niacinamide aimed at young buyers who want gentle results. As a result, skin care grows at 11.62% a year, faster than any other product type through 2035.
Why are refill and low-waste packs rising?
Refill and low-waste packs are rising, because buyers of natural products also expect brands to reduce plastic waste. Avoskin collected about 40,000 used packaging units in the first quarter of 2024 through its take-back program, according to SWA. Utama Spice in Bali says it uses only 100% pure natural ingredients and supports local organic, bee and seaweed farming. Sensatia also lists Clean Environment as one of the three pillars of its 2025 clean beauty strategy. Sachets and refill pouches remain common in entry packs, which lets brands lower plastic use per wash. In turn, suppliers of cosmetic packaging can offer lighter pouches and recyclable bottles to local brands.
Can halal-certified exports open new markets?
Halal-certified exports offer a clear opening, because Indonesian botanical brands can sell the same certified formulas to Muslim buyers abroad. Cosmetic exports rose about 14% to USD 473.8 million in 2025, which shows that overseas demand is already growing. Martina Berto named exports to Southeast Asia and the Middle East as a 2025 focus for Sariayu and its other herbal brands. Kao released a halal-certified Biore deodorant in Indonesia in 2026 and plans to make halal sunscreen locally in 2027. Demand for halal cosmetics can also travel with these exports to other Muslim-majority markets. Brands that certify early under the Oct. 17, 2026 rule could therefore reach export buyers with fewer extra audits.
Is there room for spa-inspired wellness and body care?
Spa-inspired wellness and body care offer a second opening, because Bali tourism exposes visitors to Balinese herbal rituals that they want to repeat at home. Utama Spice draws on Balinese herbal knowledge and makes scrubs, body butters and essential oils in its own workshop. Victoria Care runs the Oemah Herborist education site in Bali, where visitors learn how body care products are made. The Bali and Nusa Tenggara economy grew 4.87% in 2025, which kept resort and spa spending on these islands growing steadily. As a result, the eastern islands grow faster than Java through 2035, with bath and body products selling strongly in resorts and brand stores.
Illegal imports, imported inputs and weak demand weigh
How do unregistered imports undercut local brands?
Unregistered imports undercut local brands, because they reach buyers at lower prices without safety checks or halal audits. BPOM confiscated over 2 million units of unregistered cosmetics across 956 product lines, worth an estimated Rp 27.6 billion, and most were sold through e-commerce. As a result, honest natural brands lose sales and face doubts about product safety. Stronger platform checks, faster product notification and buyer education help reduce this risk over time.
Why do imported raw materials raise compliance costs?
Imported raw materials raise compliance costs, because most cosmetic inputs still come from abroad and each one needs halal documents. Companies must gather certificates for raw materials, additives and processing aids before the 2026 deadline. The draft rules also demand separate halal and non-halal equipment, which adds cost for small makers. Consequently, local herb sourcing and shared certification help reduce paperwork for small natural brands.
How does weak demand delay capacity plans?
Weak demand can delay capacity plans, because tight competition and rising operating costs squeeze margins for mid-sized makers. Victoria Care Indonesia postponed plans to build and expand a new factory in January 2026 after missing its growth targets for 2025. The company cited intense competition, changing buyer habits and higher costs. In turn, slower capacity growth can limit new natural launches in the mass tier until demand improves.
Do vague natural claims erode buyer trust?
Vague natural claims can erode trust, because buyers cannot easily check whether a product is mostly botanical or only contains a small plant extract. Social media reviews can quickly expose weak claims and damage a young brand. Therefore, clear ingredient lists, test results and halal labels matter more for natural brands than for conventional products. Brands that publish sourcing details are better placed to keep repeat buyers.
Java leads while the eastern islands grow fastest
| Region | Value, 2025 (USD billion) | Share, 2025 | CAGR, 2026–2035 |
|---|---|---|---|
| Java | 0.64 | 58.4% | 10.95% |
| Sumatra | 0.25 | 22.6% | 11.25% |
| Sulawesi, Bali and Nusa Tenggara | 0.11 | 10.3% | 11.95% |
| Kalimantan | 0.10 | 8.7% | 11.35% |
Why does Java lead natural personal care spending?
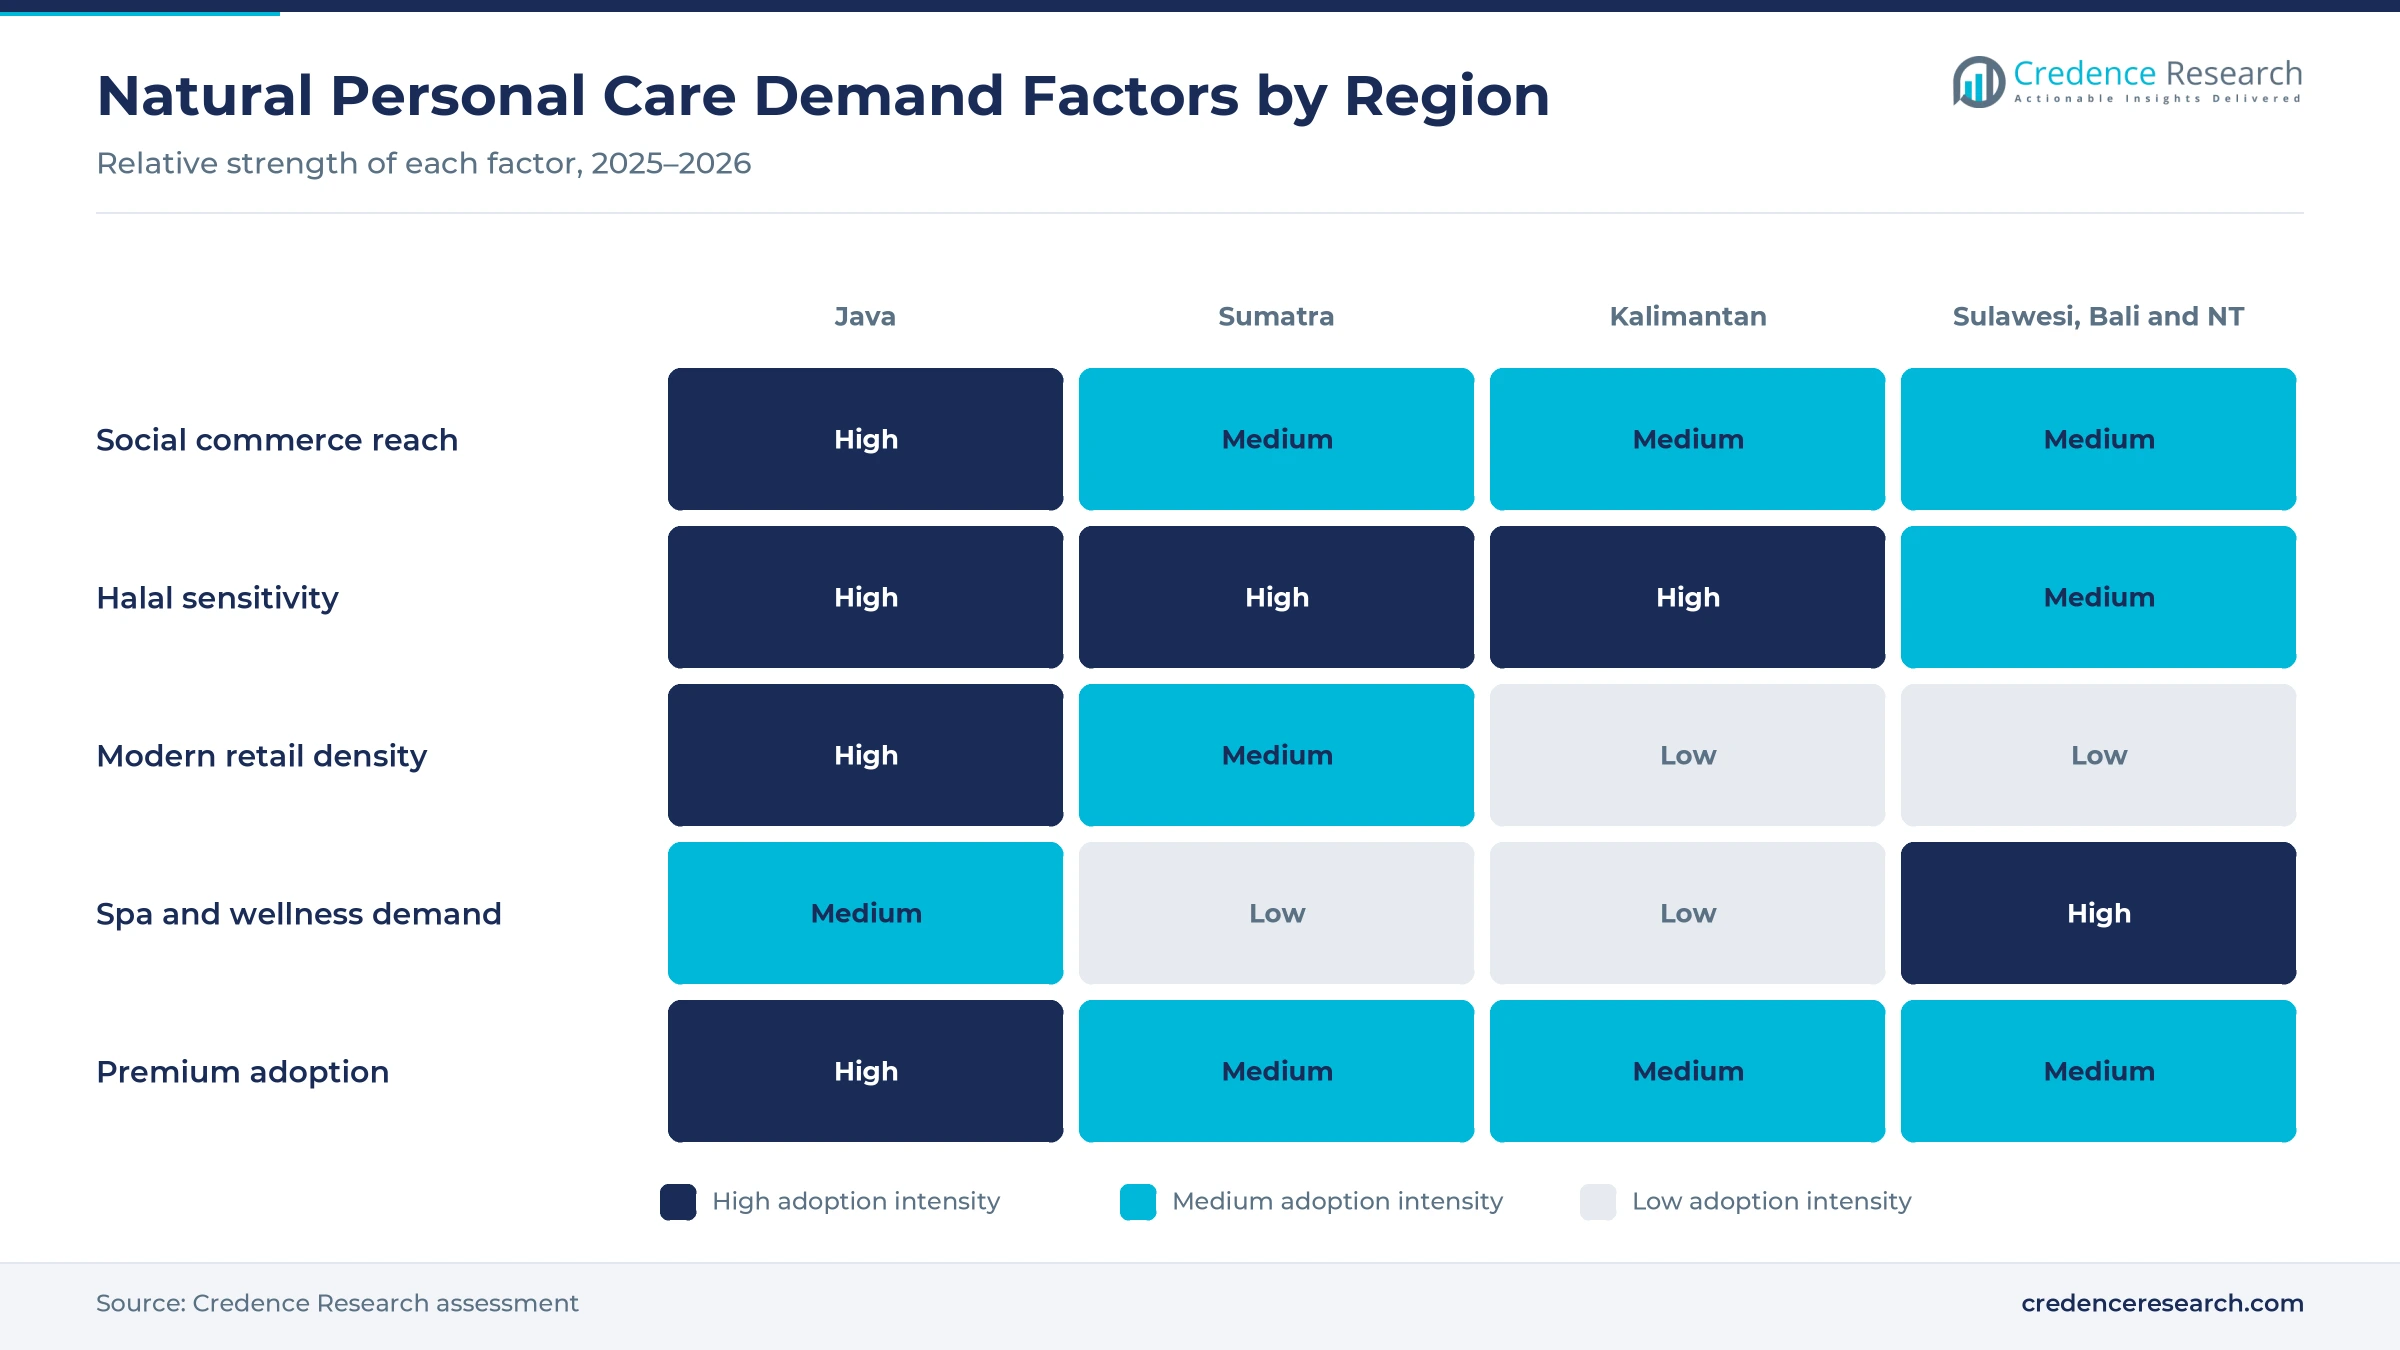
Java held 58.4% of 2025 value and grows at 10.95% a year, because the island hosts the largest cities, most cosmetic factories and the densest modern retail. Java contributed 56.93% of national output in 2025 and grew 5.30%, according to Statistics Indonesia. Internet penetration on Java reached 84.69% in 2025, the highest of any island group. ParagonCorp runs its production and research site in Tangerang, which keeps new Wardah launches close to Java buyers.
How does Sumatra add steady volume?
Sumatra held 22.6% of 2025 value and grows at 11.25% a year, because large Muslim populations in Medan, Palembang and Padang favor halal herbal care. Sumatra contributed 22.22% of national output in 2025 and grew 4.81%, up from 4.45% in 2024. Supermarkets and drugstores sell most entry natural soaps and shampoos in the region, while online marketplaces help local brands reach smaller towns.
What shapes Kalimantan demand?
Kalimantan held 8.7% of 2025 value and grows at 11.35% a year, because mining and plantation incomes support spending in Balikpapan, Banjarmasin and Pontianak. Kalimantan contributed 8.12% of national output in 2025, although growth slowed to 4.79% from 5.52% in 2024. Supermarkets in the larger cities carry most entry natural soaps and shampoos, while online orders reach towns that have few beauty stores.
Why are Sulawesi, Bali and Nusa Tenggara growing fastest?
Sulawesi, Bali and Nusa Tenggara held 10.3% of 2025 value and grow fastest at 11.95% a year. Sulawesi posted the fastest regional economic growth at 6.23% in 2025, while Bali hosts spa brands such as Utama Spice and Sensatia Botanicals. Tourist demand for Balinese body care also supports premium natural products sold in resorts and brand stores.
Platform deals, halal partnerships and factory delays
| Development | Status and market relevance |
|---|---|
| In January 2024, TikTok completed its purchase of 75.01% of Tokopedia for $840 million and merged its Indonesian shop business into the platform. | Strengthens social commerce reach for local beauty brands |
| In May 2024, Mustika Ratu agreed to work with Sugi Holdings of Japan on halal-certified beauty and health products. | Pairs jamu heritage with Japanese product technology |
| In June 2025, Martina Berto named natural, halal-certified products, live streaming and exports as its 2025 priorities. | Supports Sariayu and other herbal brands online and abroad |
| In January 2026, Victoria Care Indonesia postponed plans to build and expand a new factory after missing its 2025 targets. | Shows margin pressure on mid-sized makers |
| In June 2026, details of a draft BPJPH decree set halal rules for cosmetics ahead of the Oct. 17, 2026 deadline. | Requires halal policies, supervisors and ingredient records |
Nano actives, halal systems and refill packs change formats
- Nano-encapsulated actives such as the nano niacinamide in Light+ by Wardah aim to deliver brighter skin while staying gentle on the skin barrier.
- Halal assurance systems track every raw material, additive and processing aid, which lets brands show buyers and regulators a clean audit trail.
- Botanical extracts such as cica, mugwort, turmeric and other jamu herbs give local brands clear claims that compete with K-beauty products on the same shelves.
- Refill and take-back packs reduce plastic use and lower cost per use, which helps natural brands match their packaging to their ingredient story.
Need a Custom Version of This Report?
Tailor the scope, geography, or segments to your exact requirements.
- Custom geography or segment scope
- Direct access to our analyst team
Halal pioneers, jamu houses and indie brands compete
Competition is led by domestic halal pioneers, with strong challenges from jamu houses, Bali spa brands and digital-first labels. ParagonCorp sells Wardah, Indonesia's best known halal beauty brand, and runs production and research in Tangerang. Mustika Ratu and Martina Berto build on decades of jamu and herbal heritage through brands such as Mustika Ratu and Sariayu. Victoria Care sells Herborist body care, while Sensatia Botanicals and Utama Spice compete on Balinese natural ingredients. Avoskin competes on skin care actives and a packaging take-back program for used bottles and jars. Brands compete on halal status, ingredient claims, price per use, creator marketing and reach on social commerce platforms. Multinational suppliers also shape the shelf, because Kao now sells halal-certified products in Indonesia. Companies that combine plant extracts with vegan cosmetic ingredients can also appeal to buyers who avoid animal-derived inputs.
Companies profiled and their roles in this market
| Company | Type | Role in the market |
|---|---|---|
| PT Paragon Technology and Innovation (Wardah) | Domestic company | Sells Wardah and Light+; launched natural-ingredient products from its own scientists in 2025 |
| PT Mustika Ratu Tbk | Domestic company | Jamu-based beauty; partnered with Sugi Holdings on halal products in 2024 |
| PT Martina Berto Tbk | Domestic company | Sells Sariayu; set natural, halal and export priorities in 2025 |
| PT Victoria Care Indonesia Tbk | Domestic company | Sells Herborist; runs Oemah Herborist in Bali |
| Sensatia Botanicals | Bali brand | Clean beauty brand with more than 40 stores and a 2025 teen line |
| AVO Innovation & Technology (Avoskin) | Digital-first company | Runs a packaging take-back program |
| Utama Spice | Bali brand | Makes all-natural skin and body care using Balinese herbal knowledge |
Credence Research view on halal-led botanical growth
Credence Research's view is that Indonesian natural personal care will grow quickly through 2035, because halal rules and social commerce reward brands with clear botanical stories. The Oct. 17, 2026 halal deadline should remove many unregistered imports and favor certified local makers. Skin care already holds 44.0% of Indonesia natural personal care demand in 2025. More than 1,500 cosmetic manufacturers now operate in the country, which keeps launch activity high. However, imported inputs, tight margins and weak mass demand could slow smaller brands. Skin care and online channels should keep leading growth across Java and the fast-growing eastern islands.
How the natural care spending estimate was built
The report uses 2025 as the base year, with values in USD million at current prices. Market values come from the Credence Research model, which combines population, internet use, household spending, product penetration and average prices. Regional shares are those set for this report, and segment splits by product type, price tier and channel are Credence Research estimates. Sources used are government statistics, regulator notices, World Bank data, company releases and news reports, and no interviews or surveys were used.
Halal compliance and online reach set the path to 2035
The market is expected to reach USD 3.17 billion by 2035, an 11.16% CAGR during 2026–2035, as halal certification, rising incomes and online discovery lift demand for botanical products. Growth should be strongest in Sulawesi, Bali and Nusa Tenggara and in social commerce, while Java keeps the largest share. Skin care and premium natural tiers will gain share in every region. Local brands that certify early and source herbs at home should win share. In contrast, a surge in unregistered imports or higher ingredient costs would slow value growth in the entry tier.
Frequently Asked Questions
How big is the Indonesia natural personal care market?
Which region leads natural personal care sales in Indonesia?
Which region grows fastest?
When does halal certification become mandatory for cosmetics?
Which product type holds the largest share?
Which sales channel grows fastest?
Who are the leading natural personal care companies in Indonesia?
What are the main risks to growth?
Table of Content
Chapter 1 Market Segmentation
- 1.1 Segmentation Framework
- 1.1.1 Product and Service Classification
- 1.1.2 Application and End-Use Classification
- 1.1.3 Technology and Solution Classification
- 1.1.4 Customer and Distribution Channel Classification
- 1.1.5 Geographic Segmentation
- 1.1.6 Market Segment Definitions and Boundaries
- 1.2 By Product Type
- 1.2.1 Skin Care
- 1.2.2 Hair Care
- 1.2.3 Bath & Body
- 1.2.4 Oral Care
- 1.3 By Price Tier
- 1.3.1 Entry Natural
- 1.3.2 Masstige Natural
- 1.3.3 Premium Natural
- 1.3.4 Prestige Botanical
Chapter 2 Introduction
- 2.1 Report Objectives and Scope
- 2.2 Product Definition and Industry Terminology
- 2.3 Market Inclusions and Exclusions
- 2.4 Research Process
- 2.4.1 Primary Research and Expert Interviews
- 2.4.2 Secondary Research and Source Review
- 2.4.3 Top-Down and Bottom-Up Estimation
- 2.4.4 Data Triangulation and Verification
- 2.5 Market Size Measurement Basis
- 2.5.1 2025: USD 1.09 billion → 2035: USD 3.17 billion
- 2.6 Historical and Forecast Reference Periods
- 2.6.1 Historical Period: 2018-2025
- 2.6.2 Base Year: 2025
- 2.6.3 Forecast Period: 2025-2035
- 2.7 Research Assumptions and Limitations
Chapter 3 Executive Summary
- 3.1 Market Snapshot and Key Findings
- 3.2 Base-Year Market Size, 2025
- 3.3 Forecast Market Size, 2035
- 3.4 Revenue and Volume Growth Outlook
- 3.5 Key Demand and Supply Indicators
- 3.6 Leading Market Segments
- 3.7 Fastest-Growing Market Opportunities
- 3.8 Regional Performance Highlights
- 3.9 Technology and Industry Transformation
- 3.10 Competitive Landscape Summary
- 3.11 Analyst View and Strategic Implications
Chapter 4 Indonesia Natural Personal Care Market Trends and Developments
- 4.1 Historical Industry Development, 2018-2025
- 4.2 Recent Market Trends and Developments
- 4.3 Demand and Customer Behavior Trends
- 4.4 Technology and Product Innovation
- 4.5 Artificial Intelligence, Automation and Digitalization
- 4.6 Local Manufacturing and Supply Chain Realignment
- 4.7 Industry Partnerships, Mergers and Acquisitions
- 4.8 Sustainability and Circular Economy Developments
- 4.9 Government and Private Sector Investment Trends
- 4.10 Emerging Business Models and Commercialization
- 4.11 Industry Developments and Announcements
Chapter 5 Indonesia Natural Personal Care Market Production, Supply and Demand Analysis
- 5.1 Demand Trend and Consumption Analysis, 2018-2025
- 5.2 Demand Forecast, 2025-2035
- 5.3 Production and Output Trend, 2018-2025
- 5.4 Production and Output Forecast, 2025-2035
- 5.5 Installed Capacity and Capacity Utilization
- 5.6 Company-Wise Production Plants and Statistics
- 5.6.1 Installed Production Capacity
- 5.6.2 Actual Production
- 5.6.3 Planned Capacity and Expansion Targets
- 5.7 Supply Chain Structure and Procurement Trends
- 5.8 Supply-Demand Gap and Bottlenecks
- 5.9 Import Dependence and Sourcing Structure
- 5.10 Contract Manufacturing and Outsourcing
- 5.11 Regional Supply and Demand Concentration
Chapter 6 Indonesia Natural Personal Care Market Pricing Analysis
- 6.1 Pricing Structure and Measurement
- 6.2 Historical Pricing Trends, 2018-2025
- 6.3 Pricing Outlook, 2025-2035
- 6.4 Average Selling Price and Unit Economics
- 6.5 Pricing by Product and Market Segment
- 6.6 Geographic Pricing Differences
- 6.7 Key Input, Energy, Labor and Logistics Costs
- 6.8 Contract Pricing and Purchasing Models
- 6.9 Pricing Sensitivity and Competitive Positioning
- 6.10 Price, Margin and Profitability Implications
Chapter 7 Indonesia Natural Personal Care Market Dynamics
- 7.1 Market Growth Drivers
- 7.1.1 Demand-Side Drivers
- 7.1.2 Technology and Innovation Drivers
- 7.1.3 Infrastructure and Investment Drivers
- 7.1.4 Regulatory and Policy Drivers
- 7.2 Market Restraints
- 7.2.1 Cost and Affordability Constraints
- 7.2.2 Technology and Adoption Barriers
- 7.2.3 Supply Chain and Operational Constraints
- 7.3 Market Challenges
- 7.3.1 Competitive Pressure and Margin Erosion
- 7.3.2 Skills, Infrastructure and Implementation Gaps
- 7.4 Emerging Market Opportunities
- 7.5 Market Dynamics Impact and Time-Horizon Assessment
Chapter 8 Indonesia Natural Personal Care Value Chain Analysis
- 8.1 Industry Value Chain Overview
- 8.2 Upstream Suppliers and Critical Inputs
- 8.3 Technology and Component Providers
- 8.4 Manufacturing or Service Delivery
- 8.5 Distribution, Channel Partners and Integrators
- 8.6 Downstream Applications and End Users
- 8.7 Value Addition and Profit Pools
- 8.8 Vertical Integration and Outsourcing
- 8.9 Supplier Concentration and Risk
- 8.10 Supply Chain Localization and Resilience
Chapter 9 Indonesia Natural Personal Care Market Regulations and Policies
- 9.1 Relevant Laws, Standards and Compliance Frameworks
- 9.2 Product, Service, Safety and Quality Requirements
- 9.3 Government Policies, Incentives and Subsidies
- 9.4 Imports, Exports and Trade Barriers
- 9.5 Public Procurement and Local Content Requirements
- 9.6 Environmental and Sustainability Compliance
- 9.7 Upcoming Policy Changes and Market Implications
Chapter 10 Indonesia Natural Personal Care Market Hotspots and Opportunities
- 10.1 Market Opportunity Mapping and Growth Hotspots
- 10.2 High-Growth Applications and Customer Groups
- 10.3 Underserved Markets and White-Space Opportunities
- 10.4 Emerging Technology and Product Opportunities
- 10.5 New Capacity and Investment Hotspots
- 10.6 Market Entry and Expansion Opportunities
- 10.7 Distribution and Partnership Opportunities
- 10.8 Near-Term and Long-Term Commercial Potential
- 10.9 Opportunity Attractiveness and Execution Risks
Chapter 11 Indonesia Natural Personal Care Market Outlook, 2025-2035
- 11.1 Market Size and Analysis
- 11.1.1 Revenue (Market Measurement: 2025: USD 1.09 billion → 2035: USD 3.17 billion)
- 11.1.2 Market Volume and Quantity Sold
- 11.1.3 Historical Market Size, 2018-2025
- 11.1.4 Base-Year Market Size, 2025
- 11.2 Market Forecast, 2025-2035
- 11.2.1 Revenue Forecast to 2035
- 11.2.2 Volume Forecast to 2035
- 11.2.3 CAGR and Year-on-Year Growth
- 11.2.4 Incremental Revenue Opportunity
- 11.3 Forecast Assumptions and Scenario Analysis
- 11.3.1 Base-Case Forecast
- 11.3.2 Optimistic and Conservative Scenarios
- 11.3.3 Technology, Pricing and Policy Sensitivities
- 11.4 Market Attractiveness and Growth Outlook
Chapter 12 Indonesia Natural Personal Care Market Segmentation and Outlook
- 12.1 Segmentation Summary and Market Shares, 2025
- 12.2 Largest and Fastest-Growing Segments
- 12.3 By Product Type - Market Size and Forecast, 2025-2035
- 12.3.1 Segment Definition and Scope
- 12.3.2 Historical Market Size, 2018-2025
- 12.3.3 Revenue Forecast, 2025-2035
- 12.3.4 Volume Forecast, 2025-2035
- 12.3.5 Base-Year Market Share, 2025
- 12.3.6 Segment CAGR and Growth Drivers
- 12.3.7 Subsegment Market Size and Forecast
- 12.3.7.1 Skin Care
- 12.3.7.2 Hair Care
- 12.3.7.3 Bath & Body
- 12.3.7.4 Oral Care
- 12.3.8 Subsegment Pricing and Adoption Trends
- 12.3.9 Leading Suppliers and Competition
- 12.3.10 Regional Demand and Opportunities
- 12.4 By Price Tier - Market Size and Forecast, 2025-2035
- 12.4.1 Segment Definition and Scope
- 12.4.2 Historical Market Size, 2018-2025
- 12.4.3 Revenue Forecast, 2025-2035
- 12.4.4 Volume Forecast, 2025-2035
- 12.4.5 Base-Year Market Share, 2025
- 12.4.6 Segment CAGR and Growth Drivers
- 12.4.7 Subsegment Market Size and Forecast
- 12.4.7.1 Entry Natural
- 12.4.7.2 Masstige Natural
- 12.4.7.3 Premium Natural
- 12.4.7.4 Prestige Botanical
- 12.4.8 Subsegment Pricing and Adoption Trends
- 12.4.9 Leading Suppliers and Competition
- 12.4.10 Regional Demand and Opportunities
- 12.5 Segment Growth Comparison
- 12.6 Segment Attractiveness and Priority Matrix
Chapter 13 Indonesia Natural Personal Care Geographic Market Outlook, 2025-2035
- 13.1 Regional Market Size and Country-Level Shares, 2025
- 13.2 Country Market Size Comparison, 2025
- 13.3 Country Market Forecasts, 2025-2035
- 13.4 Subregional Industrial and Demand Clusters
- 13.5 Intra-Regional Pricing and Cost Differences
- 13.6 Cross-Border Trade and Supply Networks
- 13.7 Regional Supply and Demand Balances
- 13.8 Country Opportunity Comparison and Prioritization
Note: Every listed country is covered on the structure shown under the first country.
Chapter 14 Indonesia Natural Personal Care Technology, Innovation and Sustainability Outlook
- 14.1 Technology Landscape and Maturity
- 14.2 Product, Process and Service Innovation
- 14.3 AI, Automation and Digital Tools in the Industry
- 14.4 Technology Adoption and Performance Benchmarking
- 14.5 Innovation Pipeline and R&D Investment
- 14.6 Patent and Intellectual Property Trends
- 14.7 Energy Efficiency and Resource Management
- 14.8 Sustainability, Recycling and Circularity
- 14.9 Technology Roadmap, 2025-2035
- 14.10 Risks of Obsolescence and Technology Substitution
Chapter 15 Indonesia Natural Personal Care Market Key Strategic Imperatives
- 15.1 Growth and Market Entry Priorities
- 15.2 High-Return Products and Segments
- 15.3 Pricing, Profitability and Cost Optimization
- 15.4 Technology Investment and Product Differentiation
- 15.5 Supply Chain Localization and Resilience
- 15.6 Distribution and Customer Acquisition
- 15.7 Partnership, Acquisition and Capacity Strategy
- 15.8 Regional Expansion Priorities
- 15.9 Short-, Medium- and Long-Term Actions
Chapter 16 Competition Outlook
- 16.1 Industry Competition Characteristics
- 16.2 Market Structure and Concentration
- 16.3 Market Share and Competitive Positioning, 2025
- 16.4 Company-Wise Revenue and Product Benchmarking
- 16.5 Production and Service Capacity Benchmarking
- 16.6 Technology, Pricing and Differentiation
- 16.7 Regional Footprint and Distribution Strength
- 16.8 Mergers, Acquisitions and Strategic Alliances
- 16.9 New Entrants and Competitive Threats
- 16.10 Porter's Five Forces and Industry Attractiveness
- 16.11 Competitive Outlook, 2025-2035
Chapter 17 Company Profiles
- 17.1 Company Coverage and Selection Criteria
- 17.2 PT Paragon Technology and Innovation (Wardah)
- 17.2.1 Business Description
- 17.2.2 Company Ownership and Geographic Presence
- 17.2.3 Product and Service Portfolio
- 17.2.4 Manufacturing and Operating Footprint
- 17.2.5 Production Capacity and Expansion Plans
- 17.2.6 Financial Performance and Investment
- 17.2.7 Market Share and Competitive Position
- 17.2.8 Technology and Innovation Capabilities
- 17.2.9 Strategic Alliances or Partnerships
- 17.2.10 Recent Developments
- 17.2.11 Growth Strategy and Outlook
- 17.3 PT Mustika Ratu Tbk
- 17.4 PT Martina Berto Tbk
- 17.5 PT Victoria Care Indonesia Tbk
- 17.6 Sensatia Botanicals
- 17.7 AVO Innovation & Technology (Avoskin)
- 17.8 PT Gondowangi Tradisional Kosmetika (Natur)
- 17.9 Utama Spice
- 17.10 NPURE
- 17.11 The Bath Box
- 17.12 Other Relevant Market Participants
Note: Every listed company is profiled on the structure shown under the first company. The company list is preliminary and may change based on research findings, market developments, data availability and client requirements.
Chapter 18 Disclaimer
- 18.1 Research and Forecast Disclaimer
- 18.2 Data Source and Estimation Limitations
Note: The depth of individual sections depends on data availability for this market. Volume, capacity, trade and other unit-based metrics are included where applicable.

