Market Overview:
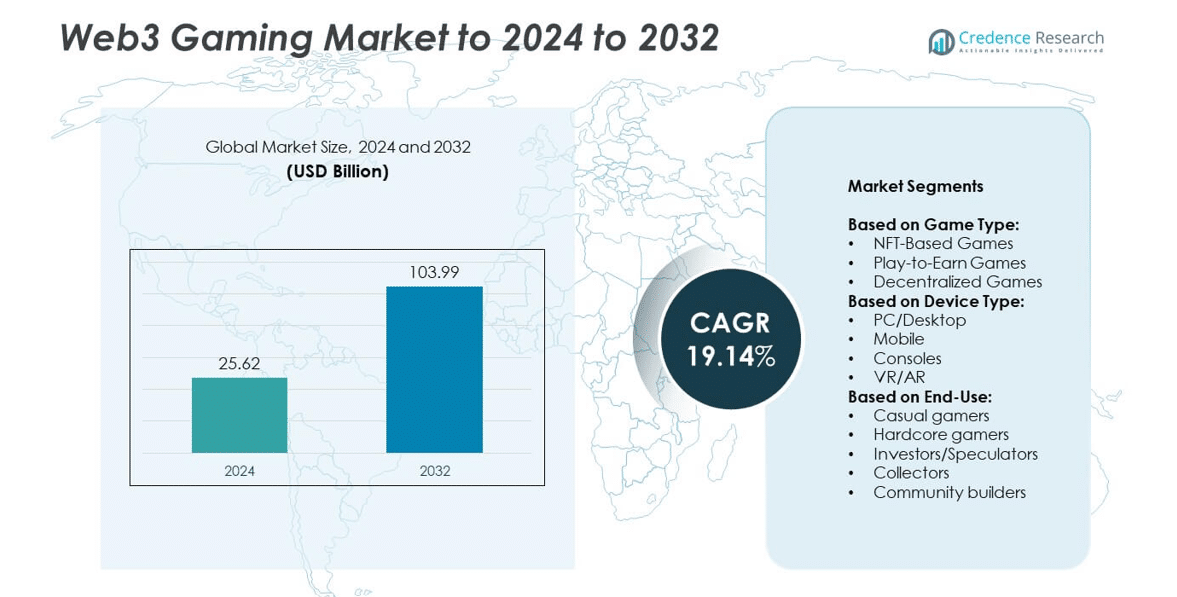
Web3 Gaming Market size was valued at USD 25.62 Billion in 2024 and is anticipated to reach USD 103.99 Billion by 2032, at a CAGR of 19.14% during the forecast period.
| REPORT ATTRIBUTE | DETAILS |
|---|---|
| Historical Period | 2020-2023 |
| Base Year | 2024 |
| Forecast Period | 2025-2032 |
| Web3 Gaming Market Size 2024 | USD 25.62 Billion |
| Web3 Gaming Market, CAGR | 19.14% |
| Web3 Gaming Market Size 2032 | USD 103.99 Billion |
The Web3 gaming market is driven by key players such as Gala Games, Animoca Brands, Yuga Labs, Enjin, Sky Mavis, Ubisoft, The Sandbox, Immutable, Forte, Axie Infinity, and Decentraland, who are focusing on NFT integration, play-to-earn models, and cross-platform interoperability to enhance user engagement. These companies are investing in metaverse development and scalable blockchain infrastructure to expand their ecosystems and attract both casual and competitive gamers. North America led the market in 2024, holding approximately 38% share, supported by strong blockchain adoption, high developer activity, and significant venture capital investments that continue to accelerate regional growth.
Market Insights
- The Web3 gaming market was valued at USD 25.62 Billion in 2024 and is projected to reach USD 103.99 Billion by 2032, growing at a CAGR of 19.14%.
- Growth is driven by rising adoption of NFTs, play-to-earn models, and increasing blockchain investments attracting both gamers and developers.
- Key trends include metaverse integration, cross-platform asset interoperability, and mobile-first Web3 gaming platforms targeting emerging markets.
- Competition is intensifying as leading players focus on scalable infrastructure, tokenomics innovation, and community-driven governance to retain and expand user bases.
- North America leads with 38% market share, followed by Europe at 27% and Asia Pacific at 25%, while NFT-based games dominate by game type, holding over 40% share in 2024.
Market Segmentation Analysis:
By Game Type
NFT-based games led the Web3 gaming market in 2024, holding over 40% share. Growth is driven by rising adoption of blockchain-based ownership, allowing players to trade and monetize in-game assets. The popularity of titles offering unique, tradable NFTs encourages both gamers and collectors to participate. Play-to-earn (P2E) games are expanding quickly, supported by reward-driven ecosystems and tokenized incentives. Decentralized games are also gaining traction as developers embrace community governance models. The ability to provide transparency and provable scarcity has made NFT-based games the cornerstone of the Web3 gaming landscape.
- For instance, Axie Infinity experienced peak daily active users of over 2.7 million in November 2021, during a period of high popularity for play-to-earn games, though the user base has since declined significantly.
By Device Type
Mobile devices dominated the market with nearly 50% share in 2024 due to their accessibility and global penetration. The rise of mobile-first blockchain platforms and lightweight Web3 wallets has made participation easier for casual users. PC/Desktop remains significant, favored by gamers who seek high-performance gameplay and advanced graphics. Consoles are slowly integrating blockchain features but lag due to proprietary ecosystems. VR/AR is emerging as a niche segment, driven by immersive metaverse-based experiences. Mobile’s convenience and ability to support microtransactions keep it the dominant choice for Web3 gaming adoption.
- For instance, The Sandbox recorded an average of 12.1 daily active LAND buyers and 148.6 daily active non-LAND buyers in Q1 2025.
By End-Use
Casual gamers accounted for the largest share, exceeding 35% in 2024, as easy-to-play NFT and P2E games attract mainstream users. Low entry barriers and gamified earning opportunities appeal to a wider audience, fueling market expansion. Hardcore gamers are adopting blockchain games with deeper gameplay and competitive features, while investors and speculators contribute liquidity to token ecosystems. Collectors focus on rare NFTs, driving demand for exclusive in-game assets. Community builders are key to sustaining engagement through decentralized governance. Casual gamers’ mass participation ensures consistent user growth and monetization across Web3 gaming ecosystems.
Market Overview
Rising Adoption of NFTs in Gaming
The integration of NFTs into gaming is a key growth driver, allowing players to own, trade, and monetize unique digital assets. This ownership model boosts user engagement and creates additional revenue streams for developers. Popular games leveraging NFT marketplaces are attracting mainstream attention, encouraging more studios to experiment with tokenized economies. The scarcity and transferability of NFT-based items foster long-term player loyalty and sustain in-game economies, significantly fueling market expansion.
- For instance, according to DappRadar's 2024 Industry Report, the blockchain gaming industry consistently ranked as one of the most dominant dapp categories by activity, with its share fluctuating between 26% and 29% throughout the year. While user engagement varied, the number of unique active wallets (UAW) saw significant growth, reaching 7.4 million daily UAW by the end of 2024, demonstrating the sector's expanding presence in the Web3 space.
Growth of Play-to-Earn Ecosystems
Play-to-earn (P2E) models are transforming gaming from entertainment into an income-generating activity, making this a major driver. Players earn tokens or NFTs by completing tasks, creating a direct incentive to participate. Emerging economies are adopting P2E games as an alternative income source, contributing to rapid user growth. Game publishers are integrating staking and DeFi features, further increasing engagement. The combination of gaming and financial rewards has positioned P2E ecosystems as a critical force driving Web3 gaming adoption.
- For instance, Sorare raised $50 million (approximately 41.7 million euros at the time) in its Series A funding round in February 2021.
Increased Investment and Partnerships
Rising investment from venture capital firms and strategic partnerships between blockchain platforms and gaming studios represent another key driver. Funding accelerates game development and infrastructure scalability, enabling studios to launch innovative titles. Partnerships with crypto exchanges and wallet providers simplify onboarding for new users. This influx of capital and collaboration is strengthening the Web3 gaming ecosystem, improving user experience, and fostering market maturity.
Key Trends & Opportunities
Metaverse Integration and Interoperability
One of the major trends is the growing convergence of Web3 gaming with metaverse platforms, creating expansive virtual ecosystems. Developers are focusing on interoperability, enabling assets to be used across multiple games and platforms. This approach enhances the utility of NFTs and keeps users engaged within connected ecosystems. Opportunities exist for cross-brand collaborations, where players can carry avatars and assets between games, offering a seamless digital identity experience that attracts long-term users.
- For instance, Immutable X and Axelar integrated in 2024, connecting Web3 games from over 50 blockchains.
Shift Toward Mobile-First Web3 Platforms
Mobile-first development is becoming a key opportunity as it aligns with the global trend toward mobile gaming. Lightweight blockchain integration and user-friendly wallets make it easier for players to participate from anywhere. This shift is particularly impactful in Asia-Pacific, where mobile penetration is high. Developers focusing on smooth onboarding and low gas fees are capturing a large share of first-time blockchain gamers, opening new revenue streams and expanding the addressable market.
- For instance, Sweat Economy boasts a significantly larger user base than 100,000 daily users. Before its Token Generation Event in September 2022, the platform reported over 13 million opted-in crypto users via the Sweat Wallet and a total registered user base exceeding 110 million for the Sweatcoin app, making it one of the largest Web3 projects by user count.
Key Challenges
Regulatory Uncertainty in Blockchain Gaming
Regulatory ambiguity remains a key challenge, with governments still defining rules around crypto, NFTs, and tokenized rewards. Compliance issues can restrict game launches in key markets and slow investment flows. Developers face challenges balancing decentralization with regulatory requirements, especially regarding token distribution and user data privacy. Clearer frameworks will be needed to unlock full growth potential and ensure global scalability of Web3 gaming platforms.
Scalability and User Experience Barriers
High transaction fees and network congestion pose significant challenges, impacting the scalability of Web3 games. Complex onboarding processes and the need for blockchain wallets create friction for casual users. Slow transaction speeds can disrupt gameplay and reduce engagement. Solving these issues through layer-2 solutions and better user interfaces is essential to attract mainstream gamers and compete with traditional gaming platforms.
Regional Analysis
North America
North America held the largest share of the Web3 gaming market in 2024, accounting for around 38%. The region benefits from strong blockchain infrastructure, high adoption of NFTs, and early investment by gaming studios. The U.S. leads with significant venture capital funding and a mature developer ecosystem. Growing collaboration between gaming companies and crypto platforms is driving player engagement. Regulatory clarity on digital assets is also boosting confidence among investors and gamers. The presence of major technology firms and a large base of crypto users positions North America as a critical hub for Web3 gaming expansion.
Europe
Europe captured nearly 27% of the Web3 gaming market share in 2024, supported by rising adoption of decentralized gaming and NFT marketplaces. Countries like Germany, the U.K., and France are leading in blockchain innovation and metaverse projects. The European Union’s focus on digital asset regulation is creating a secure environment for developers and investors. Growing interest in sustainable blockchain gaming solutions and cross-border collaborations between gaming startups and crypto firms are enhancing market growth. A tech-savvy population and increasing investment in Web3 infrastructure strengthen Europe’s position as a rapidly growing regional market for blockchain-based gaming.
Asia Pacific
Asia Pacific accounted for about 25% of the market in 2024 and is the fastest-growing region. High smartphone penetration and a massive gamer base in countries like China, South Korea, and India are fueling adoption. Local developers are launching play-to-earn and NFT-based games tailored to regional preferences. Strong government support for blockchain innovation in countries like Singapore is encouraging investment. Affordable internet access and the popularity of esports further contribute to growth. The combination of mobile-first gaming culture and rising crypto adoption makes Asia Pacific a key driver of future Web3 gaming expansion.
Latin America
Latin America represented nearly 6% of the Web3 gaming market share in 2024, with rapid adoption driven by play-to-earn models. Countries like Brazil, Mexico, and Argentina are witnessing growing participation as players seek additional income opportunities. Economic instability in some regions has made blockchain-based earning attractive to younger populations. Increasing smartphone usage and partnerships between gaming platforms and local payment providers are improving accessibility. The region is becoming a hotspot for Web3 gaming experimentation and community-driven projects, although infrastructure limitations and regulatory gaps remain key challenges for broader market penetration and sustained growth.
Middle East & Africa
Middle East & Africa held close to 4% of the Web3 gaming market share in 2024, showing steady growth potential. The UAE and Saudi Arabia are leading with strong investments in blockchain ecosystems and gaming innovation hubs. Government-backed digital economy initiatives are fostering adoption of NFT-based gaming platforms. The region benefits from a young, tech-savvy population eager to explore play-to-earn opportunities. Limited access to advanced infrastructure in parts of Africa remains a barrier, but rising internet penetration and mobile adoption are expected to expand participation. Strategic partnerships and esports events are driving regional interest in Web3 gaming.
Market Segmentations:
By Game Type:
- NFT-Based Games
- Play-to-Earn Games
- Decentralized Games
By Device Type:
- PC/Desktop
- Mobile
- Consoles
- VR/AR
By End-Use:
- Casual gamers
- Hardcore gamers
- Investors/Speculators
- Collectors
- Community builders
By Geography:
- North America
- U.S.
- Canada
- Mexico
- Europe
- UK
- France
- Germany
- Italy
- Spain
- Russia
- Belgium
- Netherlands
- Austria
- Sweden
- Poland
- Denmark
- Switzerland
- Rest of Europe
- Asia Pacific
- China
- Japan
- South Korea
- India
- Australia
- Thailand
- Indonesia
- Vietnam
- Malaysia
- Philippines
- Taiwan
- Rest of Asia Pacific
- Latin America
- Brazil
- Argentina
- Peru
- Chile
- Colombia
- Rest of Latin America
- Middle East
- UAE
- KSA
- Israel
- Turkey
- Iran
- Rest of Middle East
- Africa
- Egypt
- Nigeria
- Algeria
- Morocco
- Rest of Africa
Competitive Landscape
The Web3 gaming market is shaped by leading players such as Gala Games, Animoca Brands, Yuga Labs, Enjin, Sky Mavis, Ubisoft, The Sandbox, Immutable, Forte, Axie Infinity, and Decentraland. These companies focus on building decentralized ecosystems, integrating NFTs, and offering play-to-earn models that attract both casual and competitive gamers. Strategic collaborations with blockchain platforms and crypto exchanges are helping expand user bases and improve accessibility. Developers are emphasizing community-driven governance, allowing players to influence game updates and in-game economies. Investment in metaverse integration, cross-platform interoperability, and scalable infrastructure is intensifying competition. Continuous innovation in tokenomics, immersive experiences, and user onboarding solutions is positioning these companies to capture significant growth opportunities in the coming years.
Key Player Analysis
- Gala Games
- Animoca Brands
- Yuga Labs
- Enjin
- Sky Mavis
- Ubisoft
- The Sandbox
- Immutable
- Forte
- Axie Infinity
- Decentraland
Recent Developments
- In 2025, Animoca launched One Fight Arena, a match-3 fighter game on iOS and Android featuring ONE Championship's roster.
- In 2025, Ubisoft revealed Might & Magic Fates, a free-to-play blockchain trading card game built on Immutable zkEVM, designed to be skill-based rather than pay-to-win.
- In 2024, Yuga Labs released Dookey Dash: Unclogged, a follow-up to the previously popular game.
Report Coverage
The research report offers an in-depth analysis based on Game Type, Device Type, End-Use and Geography. It details leading market players, providing an overview of their business, product offerings, investments, revenue streams, and key applications. Additionally, the report includes insights into the competitive environment, SWOT analysis, current market trends, as well as the primary drivers and constraints. Furthermore, it discusses various factors that have driven market expansion in recent years. The report also explores market dynamics, regulatory scenarios, and technological advancements that are shaping the industry. It assesses the impact of external factors and global economic changes on market growth. Lastly, it provides strategic recommendations for new entrants and established companies to navigate the complexities of the market.
Future Outlook
- Web3 gaming adoption will rise as blockchain infrastructure becomes faster and more scalable.
- NFT interoperability across multiple games will enhance asset utility and player engagement.
- Play-to-earn models will evolve toward sustainable tokenomics to maintain long-term user interest.
- Metaverse integration will create shared virtual worlds with cross-platform digital identities.
- Mobile-first blockchain games will dominate growth, targeting emerging markets with high smartphone penetration.
- Strategic partnerships between gaming studios and crypto exchanges will simplify onboarding for new users.
- AI-driven game design will personalize user experiences and optimize in-game economies.
- Regulatory clarity will boost institutional investment and accelerate mainstream adoption.
- Layer-2 solutions will reduce transaction costs and improve gaming performance for mass users.
- Community-driven governance will grow, giving players more influence over game development and updates.

Request a Free Sample
Fill in your details and we'll send you a free sample report.
- Sample data tables & charts
- Research methodology
Market Dynamics
Rising Adoption of NFTs in Gaming
NFT integration enables true digital ownership, allowing players to trade and monetize unique in-game assets, which increases user engagement and creates new revenue streams for developers.
Growth of Play-to-Earn Ecosystems
Play-to-earn models transform gaming into an income-generating activity, attracting users from emerging economies and incentivizing participation through token rewards and NFT earnings.
Increased Investment and Strategic Partnerships
Venture capital funding and collaborations between blockchain platforms and gaming studios accelerate game development, infrastructure scalability, and user onboarding, strengthening the overall ecosystem.
Metaverse Integration and Asset Interoperability
The convergence of Web3 gaming with metaverse platforms and the ability to use assets across multiple games enhance user retention and create expansive, interconnected virtual worlds.
Shift Toward Mobile-First Web3 Platforms
Mobile devices' accessibility and global penetration, especially in emerging markets, drive mass adoption of Web3 games, supported by lightweight blockchain integration and user-friendly wallets.
Need a Custom Version of This Report?
Tailor the scope, geography, or segments to your exact requirements.
- Custom geography or segment scope
- Direct access to our analyst team
Frequently Asked Questions
What is the current market size for Web3 Gaming Market, and what is its projected size in 2032?
At what Compound Annual Growth Rate is the Web3 Gaming Market projected to grow between 2025 and 2032?
Which Web3 Gaming Market segment held the largest share in 2024?
What are the primary factors fueling the growth of the Web3 Gaming Market?
Who are the leading companies in the Web3 Gaming Market?
Table of Content
Chapter 1 Market Segmentation
- 1.1 Segmentation Framework
- 1.1.1 Product and Service Classification
- 1.1.2 Application and End-Use Classification
- 1.1.3 Technology and Solution Classification
- 1.1.4 Customer and Distribution Channel Classification
- 1.1.5 Geographic Segmentation
- 1.1.6 Market Segment Definitions and Boundaries
- 1.2 By End-Use
- 1.2.1 Casual gamers
- 1.2.2 Hardcore gamers
- 1.2.3 Investors/Speculators
- 1.2.4 Collectors
- 1.2.5 Community builders
- 1.3 By Game Type
- 1.3.1 NFT-Based Games
- 1.3.2 Play-to-Earn Games
- 1.3.3 Decentralized Games
- 1.4 By Device Type
- 1.4.1 PC/Desktop
- 1.4.2 Mobile
- 1.4.3 Consoles
- 1.4.4 VR/AR
Chapter 2 Introduction
- 2.1 Report Objectives and Scope
- 2.2 Product Definition and Industry Terminology
- 2.3 Market Inclusions and Exclusions
- 2.4 Research Process
- 2.4.1 Primary Research and Expert Interviews
- 2.4.2 Secondary Research and Source Review
- 2.4.3 Top-Down and Bottom-Up Estimation
- 2.4.4 Data Triangulation and Verification
- 2.5 Market Size Measurement Basis
- 2.5.1 2024: USD 25.62 Billion → 2032: USD 103.99 Billion
- 2.6 Historical and Forecast Reference Periods
- 2.6.1 Base Year: 2024
- 2.6.2 Forecast Period: 2024-2032
- 2.7 Research Assumptions and Limitations
Chapter 3 Executive Summary
- 3.1 Market Snapshot and Key Findings
- 3.2 Base-Year Market Size, 2024
- 3.3 Forecast Market Size, 2032
- 3.4 Revenue and Volume Growth Outlook
- 3.5 Key Demand and Supply Indicators
- 3.6 Leading Market Segments
- 3.7 Fastest-Growing Market Opportunities
- 3.8 Regional Performance Highlights
- 3.9 Technology and Industry Transformation
- 3.10 Competitive Landscape Summary
- 3.11 Analyst View and Strategic Implications
Chapter 4 Global Web3 Gaming Market Trends and Developments
- 4.1 Historical Industry Development
- 4.2 Recent Market Trends and Developments
- 4.3 Demand and Customer Behavior Trends
- 4.4 Technology and Product Innovation
- 4.5 Artificial Intelligence, Automation and Digitalization
- 4.6 Local Manufacturing and Supply Chain Realignment
- 4.7 Industry Partnerships, Mergers and Acquisitions
- 4.8 Sustainability and Circular Economy Developments
- 4.9 Government and Private Sector Investment Trends
- 4.10 Emerging Business Models and Commercialization
- 4.11 Industry Developments and Announcements
Chapter 5 Global Web3 Gaming Market Production, Supply and Demand Analysis
- 5.1 Demand Trend and Consumption Analysis
- 5.2 Demand Forecast, 2024-2032
- 5.3 Production and Output Trend
- 5.4 Production and Output Forecast, 2024-2032
- 5.5 Installed Capacity and Capacity Utilization
- 5.6 Company-Wise Production Plants and Statistics
- 5.6.1 Installed Production Capacity
- 5.6.2 Actual Production
- 5.6.3 Planned Capacity and Expansion Targets
- 5.7 Supply Chain Structure and Procurement Trends
- 5.8 Supply-Demand Gap and Bottlenecks
- 5.9 Import Dependence and Sourcing Structure
- 5.10 Contract Manufacturing and Outsourcing
- 5.11 Regional Supply and Demand Concentration
Chapter 6 Global Web3 Gaming Market Pricing Analysis
- 6.1 Pricing Structure and Measurement
- 6.2 Historical Pricing Trends
- 6.3 Pricing Outlook, 2024-2032
- 6.4 Average Selling Price and Unit Economics
- 6.5 Pricing by Product and Market Segment
- 6.6 Geographic Pricing Differences
- 6.7 Key Input, Energy, Labor and Logistics Costs
- 6.8 Contract Pricing and Purchasing Models
- 6.9 Pricing Sensitivity and Competitive Positioning
- 6.10 Price, Margin and Profitability Implications
Chapter 7 Global Web3 Gaming Market Dynamics
- 7.1 Market Growth Drivers
- 7.1.1 Demand-Side Drivers
- 7.1.2 Technology and Innovation Drivers
- 7.1.3 Infrastructure and Investment Drivers
- 7.1.4 Regulatory and Policy Drivers
- 7.2 Market Restraints
- 7.2.1 Cost and Affordability Constraints
- 7.2.2 Technology and Adoption Barriers
- 7.2.3 Supply Chain and Operational Constraints
- 7.3 Market Challenges
- 7.3.1 Competitive Pressure and Margin Erosion
- 7.3.2 Skills, Infrastructure and Implementation Gaps
- 7.4 Emerging Market Opportunities
- 7.5 Market Dynamics Impact and Time-Horizon Assessment
Chapter 8 Global Web3 Gaming Value Chain Analysis
- 8.1 Industry Value Chain Overview
- 8.2 Upstream Suppliers and Critical Inputs
- 8.3 Technology and Component Providers
- 8.4 Manufacturing or Service Delivery
- 8.5 Distribution, Channel Partners and Integrators
- 8.6 Downstream Applications and End Users
- 8.7 Value Addition and Profit Pools
- 8.8 Vertical Integration and Outsourcing
- 8.9 Supplier Concentration and Risk
- 8.10 Supply Chain Localization and Resilience
Chapter 9 Global Web3 Gaming Market Regulations and Policies
- 9.1 Relevant Laws, Standards and Compliance Frameworks
- 9.2 Product, Service, Safety and Quality Requirements
- 9.3 Government Policies, Incentives and Subsidies
- 9.4 Imports, Exports and Trade Barriers
- 9.5 Public Procurement and Local Content Requirements
- 9.6 Environmental and Sustainability Compliance
- 9.7 Upcoming Policy Changes and Market Implications
Chapter 10 Global Web3 Gaming Market Hotspots and Opportunities
- 10.1 Market Opportunity Mapping and Growth Hotspots
- 10.2 High-Growth Applications and Customer Groups
- 10.3 Underserved Markets and White-Space Opportunities
- 10.4 Emerging Technology and Product Opportunities
- 10.5 New Capacity and Investment Hotspots
- 10.6 Market Entry and Expansion Opportunities
- 10.7 Distribution and Partnership Opportunities
- 10.8 Near-Term and Long-Term Commercial Potential
- 10.9 Opportunity Attractiveness and Execution Risks
Chapter 11 Global Web3 Gaming Market Outlook, 2024-2032
- 11.1 Market Size and Analysis
- 11.1.1 Revenue (Market Measurement: 2024: USD 25.62 Billion → 2032: USD 103.99 Billion)
- 11.1.2 Market Volume and Quantity Sold
- 11.1.3 Historical Market Size
- 11.1.4 Base-Year Market Size, 2024
- 11.2 Market Forecast, 2024-2032
- 11.2.1 Revenue Forecast to 2032
- 11.2.2 Volume Forecast to 2032
- 11.2.3 CAGR and Year-on-Year Growth
- 11.2.4 Incremental Revenue Opportunity
- 11.3 Forecast Assumptions and Scenario Analysis
- 11.3.1 Base-Case Forecast
- 11.3.2 Optimistic and Conservative Scenarios
- 11.3.3 Technology, Pricing and Policy Sensitivities
- 11.4 Market Attractiveness and Growth Outlook
Chapter 12 Global Web3 Gaming Market Segmentation and Outlook
- 12.1 Segmentation Summary and Market Shares, 2024
- 12.2 Largest and Fastest-Growing Segments
- 12.3 By End-Use - Market Size and Forecast, 2024-2032
- 12.3.1 Segment Definition and Scope
- 12.3.2 Historical Market Size
- 12.3.3 Revenue Forecast, 2024-2032
- 12.3.4 Volume Forecast, 2024-2032
- 12.3.5 Base-Year Market Share, 2024
- 12.3.6 Segment CAGR and Growth Drivers
- 12.3.7 Subsegment Market Size and Forecast
- 12.3.7.1 Casual gamers
- 12.3.7.2 Hardcore gamers
- 12.3.7.3 Investors/Speculators
- 12.3.7.4 Collectors
- 12.3.7.5 Community builders
- 12.3.8 Subsegment Pricing and Adoption Trends
- 12.3.9 Leading Suppliers and Competition
- 12.3.10 Regional Demand and Opportunities
- 12.4 By Game Type - Market Size and Forecast, 2024-2032
- 12.4.1 Segment Definition and Scope
- 12.4.2 Historical Market Size
- 12.4.3 Revenue Forecast, 2024-2032
- 12.4.4 Volume Forecast, 2024-2032
- 12.4.5 Base-Year Market Share, 2024
- 12.4.6 Segment CAGR and Growth Drivers
- 12.4.7 Subsegment Market Size and Forecast
- 12.4.7.1 NFT-Based Games
- 12.4.7.2 Play-to-Earn Games
- 12.4.7.3 Decentralized Games
- 12.4.8 Subsegment Pricing and Adoption Trends
- 12.4.9 Leading Suppliers and Competition
- 12.4.10 Regional Demand and Opportunities
- 12.5 By Device Type - Market Size and Forecast, 2024-2032
- 12.5.1 Segment Definition and Scope
- 12.5.2 Historical Market Size
- 12.5.3 Revenue Forecast, 2024-2032
- 12.5.4 Volume Forecast, 2024-2032
- 12.5.5 Base-Year Market Share, 2024
- 12.5.6 Segment CAGR and Growth Drivers
- 12.5.7 Subsegment Market Size and Forecast
- 12.5.7.1 PC/Desktop
- 12.5.7.2 Mobile
- 12.5.7.3 Consoles
- 12.5.7.4 VR/AR
- 12.5.8 Subsegment Pricing and Adoption Trends
- 12.5.9 Leading Suppliers and Competition
- 12.5.10 Regional Demand and Opportunities
- 12.6 Segment Growth Comparison
- 12.7 Segment Attractiveness and Priority Matrix
Chapter 13 Global Web3 Gaming End-Use and Application Market Outlook
- 13.1 End-Use Industry and Customer Demand Structure
- 13.2 Leading Applications and Customer Groups
- 13.3 End-Use Market Size, Share and Forecast
- 13.4 Major End-Use Industry Deep Dives
- 13.4.1 Customer Requirements and Use Cases
- 13.4.2 Demand and Replacement Cycles
- 13.4.3 Technical and Regulatory Considerations
- 13.4.4 Purchasing and Procurement Models
- 13.4.5 Leading Vendors and Distribution Channels
- 13.4.6 Forecast and Commercial Opportunities
- 13.5 Emerging Applications and Cross-Segment Demand
- 13.6 End-Use Industry Investment Priorities
Chapter 14 Global Web3 Gaming Geographic Market Outlook, 2024-2032
- 14.1 Regional Market Size and Share, 2024
- 14.2 Regional Market Forecast, 2024-2032
- 14.3 Regional Pricing, Production and Demand Differences
- 14.4 North America
- 14.4.1 United States
- 14.4.2 Canada
- 14.4.3 Mexico
- 14.5 Europe
- 14.5.1 Germany
- 14.5.2 France
- 14.5.3 Italy
- 14.5.4 United Kingdom
- 14.5.5 Spain
- 14.5.6 Poland
- 14.5.7 Russia
- 14.5.8 Netherlands
- 14.5.9 Belgium
- 14.5.10 Sweden
- 14.5.11 Denmark
- 14.5.12 Norway
- 14.5.13 Rest of Europe
- 14.6 Asia Pacific
- 14.6.1 China
- 14.6.2 India
- 14.6.3 Japan
- 14.6.4 South Korea
- 14.6.5 Thailand
- 14.6.6 Indonesia
- 14.6.7 Vietnam
- 14.6.8 Malaysia
- 14.6.9 Australia
- 14.6.10 Rest of Asia Pacific
- 14.7 Latin America
- 14.7.1 Brazil
- 14.7.2 Argentina
- 14.7.3 Colombia
- 14.7.4 Chile
- 14.7.5 Rest of Latin America
- 14.8 Middle East
- 14.8.1 Saudi Arabia
- 14.8.2 United Arab Emirates
- 14.8.3 Turkey
- 14.8.4 Israel
- 14.8.5 Iran
- 14.8.6 Rest of the Middle East
- 14.9 Africa
- 14.9.1 South Africa
- 14.9.2 Egypt
- 14.9.3 Nigeria
- 14.9.4 Morocco
- 14.9.5 Rest of Africa
- 14.10 Regional Investment, Policy and Supply Chain Differences
- 14.11 Regional Competitive Landscape
- 14.12 Geographic Growth Hotspots
Chapter 15 Global Web3 Gaming Technology, Innovation and Sustainability Outlook
- 15.1 Technology Landscape and Maturity
- 15.2 Product, Process and Service Innovation
- 15.3 AI, Automation and Digital Tools in the Industry
- 15.4 Technology Adoption and Performance Benchmarking
- 15.5 Innovation Pipeline and R&D Investment
- 15.6 Patent and Intellectual Property Trends
- 15.7 Energy Efficiency and Resource Management
- 15.8 Sustainability, Recycling and Circularity
- 15.9 Technology Roadmap, 2024-2032
- 15.10 Risks of Obsolescence and Technology Substitution
Chapter 16 Global Web3 Gaming Market Key Strategic Imperatives
- 16.1 Growth and Market Entry Priorities
- 16.2 High-Return Products and Segments
- 16.3 Pricing, Profitability and Cost Optimization
- 16.4 Technology Investment and Product Differentiation
- 16.5 Supply Chain Localization and Resilience
- 16.6 Distribution and Customer Acquisition
- 16.7 Partnership, Acquisition and Capacity Strategy
- 16.8 Regional Expansion Priorities
- 16.9 Short-, Medium- and Long-Term Actions
Chapter 17 Competition Outlook
- 17.1 Industry Competition Characteristics
- 17.2 Market Structure and Concentration
- 17.3 Market Share and Competitive Positioning, 2024
- 17.4 Company-Wise Revenue and Product Benchmarking
- 17.5 Production and Service Capacity Benchmarking
- 17.6 Technology, Pricing and Differentiation
- 17.7 Regional Footprint and Distribution Strength
- 17.8 Mergers, Acquisitions and Strategic Alliances
- 17.9 New Entrants and Competitive Threats
- 17.10 Porter's Five Forces and Industry Attractiveness
- 17.11 Competitive Outlook, 2024-2032
Chapter 18 Company Profiles
- 18.1 Company Coverage and Selection Criteria
- 18.2 Gala Games
- 18.2.1 Business Description
- 18.2.2 Company Ownership and Geographic Presence
- 18.2.3 Product and Service Portfolio
- 18.2.4 Manufacturing and Operating Footprint
- 18.2.5 Production Capacity and Expansion Plans
- 18.2.6 Financial Performance and Investment
- 18.2.7 Market Share and Competitive Position
- 18.2.8 Technology and Innovation Capabilities
- 18.2.9 Strategic Alliances or Partnerships
- 18.2.10 Recent Developments
- 18.2.11 Growth Strategy and Outlook
- 18.3 Animoca Brands
- 18.4 Yuga Labs
- 18.5 Enjin
- 18.6 Sky Mavis
- 18.7 Ubisoft
- 18.8 The Sandbox
- 18.9 Immutable
- 18.10 Forte
- 18.11 Decentraland
- 18.12 Other Relevant Market Participants
Note: Every listed company is profiled on the structure shown under the first company. The company list is preliminary and may change based on research findings, market developments, data availability and client requirements.
Chapter 19 Disclaimer
- 19.1 Research and Forecast Disclaimer
- 19.2 Data Source and Estimation Limitations
Note: The depth of individual sections depends on data availability for this market. Volume, capacity, trade and other unit-based metrics are included where applicable.