
How Much Power an AI Data Center Uses, From Chip to Campus
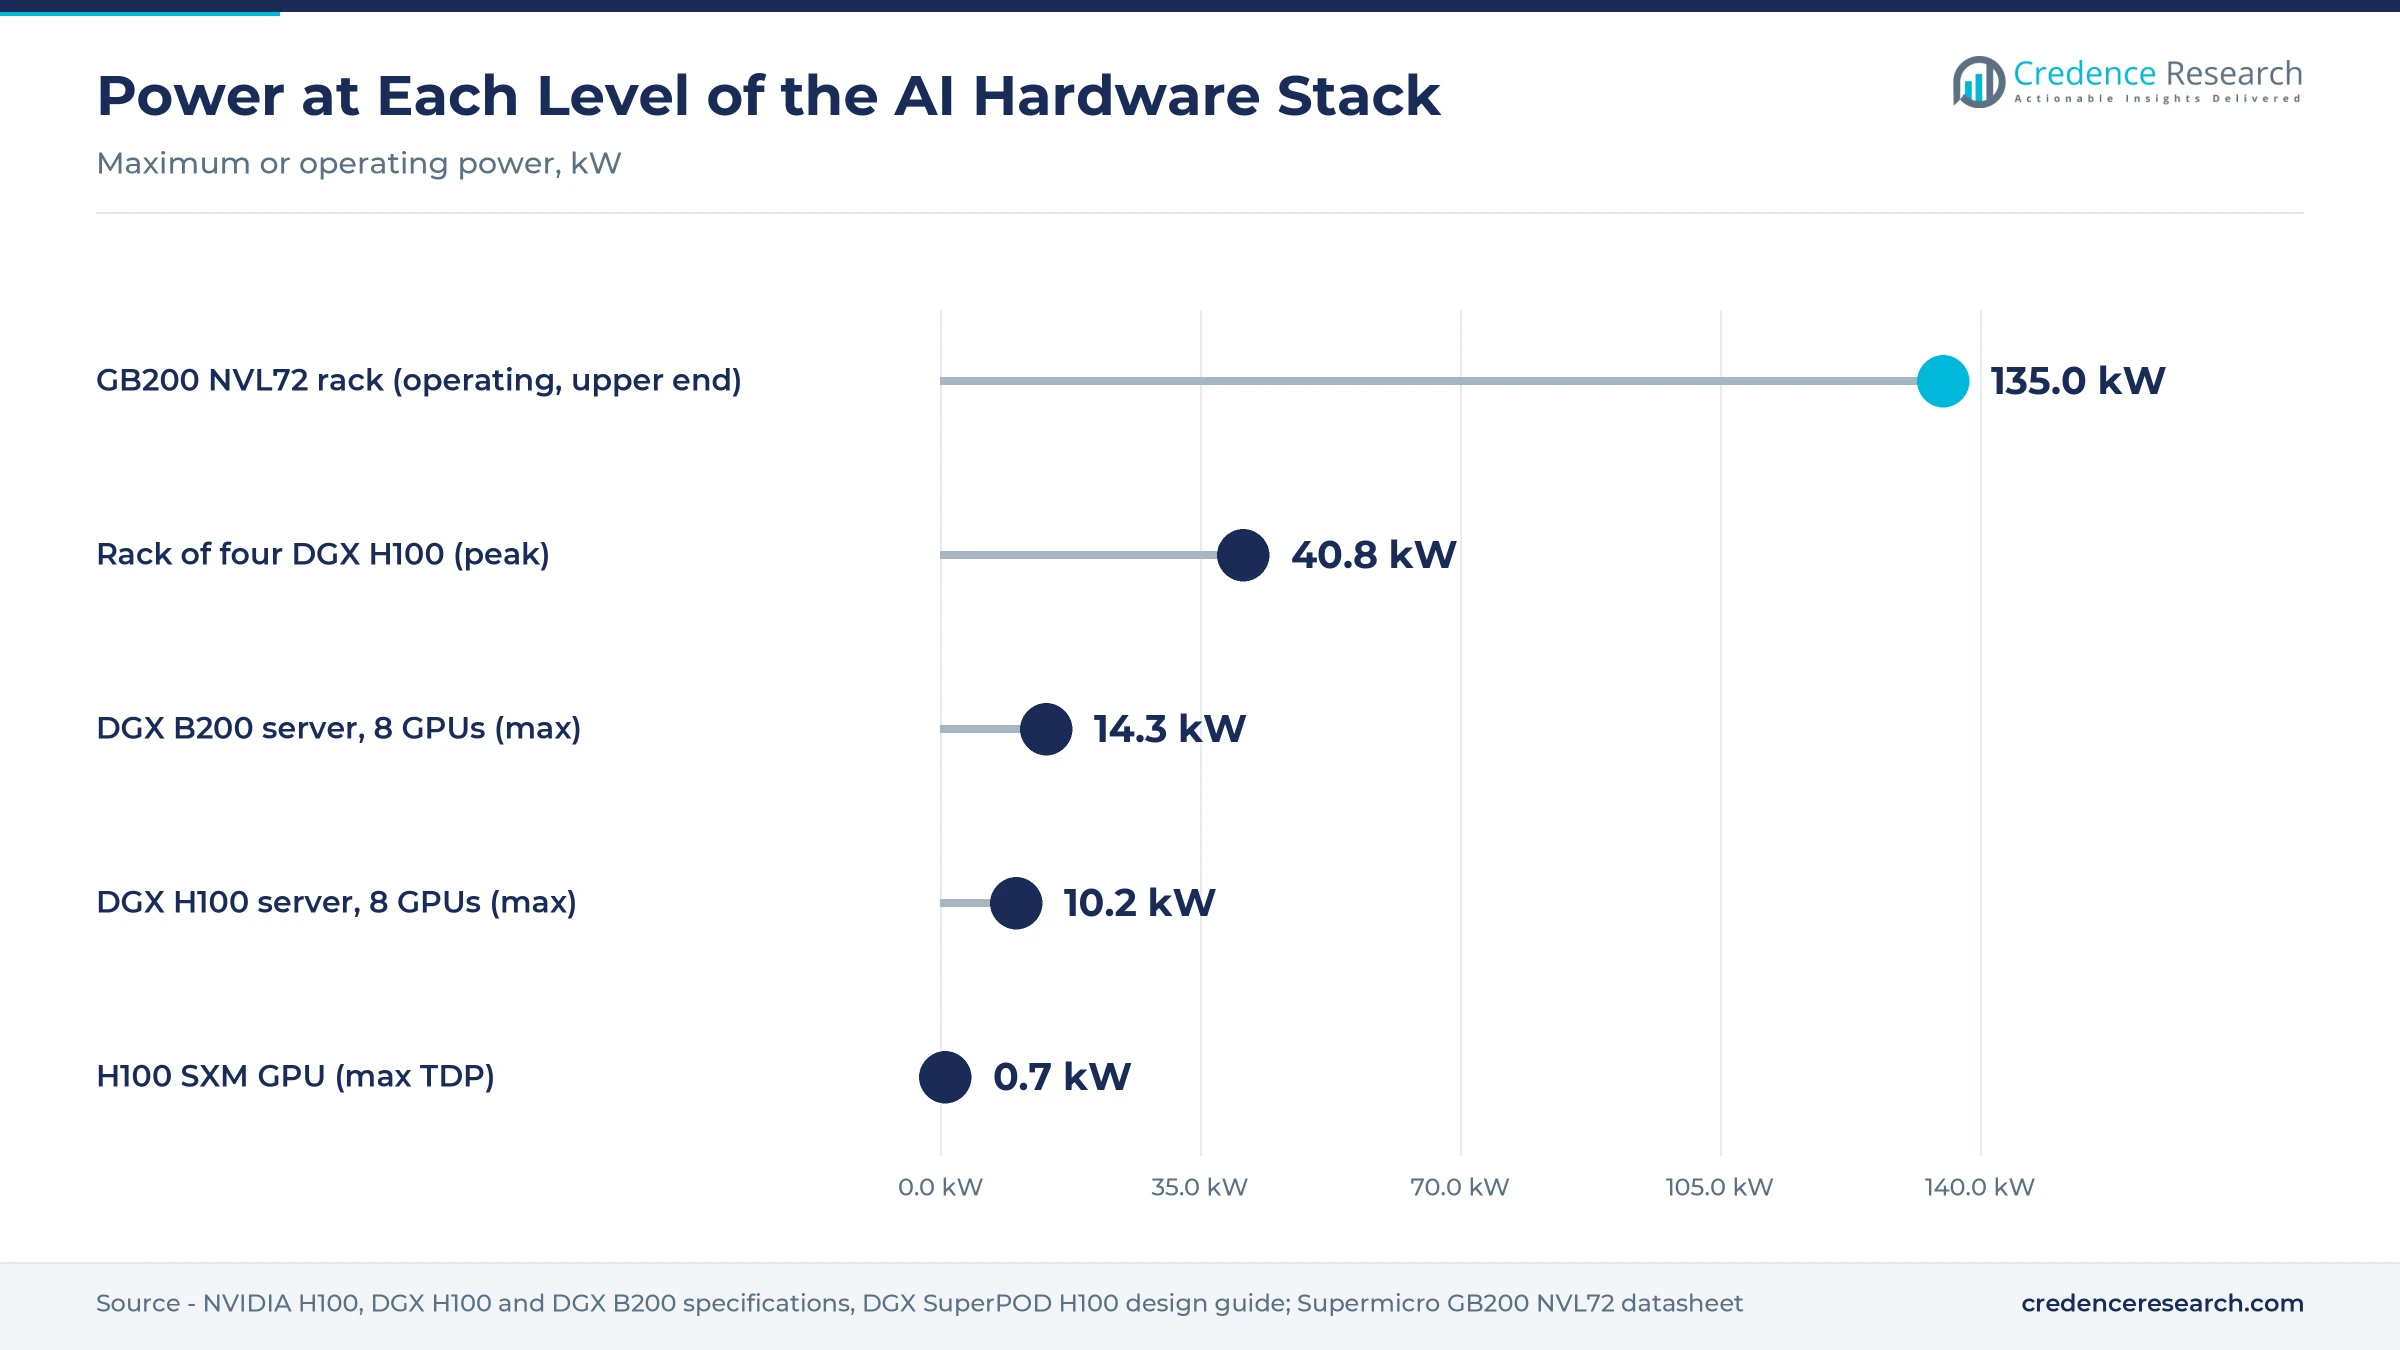
An AI data center uses from tens of megawatts to more than a gigawatt of electrical capacity, depending on how many accelerators it hosts. The load builds from the chip upward through servers, racks and campuses. A single NVIDIA H100 GPU is rated at up to 700 watts, an eight-GPU server at 10 kW to 14 kW and a liquid-cooled rack-scale system at about 125 kW to 135 kW. New large facilities typically plan for 100 MW to 1,000 MW, and the biggest campuses now announced are measured in gigawatts. Actual energy use is lower than nameplate capacity, because servers rarely run at full power around the clock, so annual consumption depends on utilization, workload mix and cooling overhead.
Power demand starts at the chip and multiplies upward
Every estimate of AI data center power begins with the accelerator. NVIDIA lists the maximum thermal design power of its H100 SXM GPU at up to 700 W, configurable downward, and the lower-power H100 NVL card at 350 W to 400 W. That rating describes the heat the chip is designed to dissipate at full load, and it sets the ceiling for everything downstream, from power supplies to coolant flow.
A server adds processors, memory, network cards, storage and fans to the GPUs, and those parts raise the total well above the sum of the chips. NVIDIA's DGX H100 system, which holds eight GPUs, carries a maximum system power of 10.2 kW. The newer DGX B200 user guide lists 14.3 kW maximum for eight B200 GPUs, fed by six 3.3 kW power supplies in a 5+1 redundant arrangement. Divided across eight accelerators, each GPU accounts for roughly 1.3 kW of server power in the H100 system and about 1.8 kW in the B200 system once supporting components are counted. That per-GPU overhead is why buyers in the data center GPU market budget power at the server level, not from chip ratings alone.
Racks multiply the load again, because operators place several servers in each cabinet. NVIDIA's DGX SuperPOD design guidance for H100 systems recommends four DGX H100 systems per rack, which puts peak rack demand near 40.8 kW, and it advises against higher densities for thermal reasons. Rack-scale systems remove that limit by moving to liquid cooling. Supermicro's datasheet for its GB200 NVL72 rack, which combines 72 Blackwell GPUs and 36 Grace CPUs, gives an operating power of 125 kW to 135 kW, more than three times the air-cooled H100 rack. The gap between these figures and a conventional enterprise rack is examined in the earlier post on what an AI data center is.
The next generation of rack designs pushes power demand higher still. In a May 20, 2025, technical post, NVIDIA said that conventional 54 V rack power distribution starts to reach physical limits as racks exceed 200 kW, and it set out plans for 1 MW IT racks on 800 V direct current from 2027. The company estimated that a single 1 MW rack fed at 54 V would need up to 200 kg of copper busbar. Those numbers explain why rack power design is now a structural and electrical engineering problem, not only an IT purchase, and why suppliers in the data center rack power distribution market are redesigning shelves, busbars and connectors for higher voltages.
Rated power is not the same as power drawn
Nameplate figures describe the maximum a system can pull, not what it uses on an average day. The U.S. Department of Energy's December 2024 data center energy report, prepared by Lawrence Berkeley National Laboratory (LBNL), found that measured eight-GPU H100 nodes averaged about 74% of rated thermal design power under workloads, and it derived about 78% for computationally saturated workloads. The lab modeled annualized workload demand at 70% of rated node power and assumed idle AI servers still draw 20% of rated power.
Those assumptions matter because time spent idle or lightly loaded pulls the annual average far below the nameplate. LBNL's June 2026 update reports that the average annual power of an eight-GPU server rises steeply through 2026 to more than 4 kW, while four-GPU and two-GPU configurations peak just over 2 kW and 1 kW. Set against a 10.2 kW to 14.3 kW maximum, that average shows how far fleet-wide energy use sits below the electrical capacity that operators must still provision for peak demand.
The practical consequence is that a facility is sized for peaks while it is billed for averages. Electrical rooms, transformers, uninterruptible power supply (UPS) systems and utility contracts must handle the maximum load a cluster can reach, while the energy bill and the carbon accounting reflect average draw over the year. Operators that size only for average load risk tripped breakers during training runs, while operators that size every rack to nameplate strand capacity they paid for.
Campus capacity ranges from 100 MW to several gigawatts
At the site level, AI data centers are now planned in units that utilities associate with power plants. The Electric Power Research Institute's May 2024 Powering Intelligence white paper describes a typical new data center at 100 MW to 1,000 MW, roughly the load of 80,000 to 800,000 homes, and notes that some proposed sites reach 1 GW or more.
Company announcements confirm that the upper end is no longer hypothetical. OpenAI said on July 22, 2025, that it had agreed with Oracle to develop 4.5 GW of additional Stargate capacity in the United States, taking the program above 5 GW with its Abilene, Texas, site and over 2 million chips. On Sept. 23, 2025, OpenAI put Stargate's planned capacity at nearly 7 GW after naming five new sites. Louisiana's economic development agency said on July 13, 2026, that Meta's Richland Parish campus, home to its Hyperion AI cluster, will reach 5 GW of IT capacity. Smaller AI sites still exist at the other end of the range, and NVIDIA cites a 40 MW Foxconn facility in Kaohsiung, Taiwan, being built for 800 V direct current power.
Those disclosures allow a rough cross-check of power per accelerator at campus scale. Dividing more than 5 GW by more than 2 million chips gives roughly 2.5 kW of site capacity per accelerator, about a third more than the 1.7 kW to 1.9 kW per GPU inside a GB200 NVL72 rack. The difference covers host processors, networking, storage, cooling, power conversion losses and the headroom held back for growth and redundancy. Working the other way, a 1 GW campus at the 1.145 power usage effectiveness that LBNL assumes for AI facilities would leave about 873 MW for IT equipment. That is enough, on illustrative arithmetic that ignores redundancy, for roughly 6,600 racks of 132 kW each, or about 476,000 GPUs.
Training and inference load the grid differently
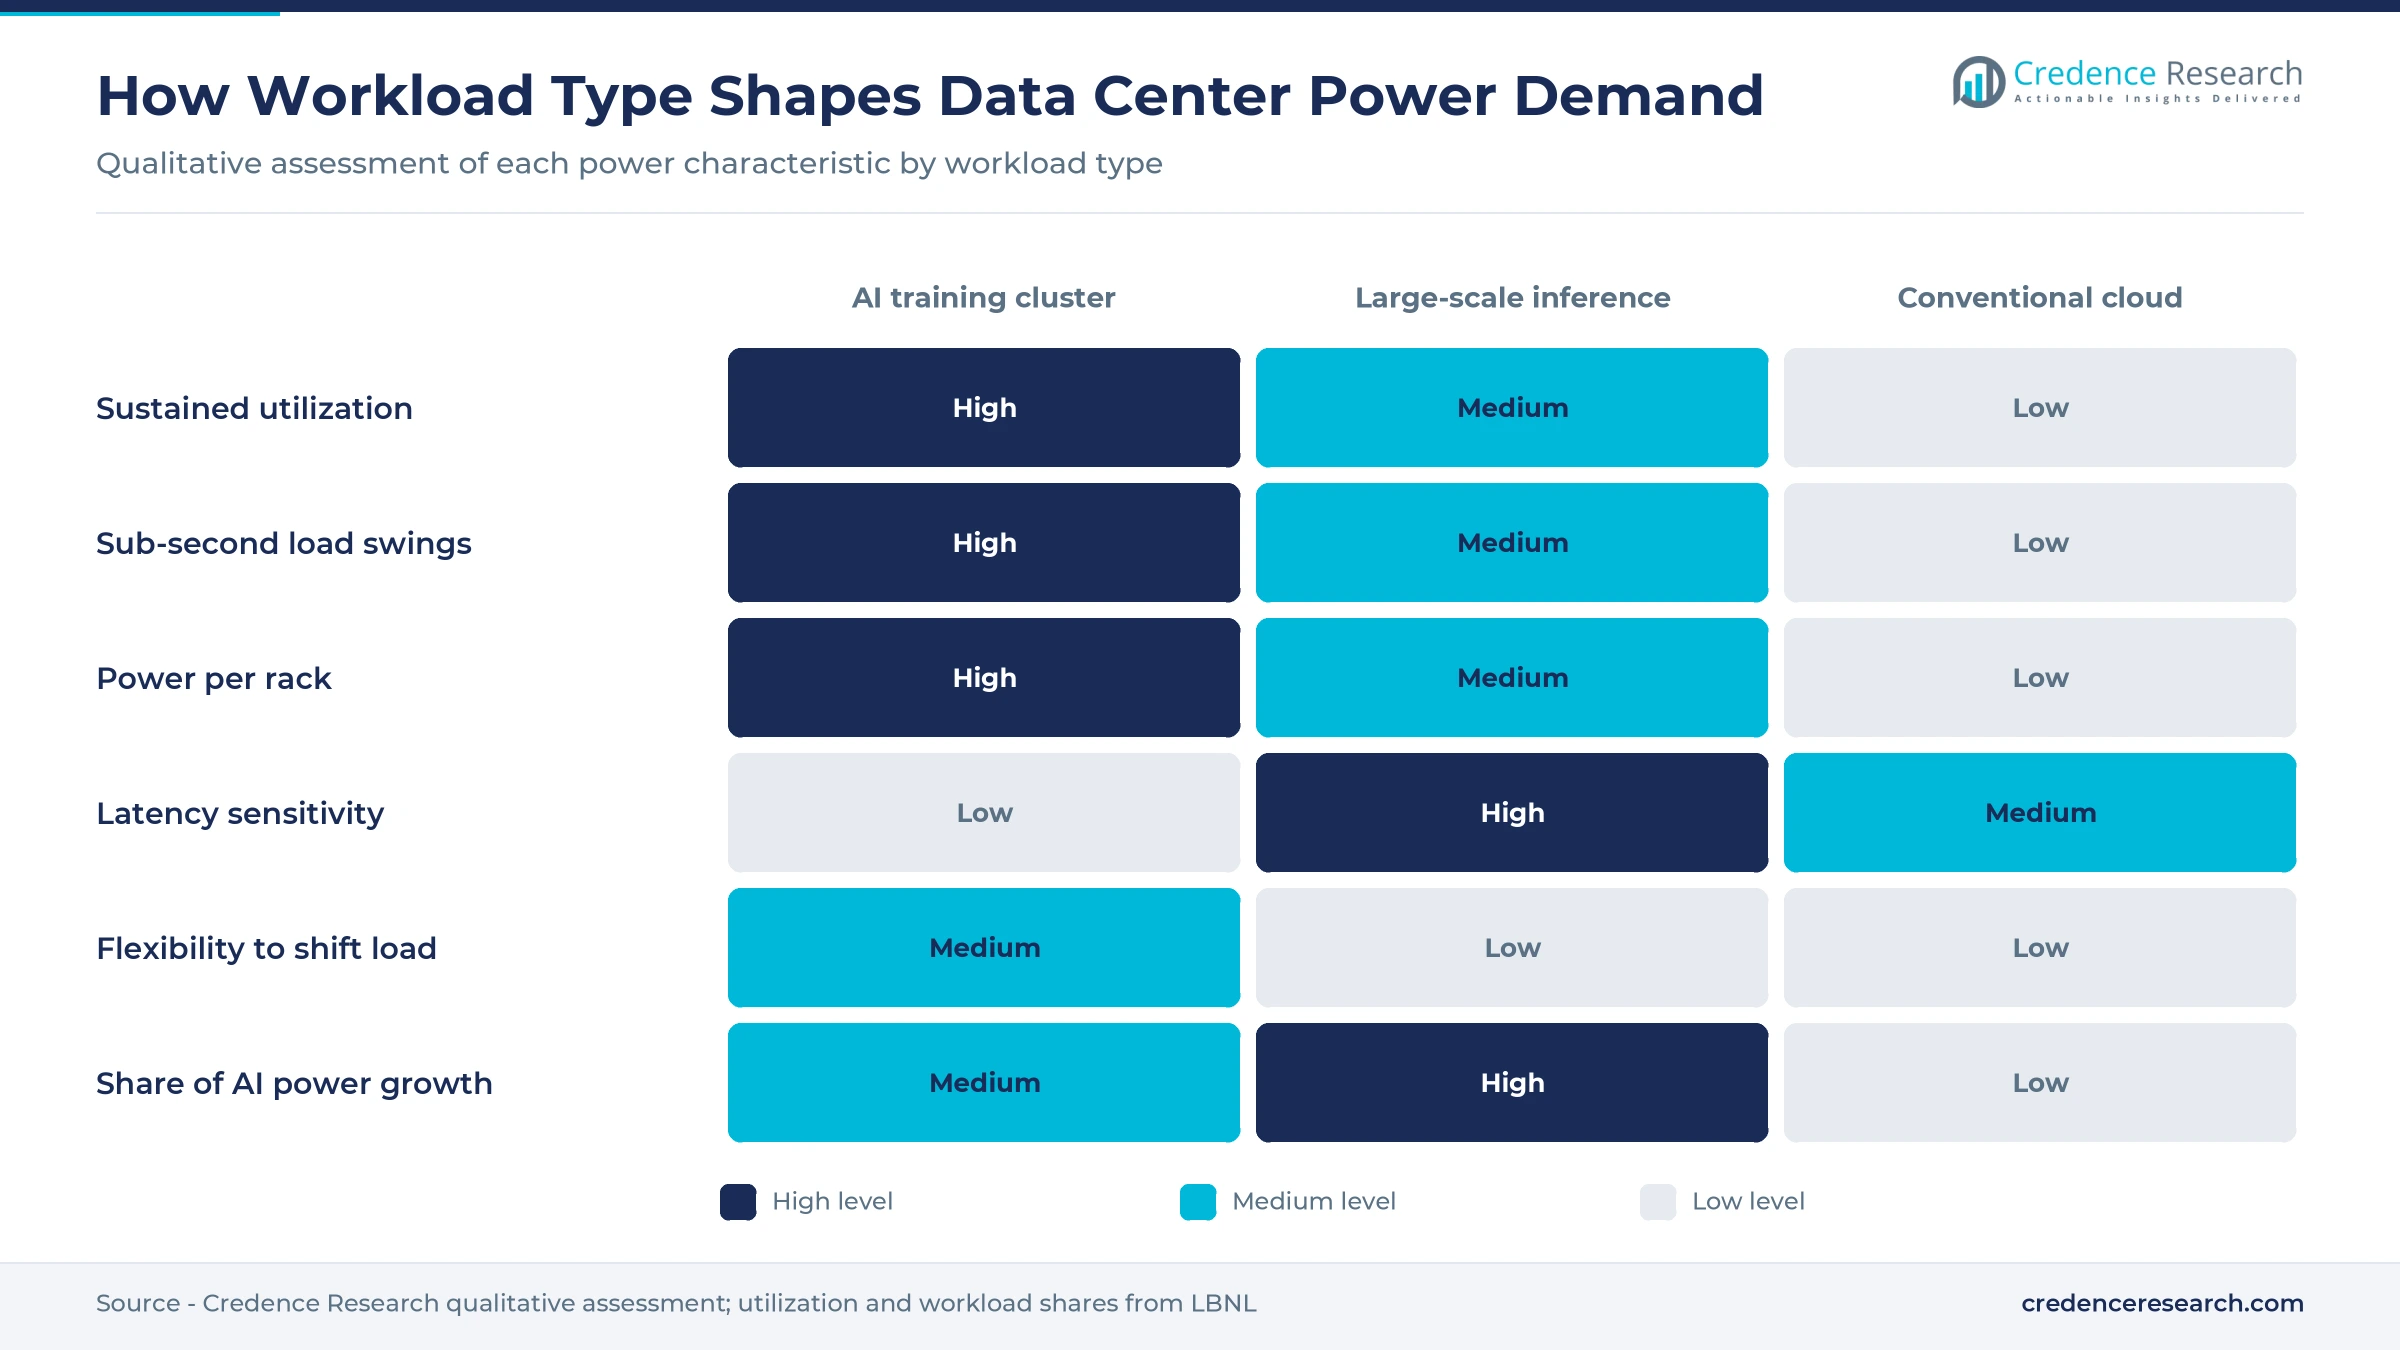
Training and inference use the same hardware but draw power in different patterns. Training runs a single large job across thousands of accelerators for weeks, so load stays high and steady. LBNL's 2025 update assumes AI training servers operate at 80% utilization. Inference serves requests as they arrive, so load follows user demand. LBNL assumes inference utilization follows enterprise server levels and reaches 20% by 2030, which means much of the inference fleet sits partly idle to keep response times short.
The balance between the two workloads is shifting steadily toward inference. LBNL estimates that about 35% of AI server power draw went to training in 2024 and projects that share falling to roughly 20% by 2030. EPRI's earlier white paper put inference at about 60% of AI's annual energy footprint, training at about 30% and model development at about 10%. Both readings point the same way despite different methods and dates. As AI features spread into search, office software and customer service, aggregate demand grows with query volume rather than with the size of any single training run.
Published figures from model developers show the scale of each activity. Meta's model card for Llama 3.1 reports 39.3 million GPU hours of training on H100-80GB hardware rated at 700 W, including 30.84 million hours for the 405-billion-parameter model. At that rating, the full training program equals about 27.5 GWh of GPU power, a total that excludes host servers, networking and cooling. A 1 GW campus running at full load consumes the same energy in a little over a day.
Estimates for a single inference request vary widely depending on what is counted. EPRI's 2024 paper cited about 2.9 Wh per ChatGPT request against about 0.3 Wh for a traditional search. Google reported on Aug. 21, 2025, that the median Gemini Apps text prompt used 0.24 Wh. That figure covers active accelerators, host CPUs and memory, idle provisioned machines and data center overhead. Counting active accelerators alone would give 0.10 Wh, which Google described as an underestimate. The company also reported a 33-fold reduction in energy per median prompt between May 2024 and May 2025, while noting the figures had not been verified by an independent party. The spread shows that per-query numbers are only comparable when their measurement boundaries match.
How annual consumption and grid demand are measured
Two units describe data center power, and confusing them causes many misleading comparisons. Megawatts and gigawatts measure capacity, the instantaneous load a site can draw and the figure utilities study when they approve an interconnection. Megawatt-hours and terawatt-hours measure energy, the electricity consumed over time. A 1 GW campus that averaged 80% of its capacity across a year would use about 7 TWh, since a year contains 8,760 hours.
National estimates are built from the bottom up, starting with equipment counts. LBNL multiplies the installed base of each equipment category by its average power, calculated from operating power, idle power and the share of time spent in each state, then multiplies the IT total by modeled PUE to reach site electricity. The International Energy Agency's 2025 Energy and AI analysis adds that servers account for about 60% of demand in modern data centers, cooling for about 7% in efficient hyperscale sites to more than 30% in less efficient enterprise sites, storage for about 5% and networking for up to 5%.
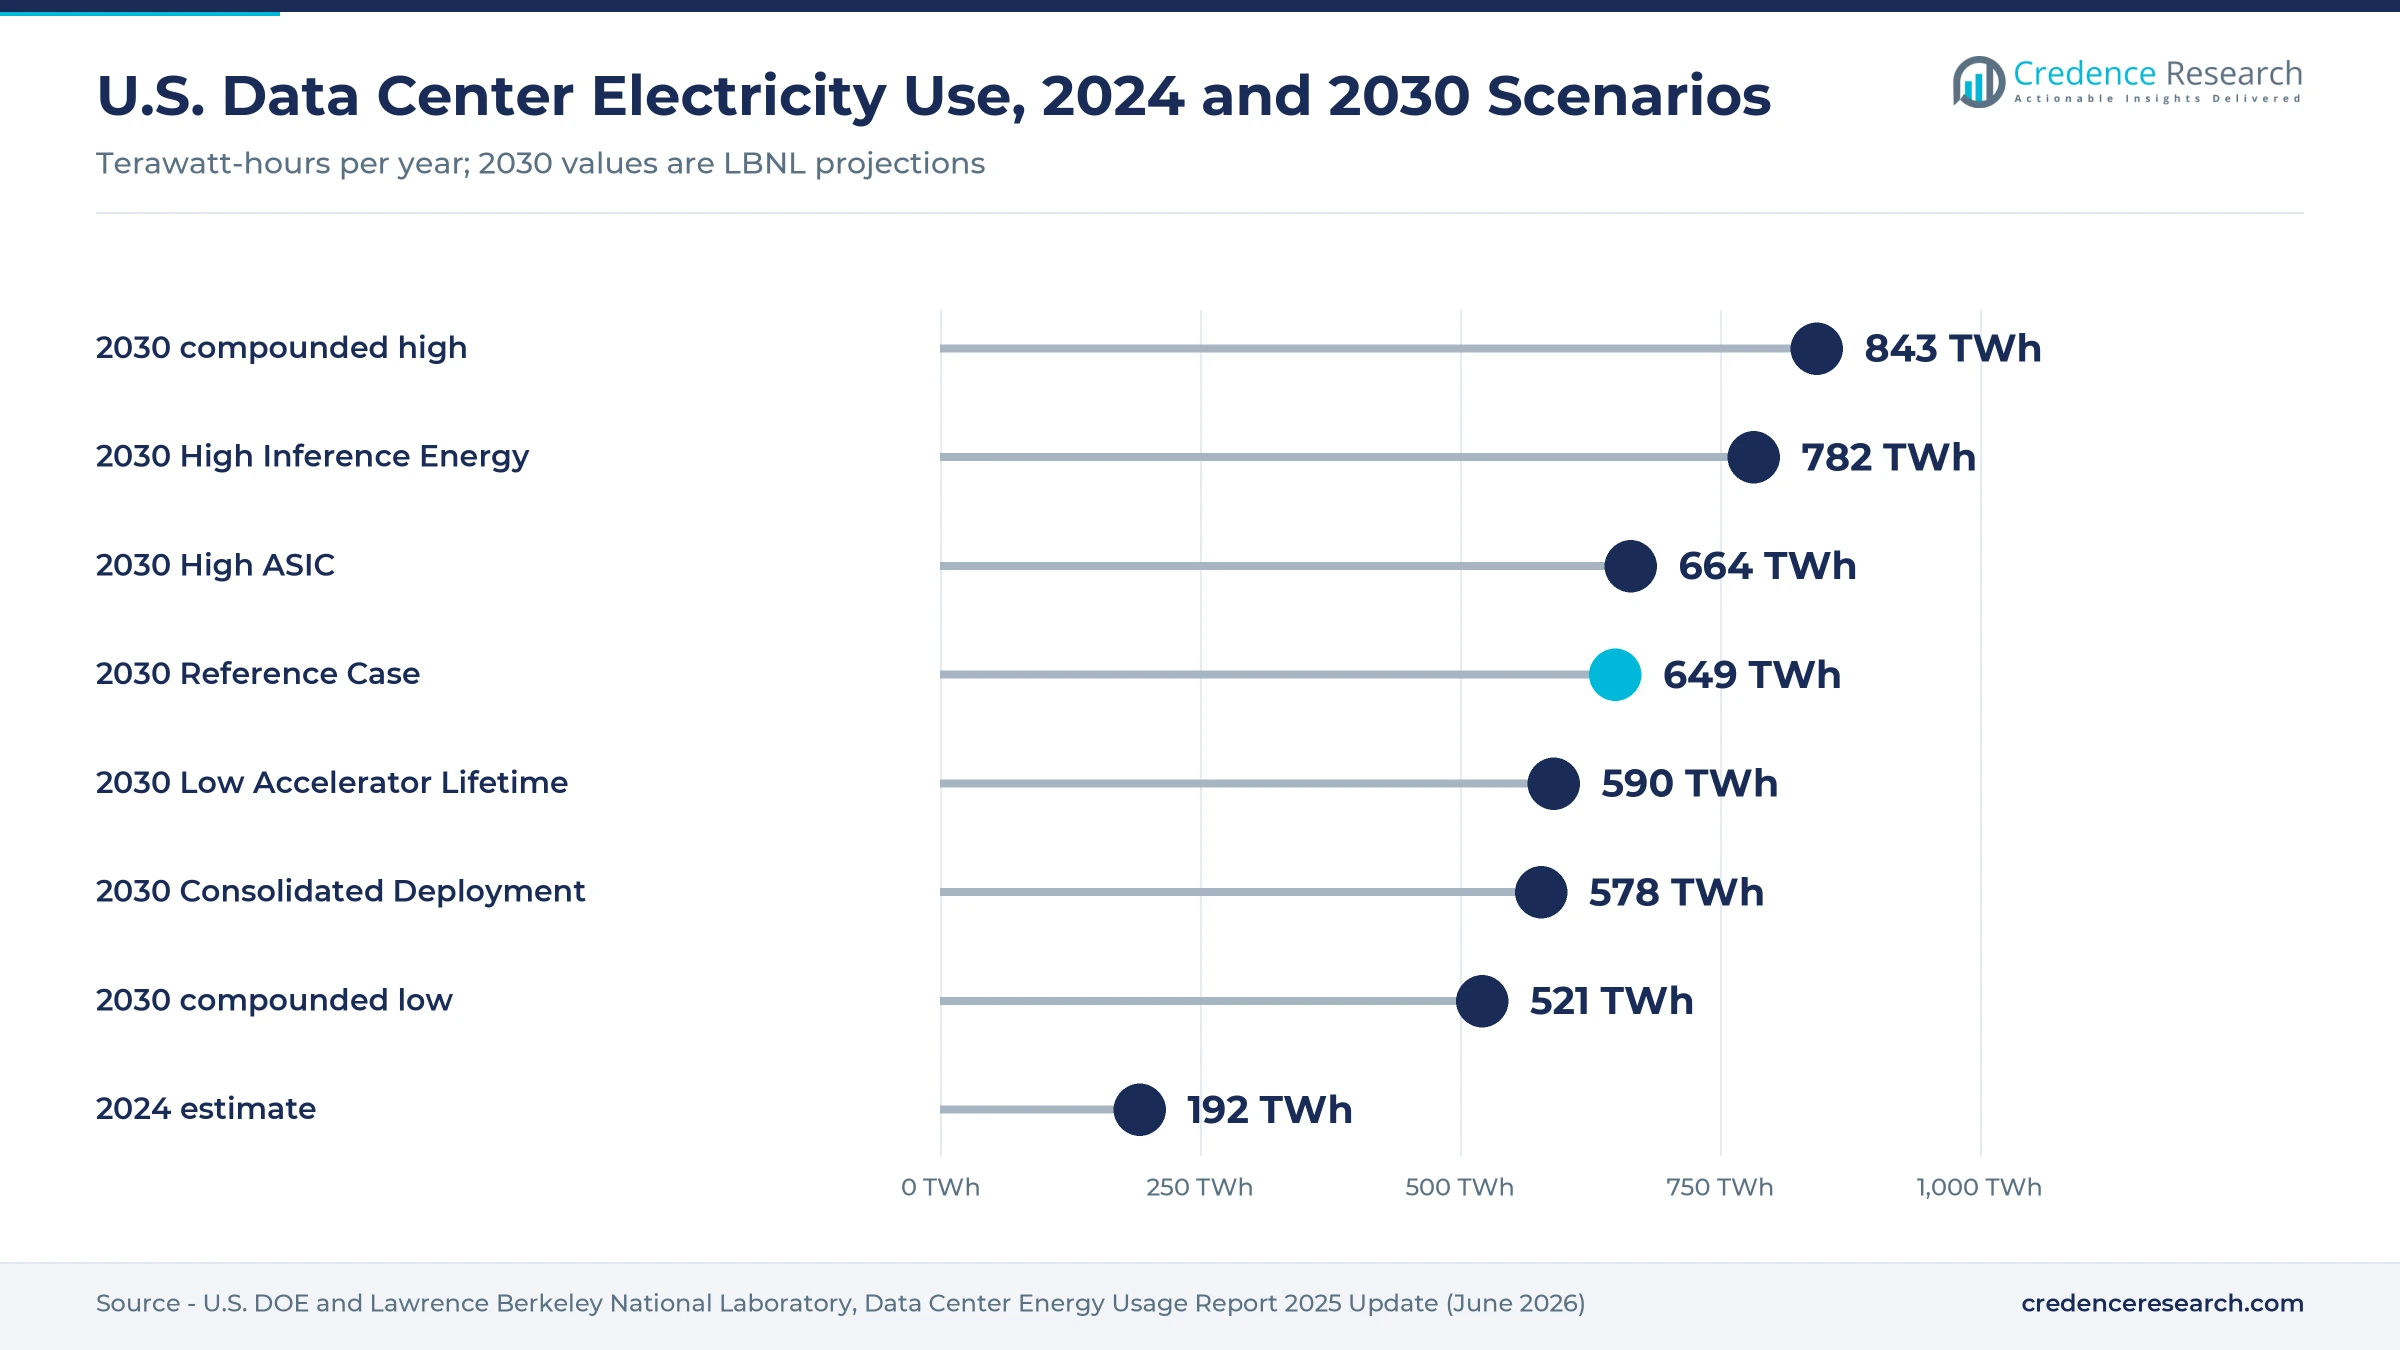
The 2025 update of the U.S. Data Center Energy Usage Report, dated June 2026, puts U.S. data center use at 192 TWh in 2024, or 4.7% of national electricity. Its Reference Case reaches 649 TWh by 2030, or 11.8% of forecast consumption, within a compounded range of 521 TWh to 843 TWh. In the Reference Case, AI servers account for 84% of server energy and 55% of total data center energy in 2030. Serving that load shifts spending toward switchgear, UPS and monitoring equipment in the U.S. data center power management market, because every added terawatt-hour must first be delivered as capacity.
The report also converts energy back into the capacity that utilities must plan for. Assuming 50% average utilization, it translates the 2030 Reference Case into 148 GW of interconnection capacity. The arithmetic behind that conversion is simple for any reader to reproduce. Spread across 8,760 hours, 649 TWh equals an average draw of about 74 GW, and halving the assumed utilization doubles the capacity required. That conversion explains why grid planners and developers quote gigawatts, while energy statisticians and climate reports quote terawatt-hours.
Load behavior makes AI power a reliability issue
The size of AI loads is only part of the challenge for grid operators. The North American Electric Reliability Corporation's incident review of a large load loss, published Jan. 8, 2025, describes how about 1,500 MW of data center load dropped off the Eastern Interconnection on July 10, 2024. A lightning arrester failure on a 230 kV line led to repeated automatic reclosing, with six faults in 82 seconds. Data center protection schemes responded by shifting load to backup power, and roughly 1,260 MW stayed off the grid for hours.
The review states that data center loads are sensitive to voltage disturbances. That sensitivity means a large campus can behave like a generator tripping in reverse, removing demand suddenly and forcing other plants to rebalance the system. Hardware makers are responding with energy storage inside the rack itself. NVIDIA's October 2025 description of its next-generation Vera Rubin rack design cites 20 times more energy storage to keep power steady. On the facility side, backup systems sized in the data center generator market and UPS fleets now have to be coordinated with utility ride-through requirements as well as with outage protection.
What drives AI data center power demand
LBNL's scenario set doubles as a list of the variables that move AI power demand most. Each sensitivity case changes one assumption and shows how far 2030 consumption shifts against the 649 TWh Reference Case.
- Inference intensity has the largest single effect, and the High Inference Energy scenario reaches 782 TWh by 2030 by raising inference utilization to 30% and idle draw to 30% of rated power.
- Chip mix matters, and the High ASIC scenario, which adds 15% more custom accelerators to the installed base, reaches 664 TWh.
- Hardware lifetime changes the size of the active fleet, and cutting average accelerator life by one year to four years brings consumption to 590 TWh.
- Deployment volume sets the base, and the Consolidated Deployment scenario, with 15% fewer GPUs and ASICs installed, reaches 578 TWh.
- Facility overhead sets the multiplier on all IT energy, and LBNL assumes PUE of 1.145 for AI facilities in 2024, easing to 1.136 by 2030.
Efficiency gains work in both directions for total power demand. Better chips and software cut energy per task, as Google's reported 33-fold drop per median prompt shows, but cheaper inference also encourages more use. Whether efficiency gains outpace volume growth is the central uncertainty behind the width of every published projection, and no source yet resolves it.
What the numbers mean for planners and buyers
For developers and colocation providers, the key planning figure is peak capacity per rack and per hall, not average energy. Halls designed today need electrical and cooling headroom for racks above 130 kW and a path toward the higher voltages that megawatt racks require. Overhead power distribution sized through the busway and bus duct market is one way designers keep that option open without rebuilding the hall.
For enterprises buying AI capacity, the useful question is how much energy each workload actually consumes, which depends on utilization and on whether a provider reports per-query energy with a full boundary. For utilities and regulators, the figures that matter are interconnection requests in gigawatts, the share of that capacity likely to run near full load and the ride-through behavior of large campuses during faults. Each group therefore needs a different number, and much of the confusion about AI power demand comes from quoting one in place of another.
Go deeper with our research
- Data Center GPU Market Size, Share, Growth and Forecast 2032
- Data Center Rack Power Distribution market Size, Share and Forecast 2032
- US Data Center Power Management Market Size, Share and Forecast
- Data Center Generator Market Size, Growth and Forecast 2032
- Busway-Bus Duct Market Size, Share, Growth and Forecast 2032