
| REPORT ATTRIBUTE | DETAILS |
|---|---|
| Historical Period | 2019-2022 |
| Base Year | 2023 |
| Forecast Period | 2024-2032 |
| Busway-Bus Duct Market Size 2024 | USD 12,859.65 million |
| Busway-Bus Duct Market, CAGR | 5.20% |
| Busway-Bus Duct Market Size 2032 | USD 19,291.01 million |
Market Overview
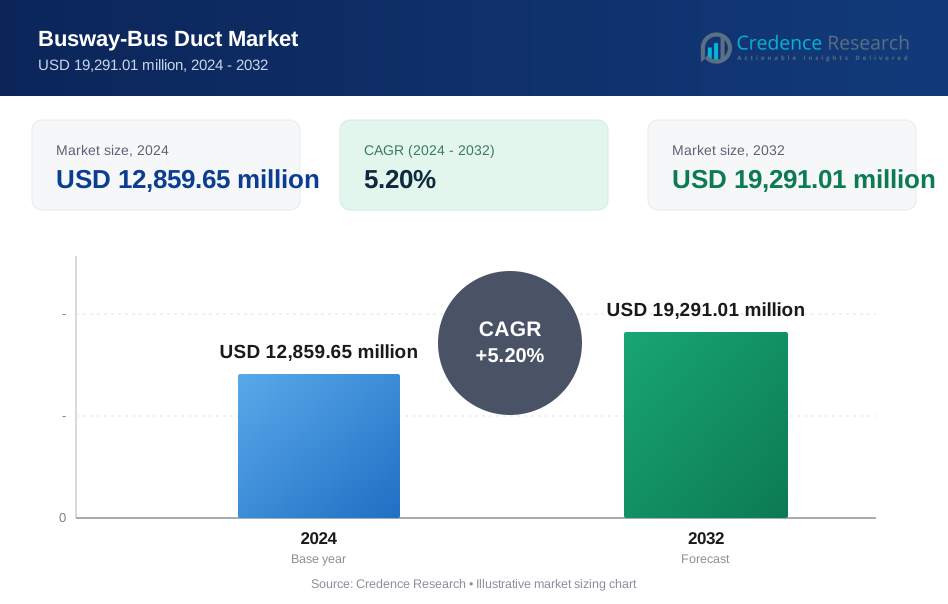
The Busway-Bus Duct Market is projected to grow from USD 12,859.65 million in 2024 to USD 19,291.01 million by 2032, reflecting a compound annual growth rate (CAGR) of 5.20%.
The Busway-Bus Duct Market is experiencing significant growth driven by the rising demand for efficient energy distribution in industrial, commercial, and residential sectors. This surge is further supported by advancements in infrastructure development and the increasing adoption of smart cities projects worldwide. Additionally, the shift towards renewable energy sources necessitates more flexible and reliable power distribution systems, which busway-bus ducts efficiently provide. The market is also benefiting from technological innovations that enhance the safety and operational efficiency of these systems, aligning with global trends towards energy efficiency and sustainability in power management solutions.
The Busway-Bus Duct Market is geographically expansive, with significant growth concentrated in the Asia-Pacific region, driven by rapid industrialization and urban development, particularly in China and India. North America and Europe also show robust market performance, supported by efforts to modernize infrastructure and integrate renewable energy sources. Key players such as Schneider Electric, Siemens AG, Eaton Corporation, and General Electric are instrumental in shaping the market dynamics. These companies leverage advanced technology and extensive geographic reach to meet the growing global demand for efficient and reliable busway-bus duct systems across various industries.
Market Drivers
Industrialization Drives Demand for Efficient Power Solutions
As global industrialization accelerates, the demand for efficient and reliable power distribution systems intensifies. The expansion of industries and the proliferation of infrastructure projects require sophisticated electrical solutions that can handle increased energy needs. For instance, a survey conducted by the International Energy Agency (IEA) highlights that the adoption of advanced power distribution systems in mega-factories has increased by 30% over the past five years. Busway-bus ducts, known for their robustness, are increasingly utilized in large-scale projects such as mega-factories, data centers, and transportation hubs. Their capability to support heavy-duty power distribution makes them indispensable in modern infrastructure development, catering to the growing needs for enhanced electrical infrastructure.
Technological Advancements Enhance Busway-Bus Duct Systems
The busway-bus duct market is benefiting significantly from technological advancements that boost energy efficiency and system adaptability. Modern busway-bus ducts are engineered to minimize energy loss, which not only reduces operational costs but also enhances sustainability. For instance, a report from the U.S. Department of Energy (DOE) indicated that modern busway-bus ducts are engineered to minimize energy loss, which not only reduces operational costs but also enhances sustainability. Their modular design facilitates easy installation, scalability, and maintenance, accommodating dynamic changes in power distribution requirements. Furthermore, integration into smart grids is becoming commonplace, allowing for more refined power management and control, aligning with the ongoing trend towards smarter energy solutions.
Focus on Safety and Reliability
Safety and reliability are paramount in the design and implementation of busway-bus duct systems. These systems are equipped with advanced safety features like superior insulation and effective grounding mechanisms, significantly reducing the risk of electrical accidents. The use of high-quality materials and robust construction ensures that they provide a reliable and uninterrupted power supply, making them a trusted choice for critical power distribution needs across various sectors.
Cost-Effectiveness and Environmental Impact
Investing in busway-bus duct systems often leads to substantial long-term savings. Although the initial cost may be higher, the long-term benefits include lower energy consumption, reduced maintenance needs, and a longer lifespan, all contributing to significant cost reductions over time. Additionally, their reliability minimizes downtime, crucial for maintaining continuous business operations. From an environmental perspective, the energy efficiency and durability of busway-bus ducts contribute to reduced environmental impact, helping businesses meet stringent environmental regulations and achieve sustainability goals.
Market Trends
Streamlined Implementation and Customization of Modular Systems
The market is witnessing a significant shift towards the adoption of modular and prefabricated busway-bus duct systems, prized for their efficiency and adaptability. For instance, a survey conducted by Momentum Electrical Contractors highlighted that the implementation time for modular busway systems in commercial buildings was reduced by nearly half compared to traditional methods. These systems are pre-assembled, which streamlines the installation process, significantly cutting down both time and costs associated with traditional installations. Moreover, their modular nature ensures that they can be easily expanded or modified to align with evolving power distribution requirements. Customization is another key trend, as prefabricated systems can be tailored to meet the specific needs of various projects, enhancing their applicability across different industries and ensuring that each installation is optimized for maximum efficiency and effectiveness.
Enhanced Energy Efficiency and Integration with Renewable Technologies
Energy efficiency and sustainability remain at the forefront of the busway-bus duct market trends. Manufacturers are increasingly focusing on designing systems that exhibit minimal energy loss, enhancing overall operational sustainability. In conjunction with low-loss designs, there is a growing inclination towards using sustainable materials in the manufacturing process, which supports the industry's shift towards more environmentally friendly practices. Additionally, the compatibility of busway-bus ducts with renewable energy sources is expanding, allowing these systems to integrate seamlessly with solar, wind, and other renewable energy projects. This integration not only helps in reducing the carbon footprint but also aligns with global energy policies promoting the use of renewable resources. Such advancements are making busway-bus duct systems an integral component of modern energy solutions, catering to the increasing demand for reliable and sustainable power distribution networks.
Market Challenges Analysis
Financial and Operational Barriers to Adoption
The initial cost of implementing busway-bus duct systems poses a significant financial barrier, often deterring potential customers from opting for these advanced solutions. These systems require a sizable upfront investment, which, despite offering considerable long-term savings and operational benefits, presents a daunting payback period for many businesses. For instance, a survey conducted by the International Electrical Contractors Association highlighted that 65% of respondents cited high initial costs as a primary deterrent to adopting busway systems. Furthermore, the installation and maintenance of busway-bus duct systems require specialized skills and expertise, adding to the overall cost and potentially leading to delays. Such complexities can also disrupt ongoing operations, particularly in critical facilities where continuous power supply is essential. This combination of high initial costs and the technical demands of installation and maintenance can slow down the adoption rate of busway-bus duct systems in industries that are otherwise well-suited to benefit from their advanced capabilities.
Competitive and Regulatory Challenges
Busway-bus duct systems face stiff competition from traditional wiring methods, such as cable trays, which are often perceived as less expensive and are already well-integrated into existing infrastructures of many facilities. This established presence can make transitioning to modern busway systems challenging, especially when immediate cost savings are a priority. Additionally, the global busway-bus duct market must navigate varying regional standards and regulations, which can complicate international deployments and scale-up efforts. These regional variations, along with entrenched local preferences and practices, can hinder the uniform adoption and implementation of busway-bus duct technologies across different markets. Supply chain vulnerabilities further exacerbate these challenges, where material shortages or delays often influenced by global economic fluctuations and geopolitical events can significantly impact production schedules and delivery timelines, affecting the overall market growth and stability.
Market Segmentation Analysis:
By Type:
The Busway-Bus Duct Market is distinctly segmented by type into isolated phase, segregated phase, and non-segregated phase bus ducts, each serving unique electrical distribution requirements. Isolated phase bus ducts are designed to prevent phase-to-phase faults, offering high reliability for critical applications in power generation and heavy industry. Segregated phase bus ducts, on the other hand, provide a moderate level of protection by enclosing each phase conductor in a grounded metal barrier, which makes them suitable for environments where isolation is important but the criticality is lower. Non-segregated phase bus ducts, being the most cost-effective, allow all phase conductors to reside in a common enclosure and are typically used in less demanding applications where space and cost are significant considerations. This segmentation reflects the diverse needs across various industrial, commercial, and utility applications, enabling tailored solutions that enhance safety, efficiency, and adaptability in power distribution systems.
By Voltage:
In terms of voltage, the Busway-Bus Duct Market is categorized into high-voltage, medium-voltage, and low-voltage segments. High-voltage bus ducts are essential in applications requiring the transmission of large amounts of power over long distances, such as between substations and major power consumers. Medium-voltage bus ducts are commonly used in industrial plants and large commercial complexes where they distribute power across the facility efficiently and safely. Low-voltage bus ducts, preferred for their safety and reliability, are widely used in commercial buildings and residential areas to manage power distribution within a more confined space. This segmentation enables businesses to choose products that best fit their operational voltage requirements and safety standards, optimizing their electrical systems for performance, safety, and cost-efficiency.
Segments:
Based on Type
- Isolated Phase Bus Duct
- Segregated Phase Bus Duct
- Non-segregated Phase Bus Duct
Based on Voltage
- High-voltage
- Medium-voltage
- Low-voltage
Based on End User Industry
- Residential
- Commercial
- Building Type
- Data Centers
- Shopping Centers
- Other Commercial Buildings
- Industrial
Based on the Geography:
- North America
- U.S.
- Canada
- Mexico
- Europe
- Germany
- France
- U.K.
- Italy
- Spain
- Rest of Europe
- Asia Pacific
- China
- Japan
- India
- South Korea
- South-east Asia
- Rest of Asia Pacific
- Latin America
- Brazil
- Argentina
- Rest of Latin America
- Middle East & Africa
- GCC Countries
- South Africa
- Rest of the Middle East and Africa
Regional Analysis
Asia-Pacific
The Asia-Pacific region dominates the global Busway-Bus Duct Market, holding approximately 35% of the market share. This leadership position is fueled by rapid industrial growth, extensive urbanization, and significant investments in infrastructure across emerging economies such as China, India, and Southeast Asia. The region's focus on enhancing electrical infrastructure to support its expanding industrial base and increasing residential demands plays a critical role in driving the demand for busway-bus duct systems.
North America
North America holds around 25% of the market share, with the United States leading due to its robust demand for modern electrical distribution solutions within both the commercial and industrial sectors. The market in North America is bolstered by rigorous energy efficiency standards and a strong inclination towards renovating existing infrastructure to integrate renewable energy systems. These factors, coupled with the region's advanced technological capabilities and proactive government policies aimed at improving energy distribution efficiency, significantly contribute to the sustained growth of the busway-bus duct market in this region.
Key Player Analysis
- Schneider Electric
- Siemens AG
- General Electric Company
- Eaton Corporation PLC
- ABB
- L&T Electrical & Automation
- C&S Electric Limited
- Powell Industries Inc.
- LS Cable & System Ltd.
- TAIAN-ECOBAR TECHNOLOGY
- Huapeng Group Company, Ltd.
- DBTS IND
- Godrej and Boyce Company Limited
- Tricolite Electrical Industries
- Vidhyut Control India Pvt. Ltd.
- Accu-Panels Energy Pvt. Ltd.
- Current Midwest
Competitive Analysis
In the competitive Busway-Bus Duct Market, leading players like Schneider Electric, Siemens AG, Eaton Corporation, and General Electric are pivotal in driving technological advancements and expanding market reach. These companies excel by offering innovative, efficient, and reliable busway and bus duct solutions that cater to a wide range of industrial, commercial, and residential needs. They focus on sustainability and energy efficiency, which are critical in attracting projects that aim to reduce carbon footprints and operational costs. The presence of these key players in global markets, coupled with their robust research and development capabilities, allows them to maintain a technological edge over competitors and adapt quickly to evolving market demands. Their comprehensive product portfolios and strong brand reputations help secure their market positions and enable them to explore new opportunities and regions for further expansion.
Recent Developments
- In July 2024, Powell Industries Inc. announced strong financial results for the third quarter of fiscal 2024, with significant growth in the Electric Utility sector.
- In May 2022, ABB launched the new ReliaGear™ busway, which is lighter, smaller, and easier to modify.
Market Concentration & Characteristics
The Busway-Bus Duct Market exhibits a moderate to high level of market concentration, with a few dominant global players like Schneider Electric, Siemens AG, Eaton Corporation, and General Electric significantly shaping the industry landscape. These leading companies maintain their competitive edge through continuous innovation, extensive product portfolios, and strong global distribution networks. This concentration is largely due to the technical expertise and substantial capital investment required to develop and manufacture advanced busway-bus duct systems, which naturally limits the entry of new competitors. Additionally, the established players have fortified their positions by forming strategic alliances and acquiring smaller companies to expand their technological capabilities and market reach. This strategy not only enhances their product offerings but also helps in penetrating emerging markets, thus driving the overall growth and dynamics of the global busway-bus duct market.
Report Coverage
The research report offers an in-depth analysis based on Type, Voltage, End User Industry and Geography. It details leading market players, providing an overview of their business, product offerings, investments, revenue streams, and key applications. Additionally, the report includes insights into the competitive environment, SWOT analysis, current market trends, as well as the primary drivers and constraints. Furthermore, it discusses various factors that have driven market expansion in recent years. The report also explores market dynamics, regulatory scenarios, and technological advancements that are shaping the industry. It assesses the impact of external factors and global economic changes on market growth. Lastly, it provides strategic recommendations for new entrants and established companies to navigate the complexities of the market.
Future Outlook
- Increased demand for energy-efficient power distribution systems will continue driving the market's growth.
- Expansion in industrial sectors, especially in developing regions, will boost the adoption of busway-bus ducts.
- The rise of smart grid technologies will lead to greater integration of intelligent busway-bus duct systems.
- Advancements in modular and prefabricated designs will enhance flexibility and reduce installation time.
- Growing focus on sustainability will encourage the use of eco-friendly materials in busway-bus duct production.
- The development of electric vehicle infrastructure will create new opportunities for busway-bus duct installations.
- Enhanced safety features and compliance with international standards will remain a priority for manufacturers.
- The transition to renewable energy sources will increase the demand for high-voltage busway systems.
- Rising investment in data centers and large commercial facilities will contribute to market growth.
- Strategic partnerships and acquisitions will be key to expanding market presence and technological capabilities.
Request a Free Sample
Fill in your details and we'll send you a free sample report.
- Sample data tables & charts
- Research methodology
Need a Custom Version of This Report?
Tailor the scope, geography, or segments to your exact requirements.
- Custom geography or segment scope
- Direct access to our analyst team
Frequently Asked Questions
What is the current size of the Busway-Bus Duct Market?
What factors are driving the growth of the Busway-Bus Duct Market?
What are the key segments within the Busway-Bus Duct Market?
Who are the major players in the Busway-Bus Duct Market?
Table of Content
Chapter 1. Report Introduction
- 1.1 Report Description & Purpose
- 1.1.1 Report Title & Market Definition
- 1.1.2 Unique Selling Propositions (USP) & Key Differentiators
- 1.1.3 Value Proposition for Stakeholders
- 1.2 Research Objectives
- 1.2.1 Market Sizing Objectives (Volume & Revenue)
- 1.2.2 Segmentation Objectives
- 1.2.3 Competitive Intelligence Objectives
- 1.2.4 Forecast & Scenario Objectives
- 1.3 Report Scope
- 1.3.1 Busway-Bus Duct Scope – Types & Subtypes Covered
- 1.3.2 Geographic Scope – Regions & Countries Covered
- 1.3.3 Historical Period, Base Year & Forecast Period (2024; forecast to 2032)
- 1.3.4 Inclusions & Exclusions
- 1.4 HS Code & Classification Framework
- 1.5 Currency, Units & Pricing Basis
- 1.6 Target Stakeholders
- 1.7 Limitations & Assumptions
Chapter 2. Executive Summary
- 2.1 Global Busway-Bus Duct Market Snapshot
- 2.1.1 Market Size – Historical (2024) & Forecast (2024-2032) (2024: USD 12,859.65 million → 2032: USD 19,291.01 million)
- 2.1.2 Volume & Revenue – Global Totals
- 2.1.3 Key Market Highlights – Top Five Facts
- 2.2 Busway-Bus Duct Market Segmentation Snapshot
- 2.2.1 Market Split by Region – 2024 vs. 2032
- 2.3 Competitive Snapshot
- 2.3.1 Top 10 Players by Revenue Share – 2024
- 2.3.2 Top 10 Players by Volume Share – 2024
- 2.3.3 Recent Strategic Developments (18-Month Summary)
- 2.4 Key Investment Highlights & Strategic Conclusions
Chapter 3. Busway-Bus Duct Market Dynamics & Industry Analysis
- 3.1 Market Overview & Context
- 3.1.1 Busway-Bus Duct Market Position in the Broader Automotive Value Chain
- 3.1.2 OEM vs. Replacement Market Dynamics
- 3.1.3 Market Maturity & Development Stage by Region
- 3.2 Busway-Bus Duct Market Drivers
- 3.3 Busway-Bus Duct Market Restraints & Challenges
- 3.4 Busway-Bus Duct Market Opportunities
- 3.5 Porter's Five Forces Analysis
- 3.5.1 Threat of New Entrants
- 3.5.2 Bargaining Power of Suppliers
- 3.5.3 Bargaining Power of Buyers
- 3.5.4 Threat of Substitutes
- 3.5.5 Competitive Rivalry – Intensity Assessment
- 3.6 Busway-Bus Duct Value Chain Analysis
- 3.6.1 Upstream – Raw Material/Input Suppliers
- 3.6.1.1 Raw Material/Input 1
- 3.6.1.2 Raw Material/Input 2
- 3.6.1.3 Raw Material/Input 3
- 3.6.2 Midstream – Production/Manufacturing/Service Delivery
- 3.6.2.1 Production/Process Overview
- 3.6.2.2 Key Facility Locations & Capacity by Manufacturer
- 3.6.3 Downstream – Distribution & End Consumer
- 3.6.3.1 Primary Channel – B2B/OEM
- 3.6.3.2 Secondary Channels – Dealer, Retail, Online, Direct
- 3.6.4 Value Chain Profitability Analysis
- 3.6.1 Upstream – Raw Material/Input Suppliers
- 3.7 PESTEL Analysis
- 3.7.1 Political Factors
- 3.7.2 Economic Factors
- 3.7.3 Social Factors
- 3.7.4 Technological Factors
- 3.7.5 Environmental Factors
- 3.7.6 Legal Factors
- 3.8 Busway-Bus Duct Supply Chain Analysis
- 3.8.1 Raw Material/Input Supply Risk Assessment
- 3.8.2 Manufacturing Concentration Risk (Geographic Exposure)
- 3.8.3 Trade Disruption Impact Analysis
- 3.9 Regulatory & Policy Landscape
Note: The regulatory and policy landscape section covers regulations based on their applicability to the market, Busway-Bus Duct category, geography, and scope of the study. Only regulatory frameworks with a material impact on operations, compliance, trade, sustainability, or market access are analyzed in detail.
Chapter 4. Key Investment Pockets & Opportunity Analysis
- 4.1 Busway-Bus Duct Market Attractiveness Analysis
- 4.1.1 By Region – Investment Attractiveness Matrix (Volume × CAGR)
- 4.2 Absolute Revenue Growth Opportunity
- 4.2.1 By Region – Absolute USD Growth Through 2032
- 4.3 Incremental Volume Opportunity
- 4.3.1 By Region – Incremental Volume Through 2032
- 4.3.2 Segment – Incremental Volume
- 4.4 Emerging Submarket Opportunity Deep Dive (Subject to Applicability)
- 4.5 Emerging Market Opportunity Scorecards
- 4.5.1 United States
- 4.5.2 Europe
- 4.5.3 Asia
- 4.5.4 Middle East & Africa
Note: Emerging Market Opportunity Scorecards will be included based on relevance and strategic importance. Regions listed are indicative and may vary depending on data availability and market dynamics.
Chapter 5. Busway-Bus Duct Import-Export Analysis & Trade Flows
- 5.1 Global Trade Overview
- 5.1.1 Global Export Value by Country (2024)
- 5.1.2 Global Export Volume by Country (2024)
- 5.1.3 Global Import Value by Country (2024)
- 5.1.4 Global Import Volume by Country (2024)
- 5.1.5 Net Trade Balance by Country (2024)
- 5.2 Export Analysis – Segment
- 5.2.1 Type 1 (HS Code)
- 5.2.2 Type 2 (HS Code)
- 5.2.3 Type 3 (HS Code)
- 5.2.4 Type 4 (HS Code)
- 5.2.5 Type 5 (HS Code)
- 5.3 Import Analysis – Segment
- 5.3.1 Type 1 (HS Code)
- 5.3.2 Type 2 (HS Code)
- 5.3.3 Type 3 (HS Code)
- 5.3.4 Type 4 (HS Code)
- 5.3.5 Type 5 (HS Code)
- 5.4 Average Unit Trade Prices
- 5.4.1 Average Export Price – Segment & Country
- 5.4.2 Average Import Price – Segment & Source Country
- 5.4.3 Price Trends (2024)
- 5.5 Key Trade Route Analysis
- 5.5.1 Trade Route 1
- 5.5.2 Trade Route 2
- 5.5.3 Trade Route 3
- 5.5.4 Trade Route 4
- 5.5.5 Trade Route 5
- 5.6 Trade Policy Impact Assessment
- 5.6.1 US Anti-Dumping & Section 301 Tariffs
- 5.6.2 EU Customs Union Impact
- 5.6.3 Major Free Trade Agreements
- 5.6.4 USMCA Rules of Origin
Note: Trade policy analysis will be included only where relevant to the Busway-Bus Duct market.
Chapter 6. Competitive Landscape & Company Benchmarking
- 6.1 Busway-Bus Duct Market Concentration & Structure
- 6.1.1 Herfindahl-Hirschman Index (HHI) – vs. 2024
- 6.1.2 Tier 1, Tier 2 & Tier 3 Market Structure
- 6.1.3 Global, Regional & Local Player Dynamics
- 6.2 Busway-Bus Duct Market Share Analysis – 2024
- 6.2.1 Global Revenue Share by Company
- 6.2.2 Global Volume Share by Company
- 6.2.3 Regional Revenue Share
- 6.2.4 Market Share Evolution ( vs. 2024)
- 6.2.5 OEM Segment Share by Company
- 6.2.6 Replacement Segment Share by Company
- 6.3 Production/Delivery Capacity & Facility Analysis
- 6.3.1 Global Installed Capacity
- 6.3.2 Capacity Utilization Rates
- 6.3.3 Production/Output Volume
- 6.3.4 Facility Locations & Capacity Map
- 6.3.5 Planned Capacity Additions
- 6.4 Busway-Bus Duct Competitive Benchmarking Matrix
- 6.4.1 Revenue, Volume, CAGR & Profitability Comparison
- 6.4.2 Channel Revenue Mix
- 6.4.3 Geographic Revenue Exposure
- 6.4.4 R&D Intensity
- 6.4.5 Sustainability Maturity
- 6.5 Strategic Developments in Busway-Bus Duct (Last 24 Months)
- 6.5.1 Mergers, Acquisitions & Divestments
- 6.5.2 New Busway-Bus Duct Launches
- 6.5.3 Facility Expansions
- 6.5.4 Strategic Alliances, Joint Ventures & Partnerships
- 6.5.5 Distribution Expansion & Market Entry
- 6.5.6 Sustainability & ESG Initiatives
- 6.6 Competitive Strategy Mapping
- 6.6.1 Leader, Challenger, Follower & Niche Classification
- 6.6.2 Pricing Strategy Comparison
- 6.6.3 Channel Strategy Matrix
Note: Strategic developments are included based on their materiality and the availability of reliable information.
Chapter 7. Global Busway-Bus Duct Market – By Distribution Channel
- 7.1 Segment Overview
- 7.1.1 Volume & Revenue Split by Channel (2024 & 2032)
- 7.1.2 Channel Mix Evolution (2024-2032)
Chapter 8. Regional Market Analysis – Global Overview
- 8.1 Global Regional Overview
- 8.1.1 Regional Volume Share
- 8.1.2 Regional Revenue Share
- 8.1.3 Regional Volume by Region
- 8.1.4 Regional Revenue by Region
- 8.1.5 Regional Forecast Through 2032
- 8.2 Cross-Regional Segment Analysis
- 8.2.1 By Distribution Channel
- 8.2.2 By Brand/Price Tier
Chapter 9. North America Busway-Bus Duct Market
- 9.1 United States
- 9.2 Canada
- 9.3 Mexico
Chapter 10. Europe Busway-Bus Duct Market
- 10.1 Germany
- 10.2 France
- 10.3 Italy
- 10.4 United Kingdom
- 10.5 Spain
- 10.6 Poland
- 10.7 Russia
- 10.8 Netherlands
- 10.9 Belgium
- 10.10 Sweden
- 10.11 Denmark
- 10.12 Norway
- 10.13 Rest of Europe
Chapter 11. Asia Pacific Busway-Bus Duct Market
- 11.1 China
- 11.2 India
- 11.3 Japan
- 11.4 South Korea
- 11.5 Thailand
- 11.6 Indonesia
- 11.7 Vietnam
- 11.8 Malaysia
- 11.9 Australia
- 11.10 Rest of Asia Pacific
Chapter 12. Latin America Busway-Bus Duct Market
- 12.1 Brazil
- 12.2 Argentina
- 12.3 Colombia
- 12.4 Chile
- 12.5 Rest of Latin America
Chapter 13. Middle East Busway-Bus Duct Market
- 13.1 Saudi Arabia
- 13.2 United Arab Emirates
- 13.3 Turkey
- 13.4 Israel
- 13.5 Iran
- 13.6 Rest of the Middle East
Chapter 14. Africa Busway-Bus Duct Market
- 14.1 South Africa
- 14.2 Egypt
- 14.3 Nigeria
- 14.4 Morocco
- 14.5 Rest of Africa
Chapter 15. Busway-Bus Duct Company Profiles
- 15.1 [Company 01]
- 15.1.1 Company Overview
- 15.1.2 Key Management Personnel
- 15.1.3 Products & Services Portfolio
- 15.1.4 Financial Performance
- 15.1.5 Key Market Focus & Geographic Presence
- 15.1.6 Recent Developments & Strategic Initiatives
Note: The company profile list is preliminary and may change based on research findings, market developments, data availability, and client requirements.
Chapter 16. Appendices
- Appendix A – List of Abbreviations & Acronyms
- Appendix B – Industry Classification Code Reference – Full Series
- Appendix C – Production & Capacity Data Tables
- Appendix D – End-Use & Demand Base Tables
- Appendix E – Consumption & Replacement Rate Assumptions
- Appendix F – ASP Reference Tables
- Appendix G – Manufacturing & Facility Database
- Appendix H – Import-Export Data Tables
- Appendix I – Regulatory Summary Tables
- Appendix J – Primary Research Participant List (Anonymized)
- Appendix K – Primary Research Questionnaire Framework
- Appendix L – Data Sources & Bibliography
- Appendix M – Market Size Divergence & Source Comparison
Chapter 17. Research Methodology
- 17.1 Research Framework & Philosophy
- 17.2 Secondary Research – Sources, Hierarchy & Data Extraction
- 17.3 Data Modeling – Bottom-Up & Top-Down Market Sizing
- 17.4 Primary Research – Stakeholder Framework, LOI & Sample Sizes
- 17.5 Forecast Methodology – Regression, Scenario & Sensitivity Analysis
- 17.6 Quality Control – Four-Layer Validation Framework
- 17.7 Limitations & Standard Assumptions
- 17.8 Disclaimer
