
Market overview
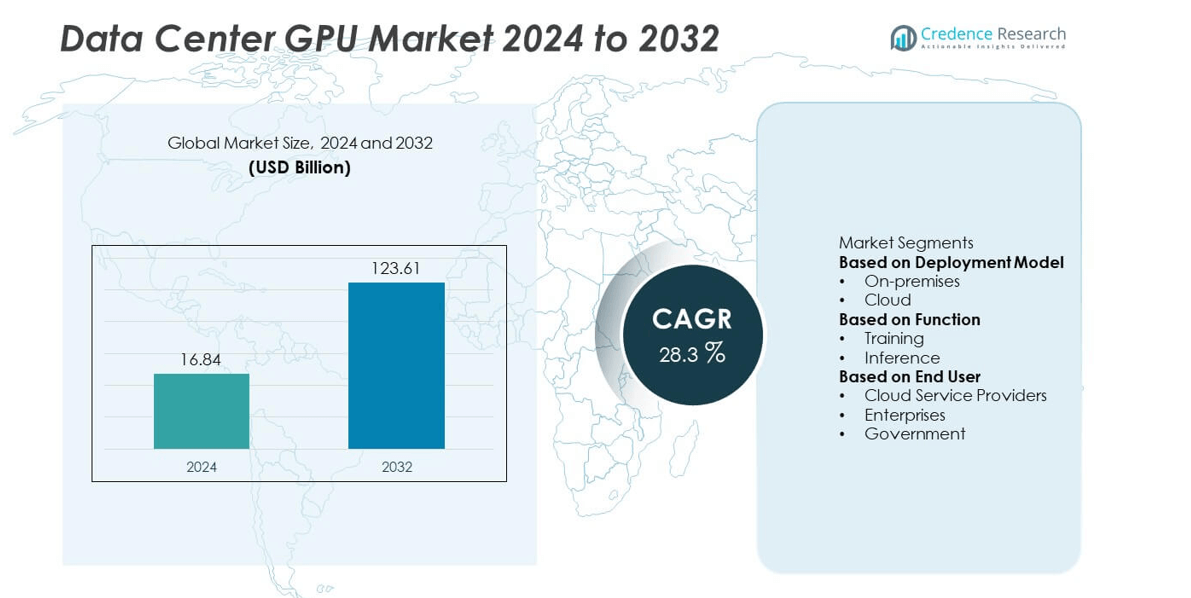
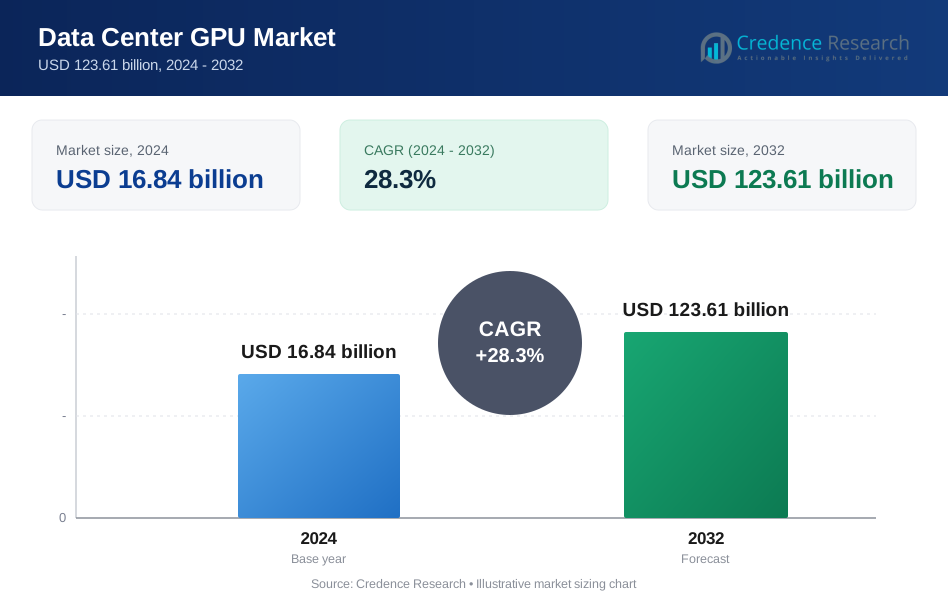
The Data Center GPU market was valued at USD 16.84 billion in 2024 and is projected to reach USD 123.61 billion by 2032, expanding at a CAGR of 28.3% during the forecast period.
| REPORT ATTRIBUTE | DETAILS |
|---|---|
| Historical Period | 2020-2023 |
| Base Year | 2024 |
| Forecast Period | 2025-2032 |
| Data Center GPU Market Size 2024 | USD 16.84 billion |
| Data Center GPU Market, CAGR | 28.3% |
| Data Center GPU Market Size 2032 | USD 123.61 billion |
The data center GPU market is led by major players such as NVIDIA Corporation, Intel Corporation, Huawei Technologies Co., Ltd., Qualcomm Technologies, Inc., IBM Corporation, Samsung Electronics Co., Ltd., Advantech Co., Ltd., Imagination Technologies, Google Inc., and Advanced Micro Devices, Inc. These companies drive innovation through advanced GPU architectures, AI-optimized processing, and strategic collaborations with hyperscale data centers. North America leads the global market with a 41% share, driven by high adoption of AI and cloud infrastructure. Europe follows with 28%, supported by strong enterprise digitization, while Asia-Pacific holds 23%, emerging as the fastest-growing region due to rapid expansion of AI-driven and hyperscale data center facilities.
Market Insights
- The data center GPU market was valued at USD 16.84 billion in 2024 and is projected to reach USD 123.61 billion by 2032, growing at a CAGR of 28.3%.
- Increasing adoption of AI, machine learning, and deep learning applications across enterprises and cloud platforms is driving strong market growth.
- The market trend highlights rapid deployment of GPU-accelerated servers, energy-efficient architectures, and AI-optimized hardware for high-performance computing.
- Key players such as NVIDIA Corporation, Intel Corporation, and Advanced Micro Devices, Inc. lead through innovation, partnerships, and advanced chip design strategies.
- North America dominates with a 41% share, followed by Europe at 28% and Asia-Pacific at 23%, while the cloud deployment segment holds a 63% share, leading due to scalability and flexibility in AI-driven workloads.
Market Segmentation Analysis:
By Deployment Model
The cloud segment dominated the data center GPU market in 2024 with a 63% share. The growth is driven by the rapid expansion of hyperscale cloud providers and increasing adoption of AI-as-a-Service and GPU-accelerated cloud computing. Cloud-based GPU infrastructure offers scalability, flexibility, and cost efficiency, making it ideal for AI workloads and data analytics. Rising demand from enterprises for on-demand GPU resources to manage fluctuating workloads further supports this segment’s leadership. On-premises deployment remains relevant for industries prioritizing data security and low-latency processing in private data centers.
- For instance, Amazon Web Services deployed EC2 P5 instances with NVIDIA H100 Tensor Core GPUs, enabling customers to perform model training workloads up to 6 times faster than prior A100-based clusters, and these P5 instances can scale up to 20,000 GPUs within an EC2 UltraCluster. This significantly improves throughput for large-scale generative AI applications.
By Function
The training segment held the largest share of 58% in 2024, leading the data center GPU market. GPUs are essential for training deep learning models, as they provide massive parallel processing power and faster computation. The rising adoption of large language models, computer vision, and generative AI applications drives this dominance. Companies are investing in high-performance GPUs to enhance model accuracy and reduce training time. The inference segment is growing steadily as edge computing and real-time AI analytics gain traction, demanding faster, power-efficient GPU architectures for deployment.
- For instance, Google offers access to NVIDIA H100 GPUs through its A3 supercomputer instances on Google Cloud. Google has also trained AI models with over a trillion parameters, such as the Switch Transformer model.
By End User
Cloud service providers accounted for the largest share of 52% in the data center GPU market in 2024. The growing need for AI-driven cloud platforms and virtualized GPU environments supports this dominance. Leading hyperscale providers are expanding GPU-equipped data centers to meet the rising demand for AI training and inference workloads. Enterprises are also adopting GPU clusters for analytics, digital twins, and cybersecurity applications. Government agencies increasingly deploy GPUs for defense simulations and data intelligence programs. The trend toward AI-powered infrastructure continues to strengthen cloud providers’ leadership globally.
Key Growth Drivers
Rising Adoption of Artificial Intelligence and Machine Learning
The growing use of artificial intelligence (AI) and machine learning (ML) across industries is a major driver of the data center GPU market. GPUs are essential for training complex neural networks and processing vast datasets efficiently. Enterprises and cloud providers are investing heavily in AI infrastructure to support applications in autonomous systems, healthcare, and financial analytics. The increasing deployment of large-scale AI models and generative AI platforms such as ChatGPT and DALL·E further amplifies the demand for high-performance GPU-powered data centers.
- For instance, OpenAI uses over 25,000 NVIDIA A100 Tensor Core GPUs within Microsoft's Azure infrastructure to train and fine-tune its GPT-4 models, achieving processing speeds on a massive supercomputer built for generative AI workloads.
Expansion of Cloud and Hyperscale Data Centers
Rapid growth in cloud computing and hyperscale data centers is accelerating GPU adoption. Leading providers such as Amazon Web Services, Google Cloud, and Microsoft Azure are expanding GPU-enabled clusters to deliver AI-driven services and high-performance computing. GPUs offer scalability, cost efficiency, and flexibility for dynamic workloads, making them crucial for data-intensive cloud operations. The increasing migration of enterprises to hybrid and multi-cloud environments further strengthens GPU integration in large-scale computing infrastructure.
- For instance, Oracle Cloud Infrastructure incorporated up to 16,384 AMD Instinct MI300X accelerators into a single GPU SuperCluster system, which was designed to support demanding AI model training and large language model workloads.
Growing Demand for High-Performance Computing (HPC)
The rising need for high-performance computing across research, defense, and industrial applications is boosting data center GPU deployment. GPUs enable faster simulations, modeling, and data analytics for complex computational tasks. Sectors like climate modeling, genomics, and energy exploration increasingly rely on GPU-accelerated computing to reduce processing time and enhance accuracy. The development of next-generation GPU architectures optimized for parallel workloads supports higher efficiency. The growing integration of HPC systems with AI workloads further drives sustained demand for data center GPUs.
Key Trends & Opportunities
Integration of Generative AI and Large Language Models
The global surge in generative AI applications, including large language models and image synthesis platforms, is transforming the data center GPU landscape. These models require extensive computational power and parallel processing capabilities. GPU vendors are developing specialized AI chips optimized for such workloads. Cloud providers are scaling infrastructure to support advanced AI frameworks, creating new opportunities for GPU manufacturers. This trend is expected to continue as industries adopt generative AI for automation, content creation, and business intelligence.
- For instance, Meta Platforms deployed 6,080 NVIDIA A100 GPUs in its Research SuperCluster (RSC), with plans to scale to 16,000 GPUs to reach a peak performance of nearly 5 exaflops of mixed precision compute.
Emergence of Energy-Efficient and Custom GPU Architectures
Energy efficiency has become a key focus area in data center operations. Manufacturers are introducing GPUs designed with advanced cooling systems and power-optimized architectures to reduce energy consumption. The development of customized GPUs for specific workloads, such as inference or edge AI, is gaining momentum. These innovations support sustainable computing while improving total cost efficiency. The trend toward integrating AI accelerators and custom silicon alongside GPUs presents opportunities for hybrid and specialized data center designs.
- For instance, Intel's Gaudi2 AI accelerator delivers up to 2.45 terabytes per second of memory bandwidth, enhancing large-scale AI training clusters deployed by Dell Technologies and Supermicro.
Key Challenges
High Infrastructure and Operational Costs
Setting up GPU-enabled data centers involves significant capital investment. High costs of GPUs, cooling systems, and power supply infrastructure increase total deployment expenses. Additionally, operational costs rise with energy consumption and maintenance requirements. Small and mid-sized enterprises often face financial barriers in adopting GPU-based infrastructure. To address this, cloud-based GPU services are emerging as a cost-effective alternative. However, balancing performance, scalability, and affordability remains a persistent challenge for widespread GPU adoption in data centers.
Thermal Management and Energy Efficiency Issues
GPUs generate substantial heat during high-performance computing tasks, creating challenges in thermal management. Inefficient cooling systems can lead to energy waste, performance degradation, and shorter hardware lifespans. As AI workloads grow in intensity, data centers face rising power density and environmental concerns. Managing these thermal loads while maintaining performance efficiency requires innovations in liquid cooling, immersion technology, and advanced airflow design. The ongoing need for energy-efficient operation remains one of the most critical challenges for GPU-powered data centers worldwide.
Regional Analysis
North America
North America held the largest share of 41% in the data center GPU market in 2024. The region’s dominance is driven by strong adoption of AI, machine learning, and cloud computing technologies. The U.S. leads due to major investments from tech giants such as NVIDIA, Google, and Amazon Web Services in GPU-based infrastructure. High demand for hyperscale data centers and advanced computing applications across sectors supports continuous growth. Canada also contributes through increasing data center expansion and government support for AI-driven research and digital transformation initiatives.
Europe
Europe accounted for 28% of the data center GPU market in 2024. Rising focus on data sovereignty, energy-efficient computing, and AI research is boosting regional demand. The U.K., Germany, and France are leading adopters due to large-scale cloud infrastructure investments and growing enterprise digitization. The European Union’s initiatives for AI and supercomputing innovation further support GPU deployment. Data center operators are increasingly adopting GPUs for high-performance computing and deep learning applications, while ongoing efforts to develop sustainable and carbon-neutral data centers strengthen market potential.
Asia-Pacific
Asia-Pacific captured a 23% share of the data center GPU market in 2024 and is the fastest-growing region. Rapid digitalization, cloud expansion, and government-backed AI programs in China, Japan, India, and South Korea drive regional growth. Chinese hyperscale providers such as Alibaba Cloud and Tencent Cloud are expanding GPU-powered data centers to support AI and analytics workloads. Growing investments in semiconductor manufacturing and 5G infrastructure enhance the ecosystem. The increasing adoption of AI in financial, healthcare, and manufacturing sectors further accelerates GPU demand across the region.
Latin America
Latin America held a 5% share of the data center GPU market in 2024. Growth is fueled by expanding cloud computing adoption and increasing data traffic from e-commerce and digital services. Brazil and Mexico lead the region, supported by growing hyperscale data center construction and AI-based enterprise applications. The demand for GPU acceleration in data analytics and cybersecurity strengthens regional uptake. However, limited local infrastructure and higher energy costs remain challenges. Strategic partnerships with global cloud providers are helping to bridge the technology and capability gap.
Middle East & Africa
The Middle East & Africa region accounted for a 3% share of the data center GPU market in 2024. Rapid digital transformation, growing investment in smart cities, and AI-driven public initiatives are driving growth. The United Arab Emirates and Saudi Arabia are leading markets, focusing on national AI strategies and data localization policies. Africa is witnessing gradual adoption as countries develop their digital ecosystems. Investments in hyperscale facilities and government-backed technology hubs continue to expand regional capacity. However, energy limitations and high infrastructure costs still pose challenges to large-scale GPU deployment.
Market Segmentations:
By Deployment Model
- On-premises
- Cloud
By Function
- Training
- Inference
By End User
- Cloud Service Providers
- Enterprises
- Government
By Geography
- North America
- U.S.
- Canada
- Mexico
- Europe
- Germany
- France
- U.K.
- Italy
- Spain
- Rest of Europe
- Asia Pacific
- China
- Japan
- India
- South Korea
- South-east Asia
- Rest of Asia Pacific
- Latin America
- Brazil
- Argentina
- Rest of Latin America
- Middle East & Africa
- GCC Countries
- South Africa
- Rest of the Middle East and Afric
Competitive Landscape
The data center GPU market is highly competitive, with major players including NVIDIA Corporation, Intel Corporation, Huawei Technologies Co., Ltd., Qualcomm Technologies, Inc., IBM Corporation, Samsung Electronics Co., Ltd., Advantech Co., Ltd., Imagination Technologies, Google Inc., and Advanced Micro Devices, Inc. These companies dominate through strong technological innovation, advanced GPU architectures, and strategic partnerships with cloud and data center operators. NVIDIA leads the market with its CUDA platform and AI-optimized GPUs, while AMD and Intel are expanding through high-performance, energy-efficient designs. Tech giants like Google and Huawei invest in in-house GPU development to enhance AI processing efficiency and reduce dependency on third-party hardware. The competitive landscape is shaped by continuous R&D, chip customization for AI workloads, and the growing integration of GPUs into hybrid and edge data centers. Collaboration between hardware providers and hyperscale cloud firms remains central to maintaining technological leadership in the rapidly evolving data center GPU market.
Key Player Analysis
- NVIDIA Corporation
- Intel Corporation
- Huawei Technologies Co., Ltd.
- Qualcomm Technologies, Inc.
- IBM Corporation
- Samsung Electronics Co., Ltd.
- Advantech Co., Ltd.
- Imagination Technologies
- Google Inc.
- Advanced Micro Devices, Inc.
Recent Developments
- In September 2025, Huawei Technologies disclosed plans for a three-year initiative to overtake Nvidia in AI chips by improving connection and memory access speeds.
- In September 2025, Qualcomm Technologies began integrating NVLink Fusion and Nvidia GPU interconnects into its data center roadmap to support AI workloads.
- In 2025, Advantech Co., Ltd. expanded its server platforms to support dual-GPU modules, including those based on Nvidia and AMD architectures
- In 2025, NVIDIA Corporation unveiled the Blackwell Ultra GPU for data centers, built on its Blackwell architecture and designed for generative AI workloads
Report Coverage
The research report offers an in-depth analysis based on Deployment Model, Function, End Use and Geography. It details leading market players, providing an overview of their business, product offerings, investments, revenue streams, and key applications. Additionally, the report includes insights into the competitive environment, SWOT analysis, current market trends, as well as the primary drivers and constraints. Furthermore, it discusses various factors that have driven market expansion in recent years. The report also explores market dynamics, regulatory scenarios, and technological advancements that are shaping the industry. It assesses the impact of external factors and global economic changes on market growth. Lastly, it provides strategic recommendations for new entrants and established companies to navigate the complexities of the market.
Future Outlook
- Demand for GPU-accelerated computing will rise with the expansion of AI and machine learning workloads.
- Cloud-based GPU services will continue to grow as enterprises shift toward scalable infrastructure.
- Advancements in GPU architectures will improve processing efficiency and reduce energy consumption.
- Integration of GPUs with CPUs and AI accelerators will enhance data center performance.
- Hyperscale data centers will remain the largest adopters of GPU-powered systems.
- Edge computing will drive demand for compact, high-performance GPU solutions.
- Custom AI chips and domain-specific GPUs will gain traction for specialized workloads.
- Sustainability initiatives will push the development of energy-efficient GPU cooling and power systems.
- Partnerships between chipmakers and cloud providers will strengthen global data center ecosystems.
- Asia-Pacific will experience rapid growth, driven by digital transformation and large-scale AI infrastructure investments.
Request a Free Sample
Fill in your details and we'll send you a free sample report.
- Sample data tables & charts
- Research methodology
Need a Custom Version of This Report?
Tailor the scope, geography, or segments to your exact requirements.
- Custom geography or segment scope
- Direct access to our analyst team
Frequently Asked Questions
What is the current market size for the Data Center GPU market, and what is its projected size in ?
At what Compound Annual Growth Rate is the Data Center GPU market projected to grow between 2025 and 2032?
Which Data Center GPU market segment held the largest share in 2024?
What are the primary factors fueling the growth of the Data Center GPU market?
Who are the leading companies in the Data Center GPU market?
Table of Content
Chapter 1. Report Introduction
- 1.1 Report Description & Purpose
- 1.1.1 Report Title & Market Definition
- 1.1.2 Unique Selling Propositions (USP) & Key Differentiators
- 1.1.3 Value Proposition for Stakeholders
- 1.2 Research Objectives
- 1.2.1 Market Sizing Objectives (Volume & Revenue)
- 1.2.2 Segmentation Objectives
- 1.2.3 Competitive Intelligence Objectives
- 1.2.4 Forecast & Scenario Objectives
- 1.3 Report Scope
- 1.3.1 Data Center GPU Scope – Types & Subtypes Covered
- 1.3.2 Geographic Scope – Regions & Countries Covered
- 1.3.3 Historical Period, Base Year & Forecast Period (2024; forecast to 2032)
- 1.3.4 Inclusions & Exclusions
- 1.4 HS Code & Classification Framework
- 1.5 Currency, Units & Pricing Basis
- 1.6 Target Stakeholders
- 1.7 Limitations & Assumptions
Chapter 2. Executive Summary
- 2.1 Global Data Center GPU Market Snapshot
- 2.1.1 Market Size – Historical (2024) & Forecast (2024-2032) (2024: USD 16.84 billion → 2032: USD 123.61 billion)
- 2.1.2 Volume & Revenue – Global Totals
- 2.1.3 Key Market Highlights – Top Five Facts
- 2.2 Data Center GPU Market Segmentation Snapshot
- 2.2.1 Market Split by Region – 2024 vs. 2032
- 2.3 Competitive Snapshot
- 2.3.1 Top 10 Players by Revenue Share – 2024
- 2.3.2 Top 10 Players by Volume Share – 2024
- 2.3.3 Recent Strategic Developments (18-Month Summary)
- 2.4 Key Investment Highlights & Strategic Conclusions
Chapter 3. Data Center GPU Market Dynamics & Industry Analysis
- 3.1 Market Overview & Context
- 3.1.1 Data Center GPU Market Position in the Broader Automotive Value Chain
- 3.1.2 OEM vs. Replacement Market Dynamics
- 3.1.3 Market Maturity & Development Stage by Region
- 3.2 Data Center GPU Market Drivers
- 3.3 Data Center GPU Market Restraints & Challenges
- 3.4 Data Center GPU Market Opportunities
- 3.5 Porter's Five Forces Analysis
- 3.5.1 Threat of New Entrants
- 3.5.2 Bargaining Power of Suppliers
- 3.5.3 Bargaining Power of Buyers
- 3.5.4 Threat of Substitutes
- 3.5.5 Competitive Rivalry – Intensity Assessment
- 3.6 Data Center GPU Value Chain Analysis
- 3.6.1 Upstream – Raw Material/Input Suppliers
- 3.6.1.1 Raw Material/Input 1
- 3.6.1.2 Raw Material/Input 2
- 3.6.1.3 Raw Material/Input 3
- 3.6.2 Midstream – Production/Manufacturing/Service Delivery
- 3.6.2.1 Production/Process Overview
- 3.6.2.2 Key Facility Locations & Capacity by Manufacturer
- 3.6.3 Downstream – Distribution & End Consumer
- 3.6.3.1 Primary Channel – B2B/OEM
- 3.6.3.2 Secondary Channels – Dealer, Retail, Online, Direct
- 3.6.4 Value Chain Profitability Analysis
- 3.6.1 Upstream – Raw Material/Input Suppliers
- 3.7 PESTEL Analysis
- 3.7.1 Political Factors
- 3.7.2 Economic Factors
- 3.7.3 Social Factors
- 3.7.4 Technological Factors
- 3.7.5 Environmental Factors
- 3.7.6 Legal Factors
- 3.8 Data Center GPU Supply Chain Analysis
- 3.8.1 Raw Material/Input Supply Risk Assessment
- 3.8.2 Manufacturing Concentration Risk (Geographic Exposure)
- 3.8.3 Trade Disruption Impact Analysis
- 3.9 Regulatory & Policy Landscape
Note: The regulatory and policy landscape section covers regulations based on their applicability to the market, Data Center GPU category, geography, and scope of the study. Only regulatory frameworks with a material impact on operations, compliance, trade, sustainability, or market access are analyzed in detail.
Chapter 4. Key Investment Pockets & Opportunity Analysis
- 4.1 Data Center GPU Market Attractiveness Analysis
- 4.1.1 By Region – Investment Attractiveness Matrix (Volume × CAGR)
- 4.2 Absolute Revenue Growth Opportunity
- 4.2.1 By Region – Absolute USD Growth Through 2032
- 4.3 Incremental Volume Opportunity
- 4.3.1 By Region – Incremental Volume Through 2032
- 4.3.2 Segment – Incremental Volume
- 4.4 Emerging Submarket Opportunity Deep Dive (Subject to Applicability)
- 4.5 Emerging Market Opportunity Scorecards
- 4.5.1 United States
- 4.5.2 Europe
- 4.5.3 Asia
- 4.5.4 Middle East & Africa
Note: Emerging Market Opportunity Scorecards will be included based on relevance and strategic importance. Regions listed are indicative and may vary depending on data availability and market dynamics.
Chapter 5. Data Center GPU Import-Export Analysis & Trade Flows
- 5.1 Global Trade Overview
- 5.1.1 Global Export Value by Country (2024)
- 5.1.2 Global Export Volume by Country (2024)
- 5.1.3 Global Import Value by Country (2024)
- 5.1.4 Global Import Volume by Country (2024)
- 5.1.5 Net Trade Balance by Country (2024)
- 5.2 Export Analysis – Segment
- 5.2.1 Type 1 (HS Code)
- 5.2.2 Type 2 (HS Code)
- 5.2.3 Type 3 (HS Code)
- 5.2.4 Type 4 (HS Code)
- 5.2.5 Type 5 (HS Code)
- 5.3 Import Analysis – Segment
- 5.3.1 Type 1 (HS Code)
- 5.3.2 Type 2 (HS Code)
- 5.3.3 Type 3 (HS Code)
- 5.3.4 Type 4 (HS Code)
- 5.3.5 Type 5 (HS Code)
- 5.4 Average Unit Trade Prices
- 5.4.1 Average Export Price – Segment & Country
- 5.4.2 Average Import Price – Segment & Source Country
- 5.4.3 Price Trends (2024)
- 5.5 Key Trade Route Analysis
- 5.5.1 Trade Route 1
- 5.5.2 Trade Route 2
- 5.5.3 Trade Route 3
- 5.5.4 Trade Route 4
- 5.5.5 Trade Route 5
- 5.6 Trade Policy Impact Assessment
- 5.6.1 US Anti-Dumping & Section 301 Tariffs
- 5.6.2 EU Customs Union Impact
- 5.6.3 Major Free Trade Agreements
- 5.6.4 USMCA Rules of Origin
Note: Trade policy analysis will be included only where relevant to the Data Center GPU market.
Chapter 6. Competitive Landscape & Company Benchmarking
- 6.1 Data Center GPU Market Concentration & Structure
- 6.1.1 Herfindahl-Hirschman Index (HHI) – vs. 2024
- 6.1.2 Tier 1, Tier 2 & Tier 3 Market Structure
- 6.1.3 Global, Regional & Local Player Dynamics
- 6.2 Data Center GPU Market Share Analysis – 2024
- 6.2.1 Global Revenue Share by Company
- 6.2.2 Global Volume Share by Company
- 6.2.3 Regional Revenue Share
- 6.2.4 Market Share Evolution ( vs. 2024)
- 6.2.5 OEM Segment Share by Company
- 6.2.6 Replacement Segment Share by Company
- 6.3 Production/Delivery Capacity & Facility Analysis
- 6.3.1 Global Installed Capacity
- 6.3.2 Capacity Utilization Rates
- 6.3.3 Production/Output Volume
- 6.3.4 Facility Locations & Capacity Map
- 6.3.5 Planned Capacity Additions
- 6.4 Data Center GPU Competitive Benchmarking Matrix
- 6.4.1 Revenue, Volume, CAGR & Profitability Comparison
- 6.4.2 Channel Revenue Mix
- 6.4.3 Geographic Revenue Exposure
- 6.4.4 R&D Intensity
- 6.4.5 Sustainability Maturity
- 6.5 Strategic Developments in Data Center GPU (Last 24 Months)
- 6.5.1 Mergers, Acquisitions & Divestments
- 6.5.2 New Data Center GPU Launches
- 6.5.3 Facility Expansions
- 6.5.4 Strategic Alliances, Joint Ventures & Partnerships
- 6.5.5 Distribution Expansion & Market Entry
- 6.5.6 Sustainability & ESG Initiatives
- 6.6 Competitive Strategy Mapping
- 6.6.1 Leader, Challenger, Follower & Niche Classification
- 6.6.2 Pricing Strategy Comparison
- 6.6.3 Channel Strategy Matrix
Note: Strategic developments are included based on their materiality and the availability of reliable information.
Chapter 7. Global Data Center GPU Market – By Distribution Channel
- 7.1 Segment Overview
- 7.1.1 Volume & Revenue Split by Channel (2024 & 2032)
- 7.1.2 Channel Mix Evolution (2024-2032)
Chapter 8. Regional Market Analysis – Global Overview
- 8.1 Global Regional Overview
- 8.1.1 Regional Volume Share
- 8.1.2 Regional Revenue Share
- 8.1.3 Regional Volume by Region
- 8.1.4 Regional Revenue by Region
- 8.1.5 Regional Forecast Through 2032
- 8.2 Cross-Regional Segment Analysis
- 8.2.1 By Distribution Channel
- 8.2.2 By Brand/Price Tier
Chapter 9. North America Data Center GPU Market
- 9.1 United States
- 9.2 Canada
- 9.3 Mexico
Chapter 10. Europe Data Center GPU Market
- 10.1 Germany
- 10.2 France
- 10.3 Italy
- 10.4 United Kingdom
- 10.5 Spain
- 10.6 Poland
- 10.7 Russia
- 10.8 Netherlands
- 10.9 Belgium
- 10.10 Sweden
- 10.11 Denmark
- 10.12 Norway
- 10.13 Rest of Europe
Chapter 11. Asia Pacific Data Center GPU Market
- 11.1 China
- 11.2 India
- 11.3 Japan
- 11.4 South Korea
- 11.5 Thailand
- 11.6 Indonesia
- 11.7 Vietnam
- 11.8 Malaysia
- 11.9 Australia
- 11.10 Rest of Asia Pacific
Chapter 12. Latin America Data Center GPU Market
- 12.1 Brazil
- 12.2 Argentina
- 12.3 Colombia
- 12.4 Chile
- 12.5 Rest of Latin America
Chapter 13. Middle East Data Center GPU Market
- 13.1 Saudi Arabia
- 13.2 United Arab Emirates
- 13.3 Turkey
- 13.4 Israel
- 13.5 Iran
- 13.6 Rest of the Middle East
Chapter 14. Africa Data Center GPU Market
- 14.1 South Africa
- 14.2 Egypt
- 14.3 Nigeria
- 14.4 Morocco
- 14.5 Rest of Africa
Chapter 15. Data Center GPU Company Profiles
- 15.1 [Company 01]
- 15.1.1 Company Overview
- 15.1.2 Key Management Personnel
- 15.1.3 Products & Services Portfolio
- 15.1.4 Financial Performance
- 15.1.5 Key Market Focus & Geographic Presence
- 15.1.6 Recent Developments & Strategic Initiatives
Note: The company profile list is preliminary and may change based on research findings, market developments, data availability, and client requirements.
Chapter 16. Appendices
- Appendix A – List of Abbreviations & Acronyms
- Appendix B – Industry Classification Code Reference – Full Series
- Appendix C – Production & Capacity Data Tables
- Appendix D – End-Use & Demand Base Tables
- Appendix E – Consumption & Replacement Rate Assumptions
- Appendix F – ASP Reference Tables
- Appendix G – Manufacturing & Facility Database
- Appendix H – Import-Export Data Tables
- Appendix I – Regulatory Summary Tables
- Appendix J – Primary Research Participant List (Anonymized)
- Appendix K – Primary Research Questionnaire Framework
- Appendix L – Data Sources & Bibliography
- Appendix M – Market Size Divergence & Source Comparison
Chapter 17. Research Methodology
- 17.1 Research Framework & Philosophy
- 17.2 Secondary Research – Sources, Hierarchy & Data Extraction
- 17.3 Data Modeling – Bottom-Up & Top-Down Market Sizing
- 17.4 Primary Research – Stakeholder Framework, LOI & Sample Sizes
- 17.5 Forecast Methodology – Regression, Scenario & Sensitivity Analysis
- 17.6 Quality Control – Four-Layer Validation Framework
- 17.7 Limitations & Standard Assumptions
- 17.8 Disclaimer
