
Quick answer
A copper wire manufacturing plant draws purchased 8 mm rod into annealed bare or tinned wire for cable makers and electrical buyers. A greenfield unit of about 12,000 metric tons a year needs an estimated USD 6–11 million of CapEx, before metal inventory. Copper is about 97% of operating cost and passes through to buyers, so gross margin is thin at 1–4%, with a payback of about 2–8 years before metal financing.
Viable for operators with secured rod, cheap metal credit and qualified cable customers, but thin as a stand-alone commodity drawer.
Copper Wire plant: key highlights
| Parameter | Indicative value | Note |
|---|---|---|
| Plant capacity | About 12,000 metric tons per year | Rod breakdown, multiwire drawing and in-line annealing on purchased 8 mm rod, no melting |
| Total CapEx | USD 6–11 million | Greenfield, Asian or emerging-market site; excludes metal inventory; U.S. and EU sites usually higher |
| Raw material share of operating cost | 97–98% | Copper rod at LME-linked prices, net of scrap sold back |
| Gross margin | 1–4% | Thin as a percentage because metal passes through at about USD 14,000 per metric ton |
| Payback period | 2–8 years | At 85% utilization and mid-range CapEx, before tax and metal financing |
| IRR | Available in report | Post-tax, 10-year model |
| Break-even | Available in report | Capacity utilization basis |
Ranges assume a greenfield 12,000 metric ton a year drawing plant on purchased rod, an Asian or emerging-market industrial park (U.S./EU costs higher), 2026 prices, 85% utilization, LME copper near USD 14,100 per metric ton and assumed rod premiums, wire premiums, land and conversion costs. Rupees converted at an assumed 88 per USD. CapEx excludes metal inventory. Customizable to any country.
What is copper wire?
Copper wire is refined or alloyed copper drawn through a series of dies into a round or shaped section, then usually annealed so it can be bent and stranded without cracking. Buyers choose it for conductivity, which no affordable metal other than silver beats, and aluminum wins only where weight or metal cost matters more than conductor size.
Commercial forms include hard-drawn wire, soft annealed wire, tinned wire for corrosion and solderability, stranded bunches and fine wire for flexible cords. Most electrical grades start from electrolytic tough pitch rod, while oxygen-free rod serves more demanding magnet wire and electronics work.
The World Customs Organization's HS 2022 schedule places copper wire under heading 7408. Subheading 7408.11 covers refined copper above 6 mm in maximum cross-section, which is mostly rod, and 7408.19 covers finer refined wire, the main code for this plant. Insulated wire moves to heading 8544. Applications run from building wire and power cable to motor windings, vehicle harnesses, solar cable and data center power systems.
Copper wire market overview and global demand
Credence Research's nearest market measure is the global structural copper wire market, at about USD 21.7 billion in 2025, based on its estimate of USD 20.7 billion for 2024 and a 5.1% CAGR through 2032. That segment is only part of total drawn wire use, since most wire disappears into cables, windings and harnesses counted further downstream, including the low voltage wire and cable market.
Physical data show the scale behind it. A March 2026 market analysis put January to November 2025 apparent refined usage at 25.9 million metric tons, up 4%, with China at about 58%. The International Copper Study Group's October 2026 forecast expects usage growth of about 1.5% in 2026 and 2.5% in 2027, with surpluses of about 104,000 and 368,000 metric tons. Supply is not the barrier for a wire maker, but price is.
TrendEconomy trade statistics put 2023 world exports of finer refined copper wire under HS 7408.19 at about USD 3.85 billion, led by Turkey at USD 506 million and Germany at USD 360 million, followed by Uzbekistan, China, Malaysia and Indonesia.
Wire is costly to ship relative to its conversion value and buyers want short lead times, so plants tend to sit near cable and motor customers. Demand drivers are grid upgrades, building electrification, data centers and electric vehicles. Grid and data center buyers usually qualify suppliers slowly but stay for years, which matters more to a new entrant than headline growth.
Copper wire manufacturing process from rod to spool
The reference plant starts from purchased 8 mm rod rather than melting cathode. A rod line brings furnaces, gas supply, a heavier permit and far more capital, and it generally needs far larger volume, so independent drawers commonly buy rod from a mill.
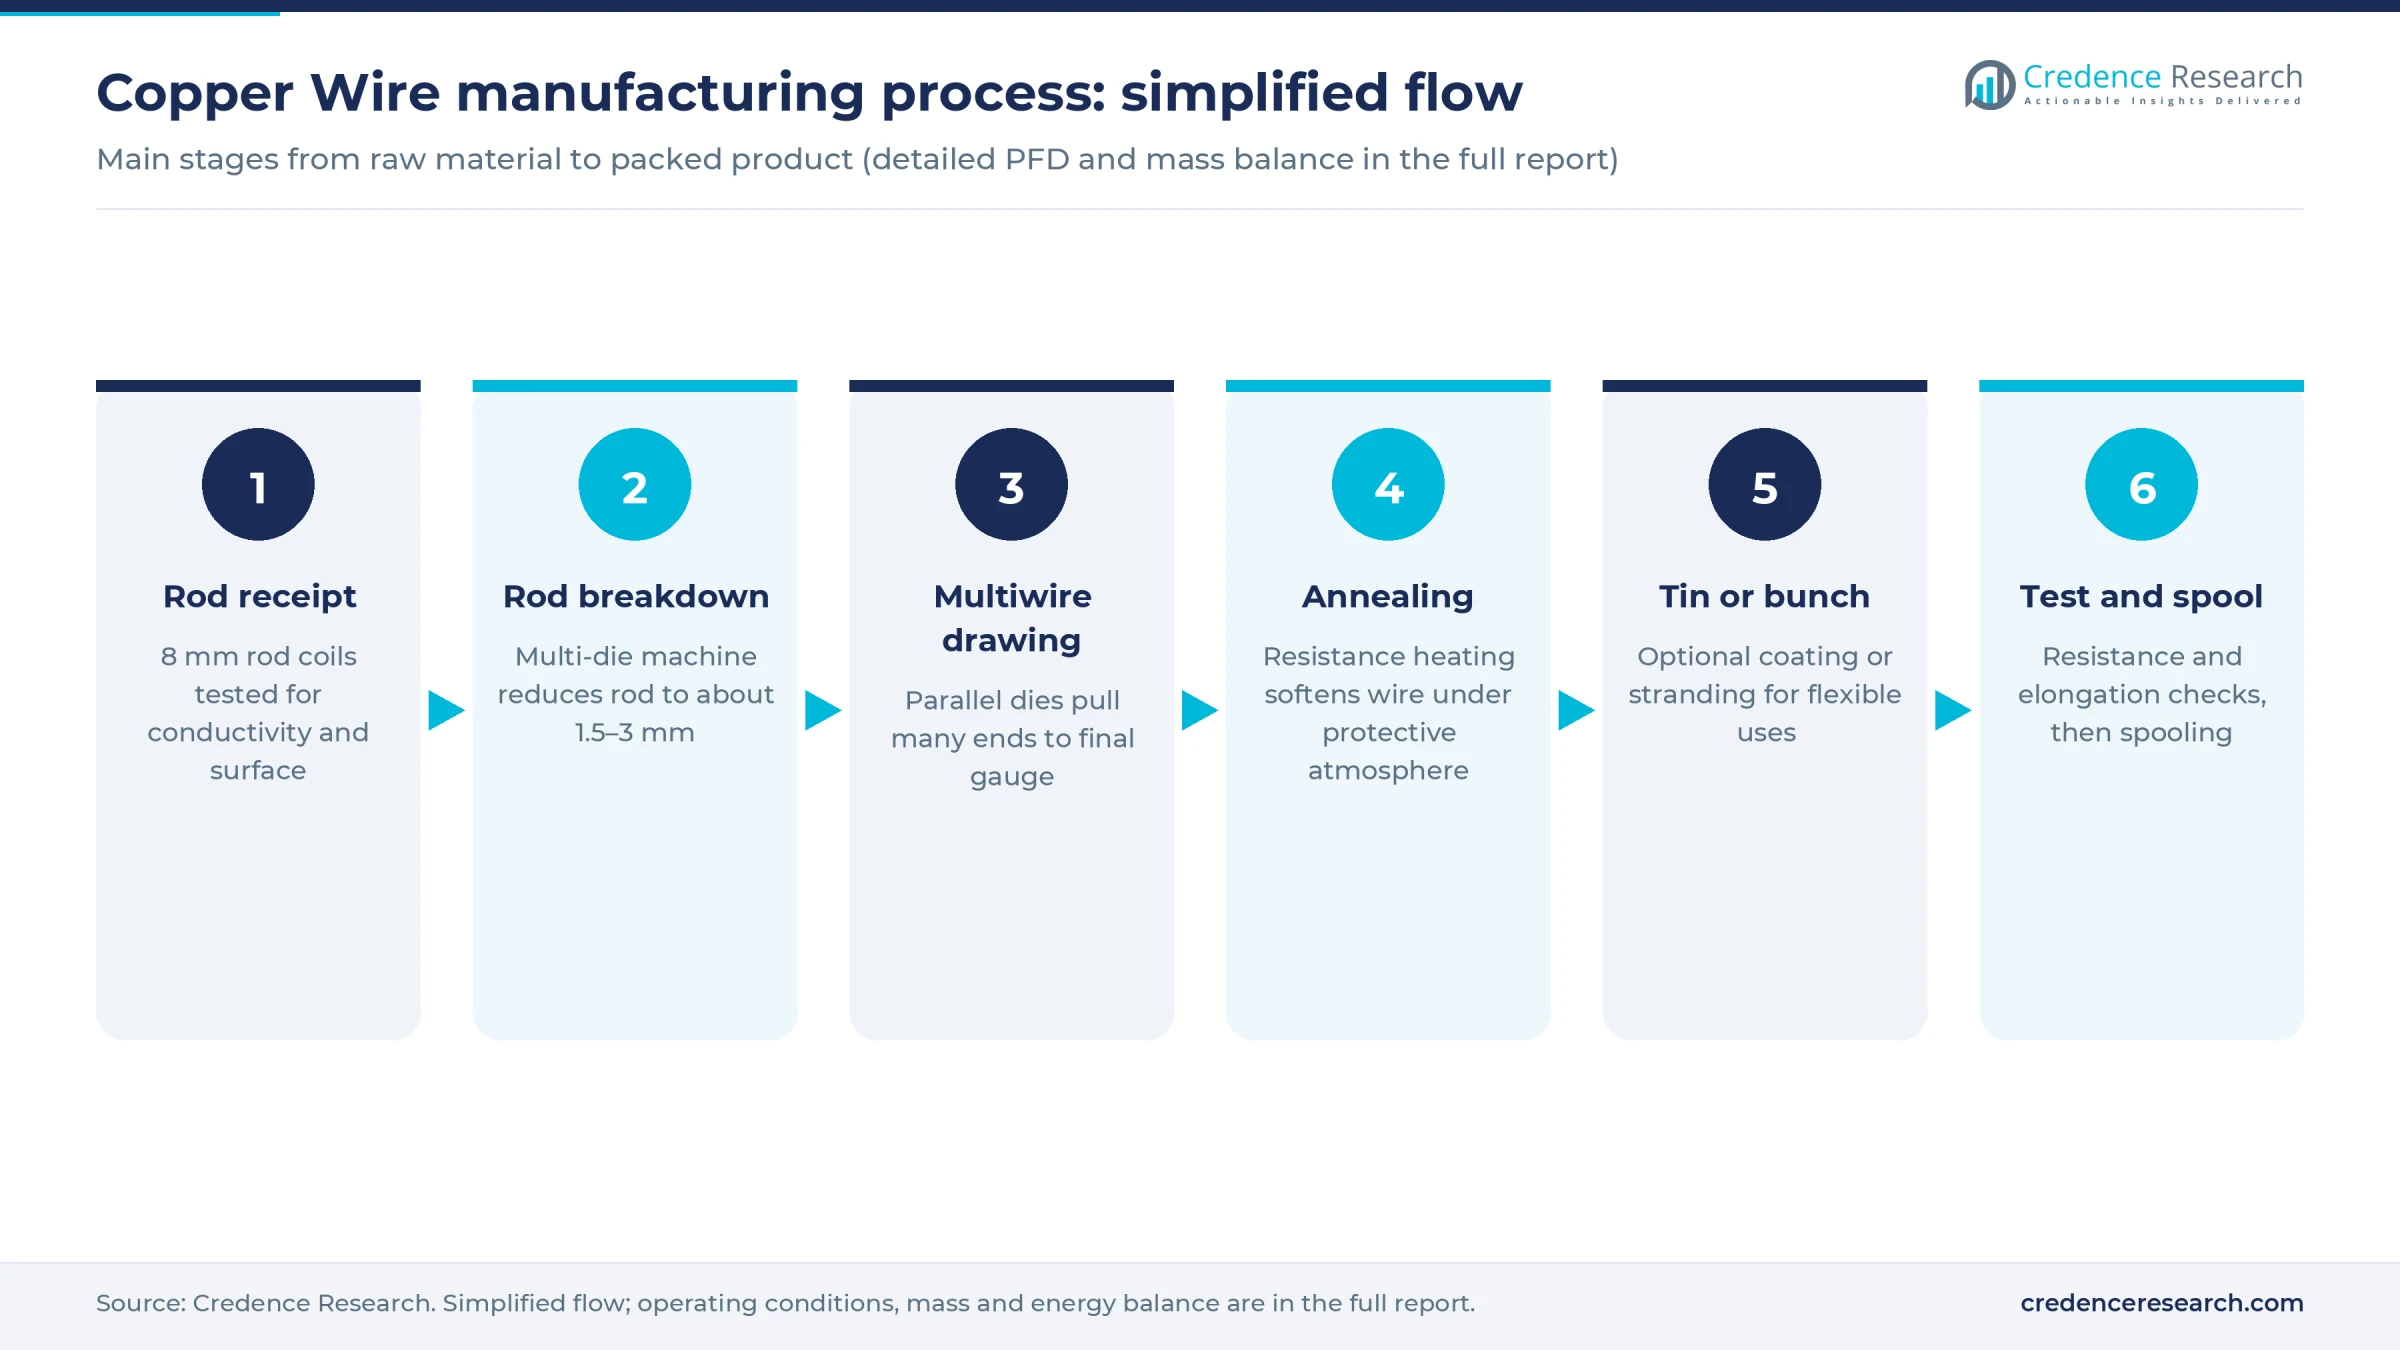
- Rod receipt and testing. Coils are checked for conductivity, surface oxide, oxygen content and twist performance. Subsurface defects that pass here show up later as wire breaks, so rod quality largely decides line uptime.
- Rod breakdown. A multi-die machine reduces rod from 8 mm to around 1.5–3 mm in a flood of water-soluble lubricant. Line speed depends on target diameter, and die wear is watched closely because it drives both tolerance and surface finish.
- Intermediate and multiwire drawing. Machines pull 8–32 wires at once through parallel die sets to the final gauge. Multiwire lines lift output per operator and per floor area, and they suit bunching customers who want many identical ends.
- In-line annealing. Electrical resistance heating under a protective steam or nitrogen atmosphere softens the wire and restores conductivity lost to work hardening. Poor control here causes oxidized surfaces and uneven elongation, a common cause of rejected spools.
- Tinning or bunching, if required. Hot-dip or electrolytic tinning adds a protective layer, and bunchers twist fine ends into flexible strands. Both add margin along with chemical handling, so many plants phase them in once base wire is qualified.
- Testing and spooling. Wire is wound on returnable spools or in drums, then tested for diameter, resistance, elongation and surface. Scrap and die fines are collected and sold back to refiners, because their copper value is too high to lose.
Lubricant filtration and copper fines recovery matter as much as the machines. Dirty emulsion scratches wire, shortens die life and creates the plant's main wastewater problem.
Copper wire plant setup cost
The reference plant draws about 12,000 metric tons a year of bare and annealed wire from purchased rod, with an optional small tinning line. Total CapEx at this scale is estimated at USD 6–11 million, covering land, buildings, machinery, utilities, preoperative cost and a non-metal working capital margin.
Public benchmarks are few and uneven, so the range is wide. An Indian exchange presentation from Sunlite Recycling in October 2024 describes about 60 million rupees for fine drawing machines, bunching and a factory shed, alongside a listed 1,560 metric tons a year of wire and conductor capacity, which implies about USD 440 per metric ton if the two are linked at an assumed 88 rupees. Precision Wires' 2025 winding wire expansion budgets 370 million rupees for 4,400 metric tons, about USD 960, and that includes enameling, which plain drawing does not need. Applying USD 500–900 per metric ton gives about USD 6–11 million.
Rod capacity is a different scale. Xinding Copper's 2026 rod project costs about USD 44 million for 220,000 metric tons, and Prysmian has discussed USD 100–200 million for a further Texas rod mill, so integration generally suits far larger volume, although smaller rod lines do exist.
For the land row, the plant needs about 3 acres, or 12,000 square meters. At an assumed USD 40–100 per square meter in an Asian industrial park, land costs about USD 0.5–1.2 million, close to 10% of mid-range CapEx. U.S. and European sites vary too widely for one figure, and the report can be customized to any country or region.
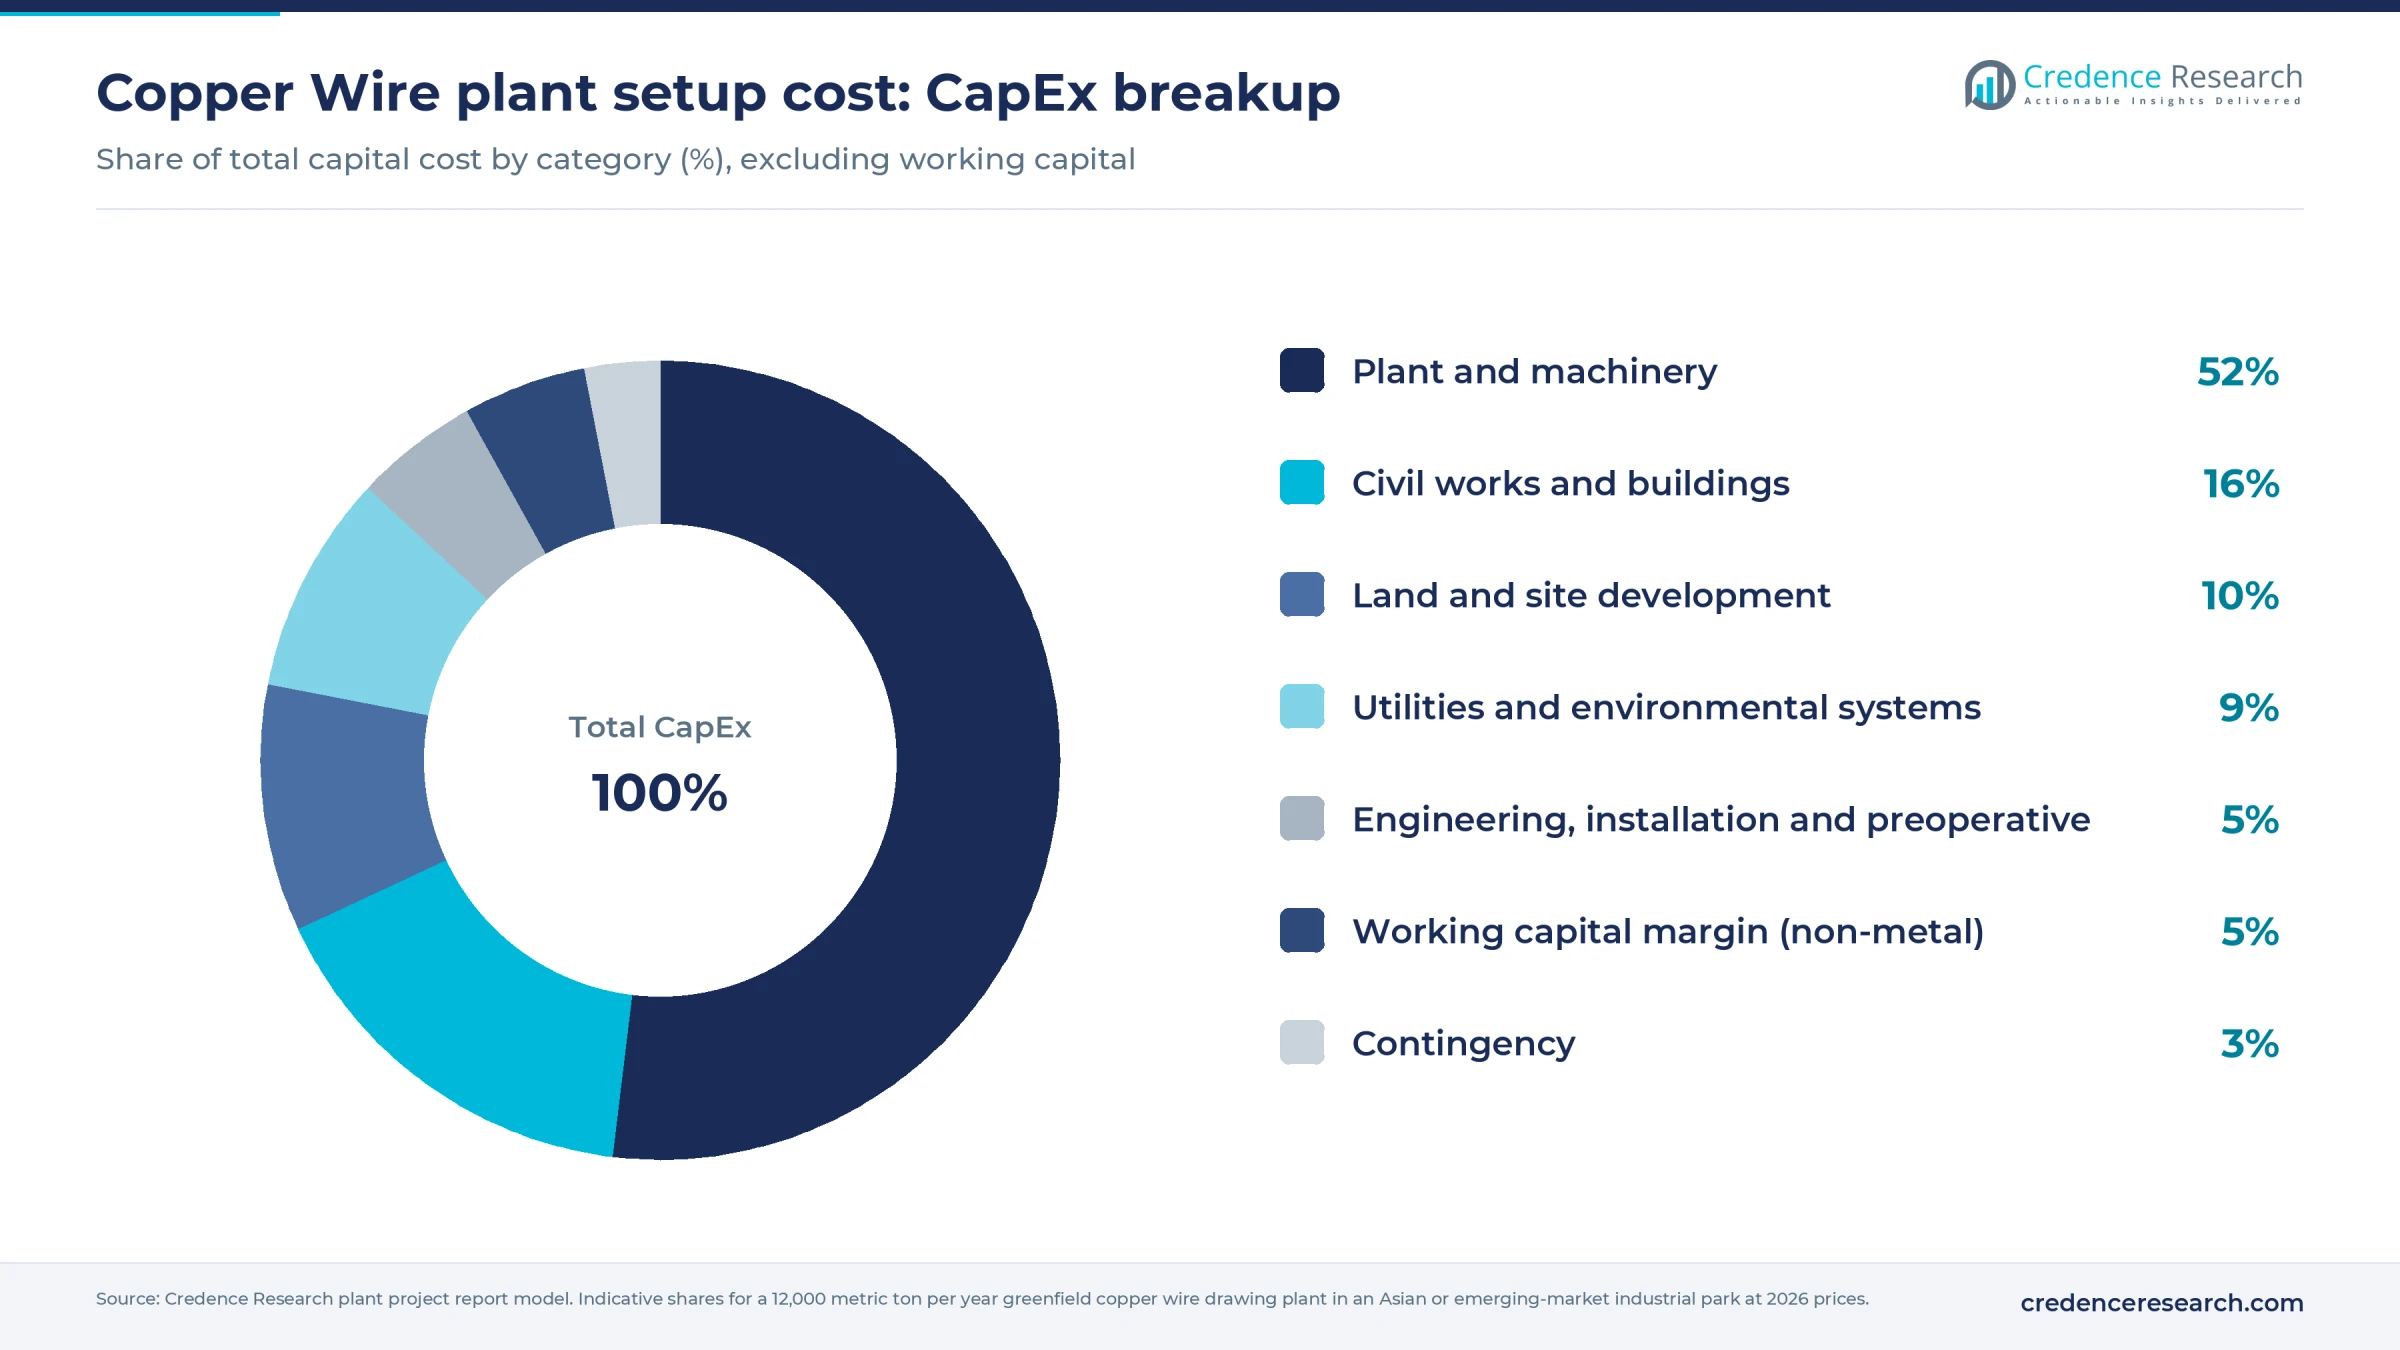
Machinery takes about 52% of CapEx, and European or Japanese lines can cost well above Chinese equivalents. The bigger cash need sits outside this chart: one month of rod at full rate is worth roughly USD 14.5 million, more than the plant itself.
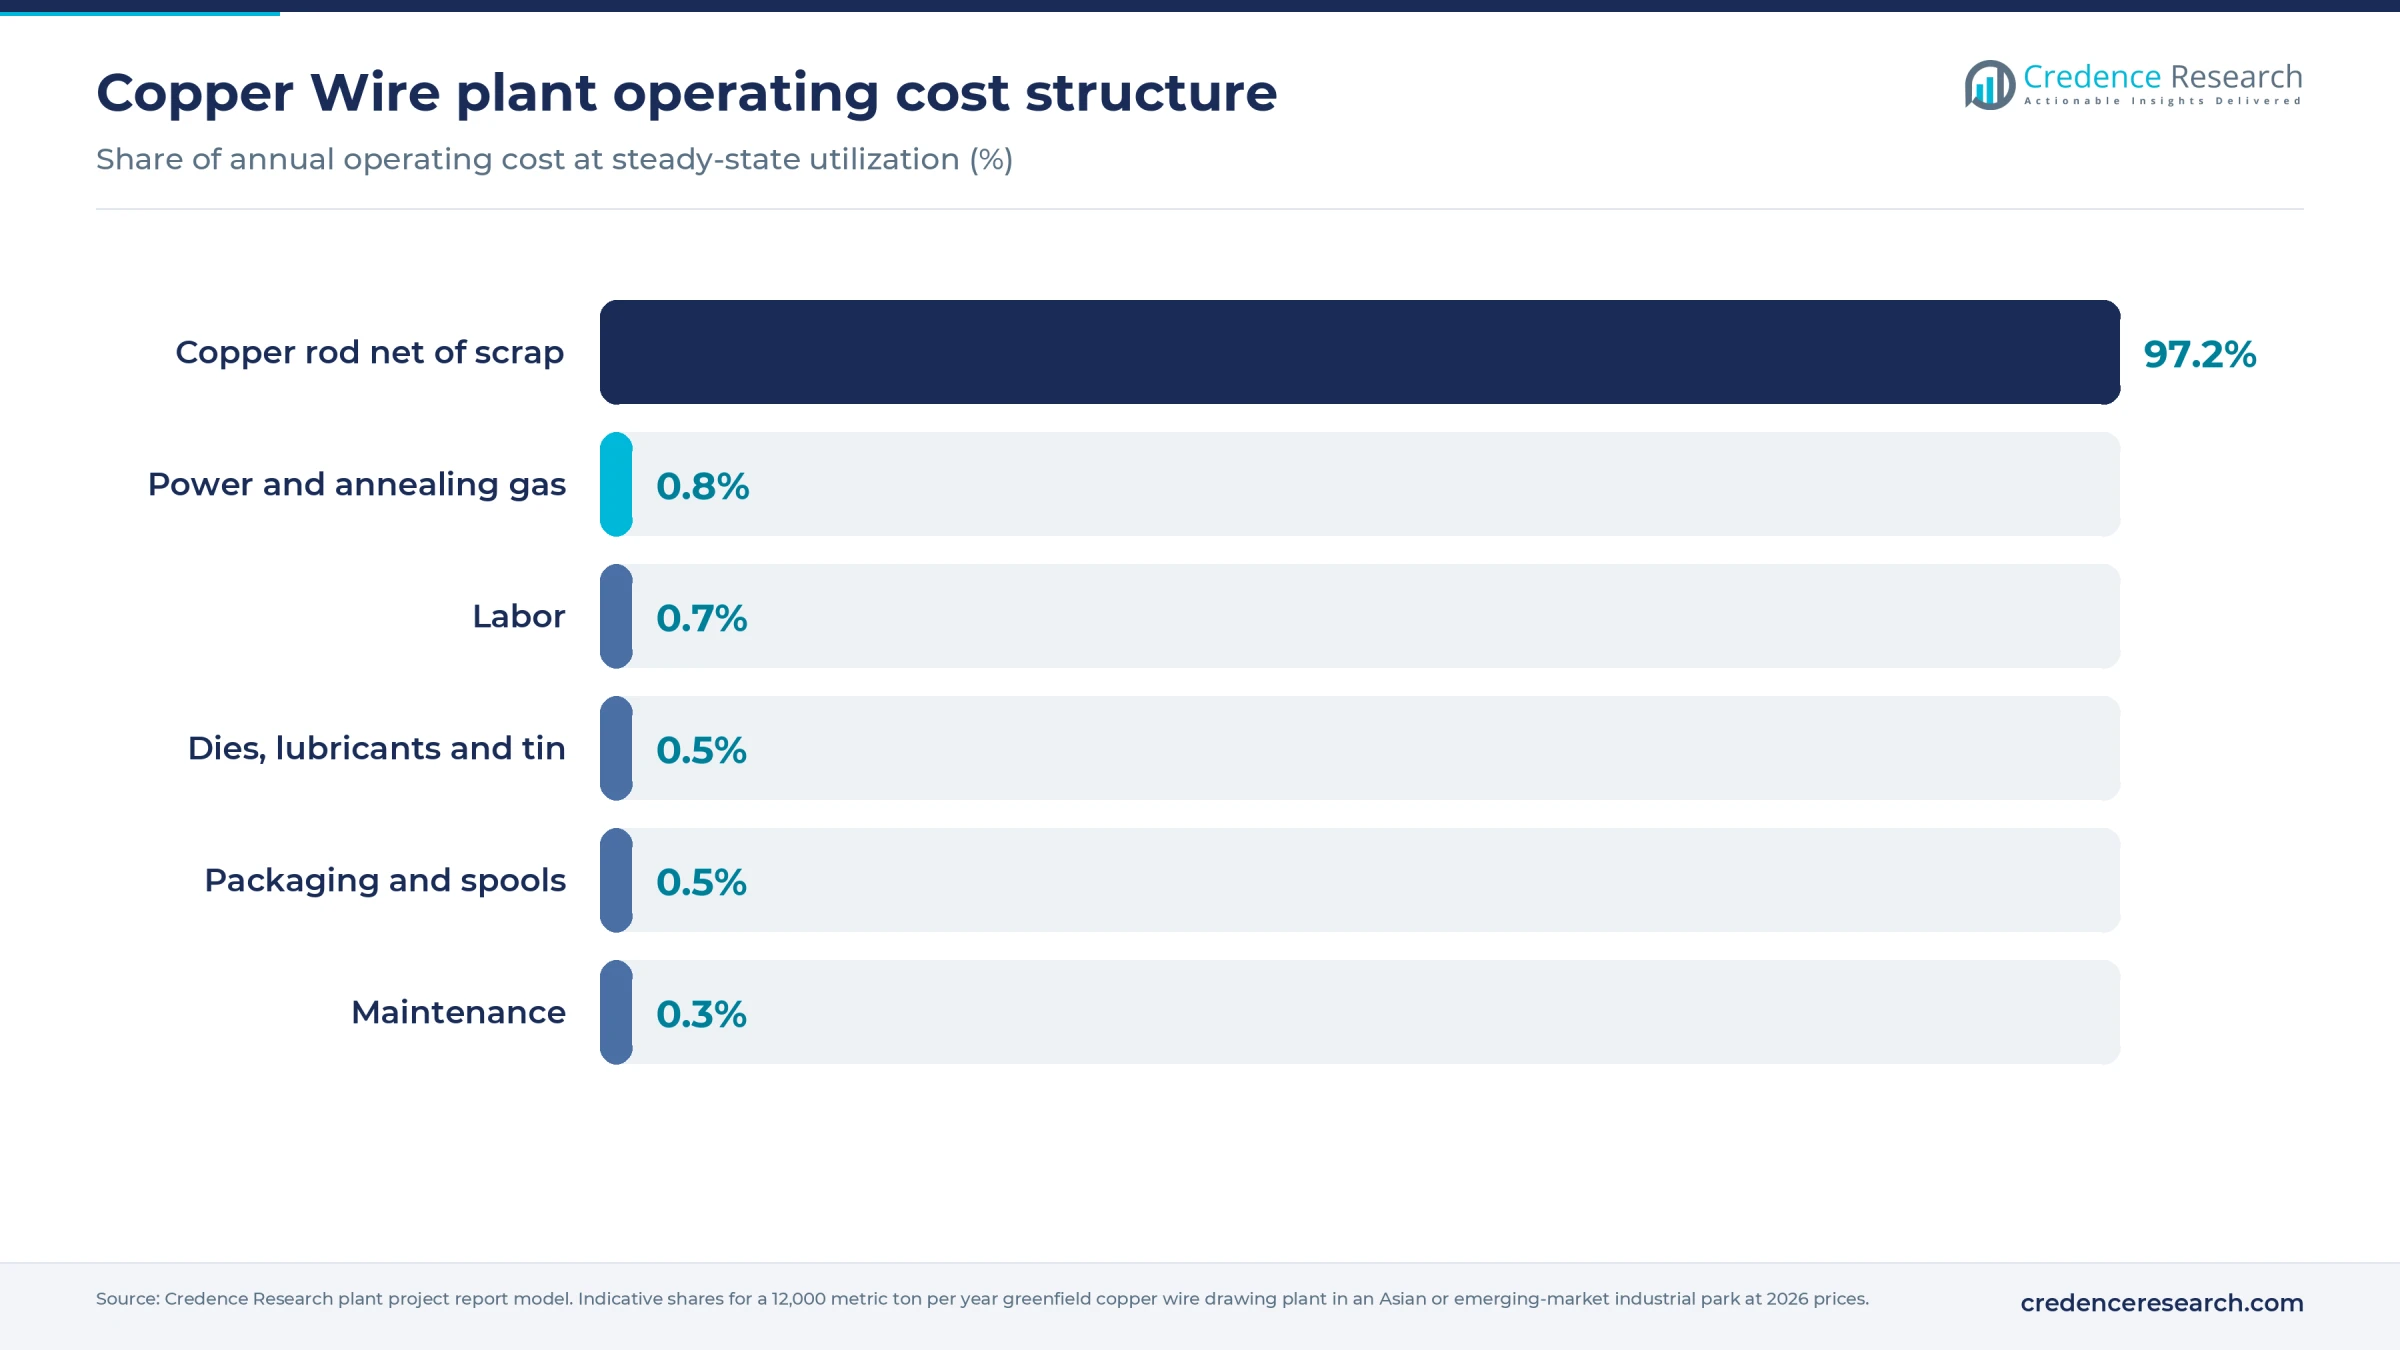
Rod accounts for about 97% of operating cost, so conversion items such as power, dies and labor are small in share but decide whether a plant earns its fee.
Machinery and raw materials for a copper wire plant
The main equipment groups are listed below. Machine counts, speeds and the full schedule are in the report.
- Rod pay-off and welding stations for continuous feed
- Rod breakdown machines with in-line annealers
- Intermediate and multiwire drawing machines
- Die shop with polishing and ultrasonic cleaning
- Emulsion tanks, filtration and cooling systems
- Spoolers, drum coilers and optional bunching machines
- Optional tinning line with fume extraction
- Resistance, elongation and diameter test equipment, compressors and substation
Copper rod comes from integrated mills attached to smelters and from independent rod plants in China, Europe, North America, India, Japan, South Korea and the Gulf. Upstream, USGS data show Chile mined about 5.3 million of about 23 million metric tons in 2025, while China and the Democratic Republic of Congo together made about 57% of refined metal in January to November 2025, based on a March 2026 market analysis.
Rod choice is partly a credit decision. A mill's payment terms can matter as much as its premium, because each extra week of credit frees about USD 3 million at this plant's scale. Plants should also compare recycled rod, where available, against customer specifications. Scrap and die fines go back to rod mills or copper scrap recyclers, which recovers most of the metal value lost in processing.
Copper wire business profit margin and ROI
At central rod and conversion cost, gross margin for the reference plant is estimated at 1–4%, measured as selling price minus rod and direct conversion. The full cost range widens that to about 0–5%. A low percentage is normal here, since metal value passes through and inflates sales.
The build starts from LME copper cash of USD 14,110.50 per metric ton on Nov. 3, 2026. Rod is assumed at LME plus USD 150–400, wire at LME plus USD 800–1,200, and conversion at USD 280–430, all per metric ton. No public series isolates fine wire premiums, so these remain assumptions.
At 85% utilization, or 10,200 metric tons, and after assumed overheads of USD 60 per metric ton, cash profit is about USD 1–5 million a year. Mid-range CapEx of USD 8.5 million then pays back in about 2–8 years before tax and metal financing. Holding one month of metal at an assumed 8% interest costs about USD 1 million a year, which could erase the low case entirely. A USD 100 change in the wire premium moves cash profit by about USD 1 million.
| Metric | Value |
|---|---|
| Gross margin | 1–4% |
| Payback period | 2–8 years |
| IRR (post-tax) | Available in report |
| NPV | Available in report |
| Return on investment | Available in report |
| DSCR | Available in report |
| Break-even utilization | Available in report |
How to start a copper wire business, licenses and approvals
The steps are similar across most countries: company and tax registration, land use and building permits, an environmental permit covering drawing emulsion wastewater, occupational safety and fire approvals, product certification, and import-export registration for rod and wire. Copper-bearing wastewater draws the closest attention from regulators, while tinning adds fume and chemical controls. A melting line would bring a much heavier permit.
Examples by market
| Market | Key approvals for a wire drawing plant |
|---|---|
| United States | EPA copper forming effluent rules at 40 CFR Part 468, covering drawing and related annealing; state or local discharge and air permits; ASTM B3 for soft wire is a common customer requirement |
| European Union | National environmental permit, typically moving under the Industrial Emissions Directive if a melting line exceeds 20 metric tons a day of non-ferrous metal; REACH duties on lubricants and tinning chemicals; EN 13602 for drawn electrical wire as a customer standard |
| India | Consent to establish and operate from the state pollution control board; BIS certification under the Copper Products quality control order notified in April 2024, which lists IS 4412 for general engineering wire and IS 12444 for electrical wire rod |
Cable and motor makers also audit a new supplier and test sample lots before approving it, and that step often takes longer than the permits.
Key copper wire manufacturers and recent developments
Large producers usually integrate rod and wire. Global names include Prysmian and its Encore Wire unit, Southwire and Cerrowire in the United States, Aurubis in Europe, Hindalco in India and Jiangxi Copper in China. Downstream specialists buy wire for medium voltage cables and many other assemblies.
- April 2026: Prysmian's Encore Wire unveiled a 340,800-square-foot copper building wire plant and an expanded service center in McKinney, Texas.
- August 2026: Diamond Power Infrastructure began commercial production of a copper conductor cable line of 1,500 metric tons a month in Gujarat, India, with wire drawn in-house from rod.
- August 2026: Xinding Copper Source broke ground on a 220,000 metric ton a year low-oxygen rod line in Qinghai, China, costing RMB 300 million.
These additions lean toward integrated groups securing their own conductor, which can narrow the open market for independent drawers and favors specialty sizes, short lead times or tinned grades.
What's inside the Copper Wire project report PDF
The report runs to 21 chapters. Open a chapter to see its sections.
1. Preface
2. Scope and Methodology
- 2.1 Objectives of the Study
- 2.2 Stakeholders
- 2.3 Research Methodology
- 2.4 Data Sources and Key Assumptions
3. Executive Summary
- 3.1 Market Snapshot
- 3.2 Project at a Glance (Capacity, CapEx, OpEx)
- 3.3 Key Financial Indicators (IRR, NPV, Payback, Break-even)
- 3.4 Feasibility Verdict
4. Product Overview
- 4.1 Copper Wire Definition and Properties
- 4.2 Grades and Specifications (BIS / ISO / ASTM)
- 4.3 HS Code and Classification
- 4.4 Key Applications
- 4.5 Substitutes
5. Global Copper Wire Market
- 5.1 Market Overview
- 5.2 Historical and Current Market Performance (Volume and Value)
- 5.3 Market Breakup by Grade / Type
- 5.4 Market Breakup by End-Use Industry
- 5.5 Market Breakup by Region
- 5.6 Market Drivers, Restraints and Trends
- 5.7 Value Chain Analysis
- 5.8 Market Forecast
6. Target Country Copper Wire Market Analysis
- 6.1 Demand and Supply Analysis
- 6.2 Installed Capacity vs Demand Gap
- 6.3 Import Dependence
- 6.4 Demand Forecast by End-Use
7. Trade Analysis
- 7.1 Imports by Volume, Value and Country
- 7.2 Exports by Volume, Value and Country
- 7.3 Trade Balance and Opportunities
8. Price Analysis
- 8.1 Historical Copper Wire Price Trends by Region
- 8.2 Raw Material / Feedstock Price Trends and Linkage
- 8.3 Price Forecast
- 8.4 Margins Across the Value Chain
9. Competitive Landscape
- 9.1 Market Structure
- 9.2 Key Players and Installed Capacities
- 9.3 Profiles of Key Players
- 9.4 Recent Developments (Expansions, M&A, New Plants)
10. Manufacturing Process and Technology
- 10.1 Comparison of Technology Routes
- 10.2 Selected Route and Process Flow Diagram
- 10.3 Unit Operations Involved
- 10.4 Chemical Reactions Involved
- 10.5 Mass Balance and Raw Material Requirements
- 10.6 Energy Balance
- 10.7 Quality Assurance Criteria and Technical Tests
- 10.8 By-products and Waste Handling
- 10.9 Technology Licensors / Providers
11. Project Details, Requirements and Costs
- 11.1 Land, Location and Site Development
- 11.1.1 Site Selection Criteria
- 11.1.2 Location Analysis
- 11.1.3 Land Requirement and Costs
- 11.1.4 Site Development Costs
- 11.2 Plant Layout
- 11.2.1 Layout Principles
- 11.2.2 Proposed Layout
- 11.2.3 Factors Influencing Layout
- 11.3 Civil Works and Buildings
- 11.4 Plant Machinery
- 11.4.1 Machinery Requirements and Specifications
- 11.4.2 Machinery Costs
- 11.4.3 Machinery Suppliers
- 11.5 Raw Materials
- 11.5.1 Requirements per Tonne of Output
- 11.5.2 Procurement and Sourcing
- 11.5.3 Costs
- 11.5.4 Suppliers
- 11.6 Packaging
- 11.6.1 Packaging Requirements
- 11.6.2 Packaging Costs
- 11.6.3 Packaging Suppliers
- 11.7 Storage and Material Handling
- 11.8 Transportation Requirements and Costs
- 11.9 Utilities
- 11.9.1 Power Requirements and Costs
- 11.9.2 Water Requirements and Costs
- 11.9.3 Steam, Fuel and Other Utilities
- 11.10 Manpower Requirements and Wages
12. Environment, Health, Safety and Sustainability
- 12.1 Effluent and Emissions Management
- 12.2 Hazard Classification and Safety Measures
- 12.3 Carbon Footprint
- 12.4 Green / Low-Carbon Process Options
13. Regulatory Procedures, Approvals and Certifications
- 13.1 Licences and Registrations
- 13.2 Environmental Clearances
- 13.3 Product Certifications (BIS, REACH, etc.)
- 13.4 Approval Timeline
14. Project Implementation Schedule
15. Project Economics
- 15.1 Capital Cost of the Project
- 15.2 Techno-Economic Parameters
- 15.3 Capacity Utilization and Ramp-up
- 15.4 Product Pricing and Margins
- 15.5 Income Projections
- 15.6 Expenditure Projections
- 15.7 Working Capital Requirement
- 15.8 Taxation
- 15.9 Depreciation
16. Financial Analysis
- 16.1 Projected Profit and Loss Account
- 16.2 Projected Cash Flow Statement
- 16.3 Projected Balance Sheet
- 16.4 Liquidity Analysis
- 16.5 Profitability Analysis (Payback, NPV, IRR, ROI)
- 16.6 Break-even Analysis
- 16.7 Debt Service Coverage Ratio (DSCR)
- 16.8 Sensitivity Analysis
- 16.9 Scenario and Uncertainty Analysis
17. Funding and Incentives
- 17.1 Means of Finance and Debt-Equity Structure
- 17.2 Loans and Financial Assistance
- 17.3 Government Schemes and Subsidies (PLI, State Policies)
18. Risk Assessment
- 18.1 Key Success Factors
- 18.2 Key Risk Factors
- 18.3 Risk Mitigation
19. Strategic Recommendations
20. Case Study of a Successful Venture
21. Appendix
- 21.1 Detailed Assumptions
- 21.2 Abbreviations
- 21.3 List of Tables and Figures
- 21.4 Sources
This page vs. the full report
| Data point | On this page (free) | In the full report |
|---|---|---|
| Total CapEx | One rounded range at one capacity | Exact figure at three capacities with a line-item breakup |
| CapEx breakup | Category shares (%) only | Cost, quantity and supplier for every machine |
| Operating cost | Share of raw materials, utilities and labor | Per-unit cost sheet with each input price and consumption |
| Profitability | Gross margin range and payback band | Exact IRR, NPV, ROI, break-even and DSCR |
| Financial statements | List of what is included | 10-year P&L, cash flow, balance sheet and Excel model |
| Sensitivity | One directional line | Full sensitivity and scenario tables |
| Process | Simplified flow diagram | Detailed process flow, mass and energy balance, operating conditions |
| Machinery | Names of the main machines | Specifications, capacity, cost and supplier list |
| Market | Headline size, growth and India demand trend | Segment, region, trade and price forecast tables |
| Suppliers and buyers | Supplier types and sourcing hubs | Named suppliers and buyers |
Copper Wire project report: FAQs
How much does it cost to set up a copper wire manufacturing plant?
Should a new copper wire plant build its own rod mill?
What is the profit margin in copper wire manufacturing?
What is the payback period for a copper wire plant?
Which approvals does a copper wire plant need?
Where do wire makers source copper rod?
Why does metal financing matter so much for a copper wire plant?

About the analyst
Nisha Gupta, Senior Research Analyst
Nisha Gupta is a Senior Research Analyst at Credence Research Inc. who works across industry domains, including packaging, automotive parts and machinery. Her focus is the modelling engine behind each study: she builds quantitative market databases and econometric forecasting frameworks, and developed automated Excel-based market modelling templates that cut client turnaround time by 30%.
Related market research
- Structural Copper Wire Market Size, Growth and Forecast 2032
- Low Voltage Wire and Cable Market Size, Share and Forecast 2032
- Medium Voltage Wire and Cable Market Size, Share and Forecast 2032
- Copper and Copper Alloy Scrap and Recycling Market Size, Share and Forecast 2032
- Wire and Cable Polymer Market Size, Growth and Forecast 2032
- Automotive Wire and Cable Materials Market Size and Forecast 2032
More plant project reports
- Cigarette Lighter Manufacturing Plant Project Report (DPR) 2026
- Bread Manufacturing Plant Project Report (DPR) 2026
- Chocolate Manufacturing Plant Project Report (DPR) 2026
- Biofertilizer Manufacturing Plant Project Report (DPR) 2026
- Cheese Manufacturing Plant Project Report (DPR) 2026
- Aluminum Foil Manufacturing Plant Project Report (DPR) 2026