
Quick answer
A cheese plant coagulates pasteurized milk, drains the whey, then presses, salts and ripens the curd. This overview models a greenfield plant making 10,000 tonnes a year, with estimated CapEx of USD 25–60 million by region and build standard. Gross margin is estimated at 10–20% on an assumed value-added product mix, with payback at 6–12 years. Plain commodity blocks at mid-2026 prices leave little or no margin.
Viable for processors with secure milk, a use for whey and a retail, foodservice or specialty mix; a new plant selling only commodity blocks at mid-2026 prices would struggle to cover its modeled costs.
Cheese plant: key highlights
| Parameter | Indicative value | Note |
|---|---|---|
| Plant capacity | 10,000 tonnes of cheese per year | About 33 tonnes a day over 300 operating days, using about 100,000 tonnes of milk a year at full capacity |
| Total CapEx | USD 25–60 million | Greenfield, scaled from disclosed plants; excludes working capital. Disclosed Swedish and U.S. projects run about USD 110–200 million on a 10,000-tonne basis |
| Raw material share of operating cost | 75–82% | Modeled at about 10 kg of milk per kg of cheese |
| Gross margin | 10–20% | At an assumed USD 4.4–6.0 per kg blended price and assumed USD 0.34–0.45 per kg delivered milk |
| Payback period | 6–12 years | At 80% utilization, including an assumed one-year ramp-up; weak price and high-CapEx pairings fall outside this band |
| IRR | Available in report | Post-tax, 10-year model |
| Break-even | Available in report | Capacity utilization basis |
Ranges assume a 10,000 tonnes-per-year greenfield plant, 300 operating days, 80% utilization and 2026 prices. The blended price of USD 4.4–6.0 per kg, delivered milk at USD 0.34–0.45 per kg, whey credits and land rates are assumed. Conversions use an assumed USD 1.15 per euro. CapEx is scaled from disclosed plants and excludes working capital. The full report can be customized to any country or region.
What is cheese?
Cheese is a concentrated dairy food made by coagulating milk protein with rennet, acid or both, draining off the liquid whey and, for many types, pressing, salting and ripening the curd. About 10 kg of milk goes into each kilogram of hard cheese, so a plant is in effect a milk concentration business with a long inventory tail.
Types are usually grouped by moisture and method. Fresh varieties such as cottage cheese and paneer sell within weeks. Pasta filata types such as mozzarella are stretched in hot water and dominate pizza supply. Semi-hard and hard types, including gouda, cheddar and emmental, ripen for weeks to years. Processed cheese is a separate step, in which natural cheese is melted with emulsifying salts.
The Harmonized System places cheese under heading 04.06. Subheading 0406.10 covers fresh cheese and curd, 0406.20 grated or powdered, 0406.30 processed, 0406.40 blue-veined and 0406.90 other cheese, which is where most ripened types sit. Buyers are grocery chains, pizza and foodservice operators, and food manufacturers. Higher-priced lines are tracked in Credence Research's specialty varieties study.
Cheese market overview and global demand
Credence Research values the global market for cheese at USD 215.5 billion in 2025 and expects USD 315.6 billion by 2032, a 5.6% CAGR. Household use, foodservice and convenient formats drive that growth.
Production is concentrated in two places. The USDA's July 2026 dairy circular forecasts EU production of about 11.1 million tonnes in 2026, as processors move milk away from butter and milk powder, and U.S. output of about 6.8 million tonnes. The countries it tracks produce about 23.5 million tonnes combined, so those two supply roughly three-quarters of that total. Russia and Brazil follow at a much smaller scale.
Only about one-seventh of tracked output leaves its home country or trade bloc. The same circular forecasts tracked exports near 3.6 million tonnes, led by the EU at about 1.5 million, the U.S. at about 750,000 and New Zealand at 425,000. The U.S. is the fast mover, with exports reaching a record 613,045 tonnes in 2025, up 20%, according to the U.S. Dairy Export Council, which named Mexico as the top buyer. EU sellers look to Japan, Saudi Arabia and Egypt, while the U.K. and Japan are large importers.
That supply growth has a cost. EU wholesale prices fell 14–28% in the year to late August 2026, depending on variety, and U.S. expansions are still ramping up. A new entrant is therefore arriving in a well-supplied market, which favors regional import substitution, specialty formats and contracts over open-market commodity sales.
Cheese manufacturing process
The basic chemistry is old, but a modern plant is a tightly timed hygienic operation in which a small change in yield moves profit. The steps below describe a semi-hard or hard line.
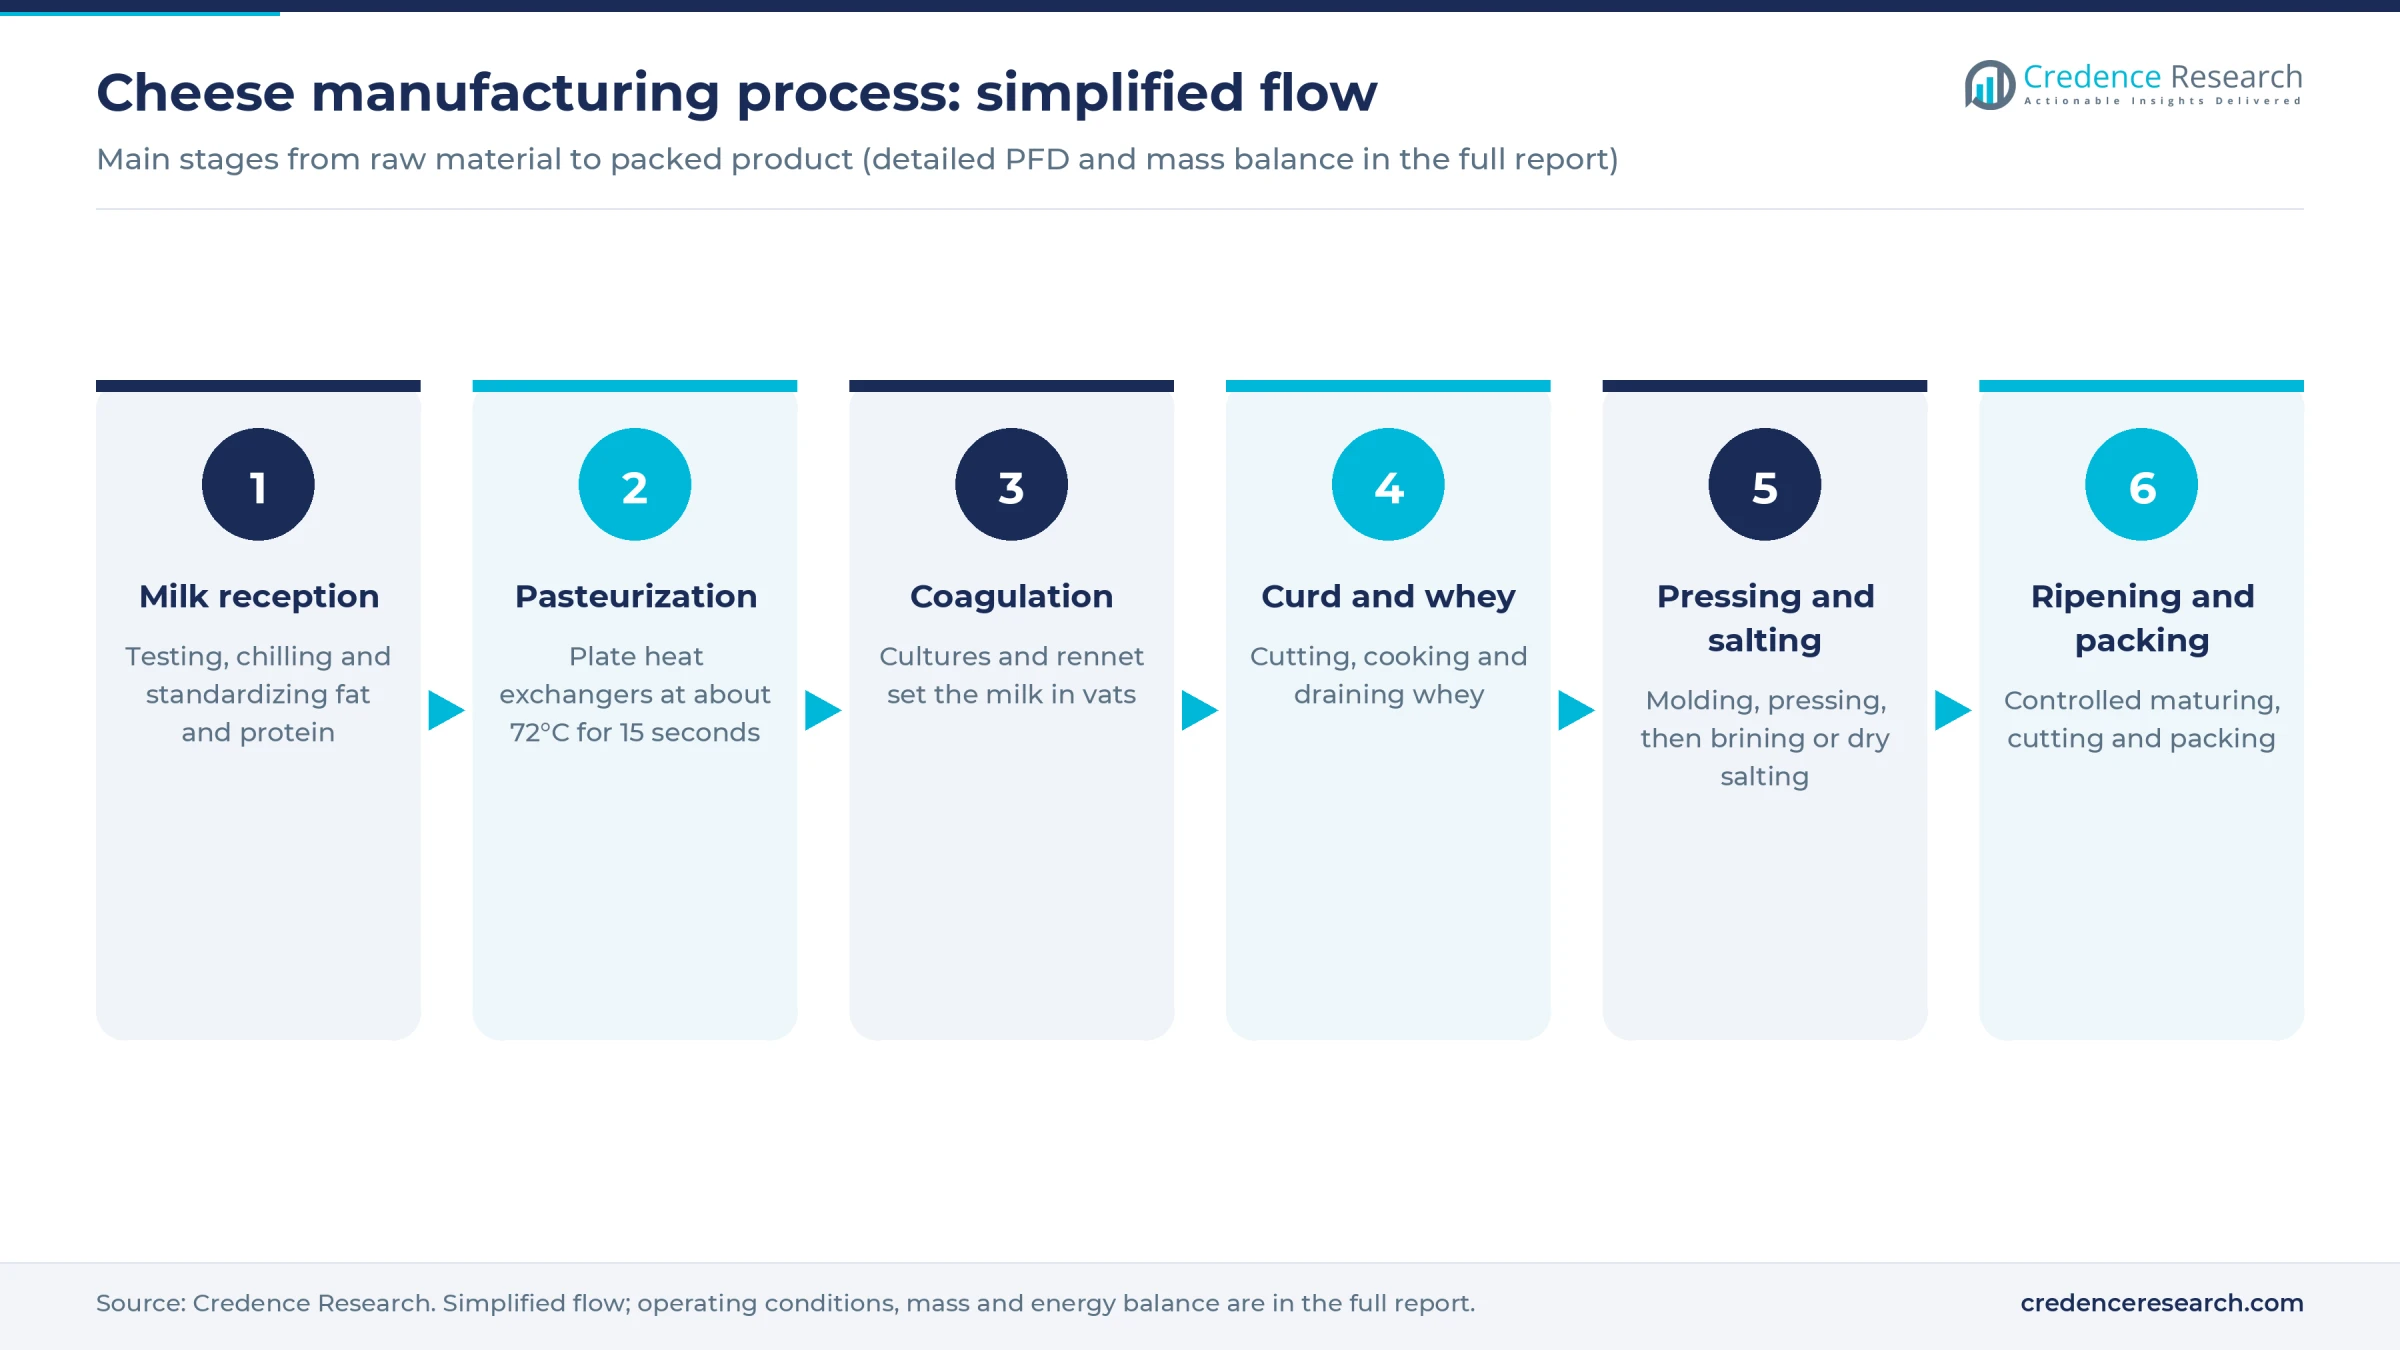
- Milk reception and standardization. Tankers are tested for antibiotics and quality, and milk is chilled, clarified and adjusted to the target fat-to-protein ratio. Membrane filtration can raise solids and output per vat.
- Pasteurization. Plate heat exchangers typically hold milk at about 72°C for 15 seconds. Raw-milk cheese is possible in some markets, but the U.S. requires at least 60 days of aging for it, and pathogen risk remains.
- Coagulation. Starter cultures acidify the milk and rennet sets it into a gel within enclosed vats. Culture choice shapes flavor, texture and resistance to phage attack, one of the costliest failures in the plant.
- Cutting, cooking and whey drainage. The gel is cut into curd particles and gently heated to expel whey. Fine losses here go straight to the effluent and reduce yield.
- Forming, pressing and salting. Curd is molded and pressed, then brined or dry-salted. Mozzarella takes a different route, passing through a hot stretcher and being chilled in brine.
- Ripening, cutting and packing. Blocks mature in humidity-controlled rooms or in vacuum film, then go to cutting lines, with metal detection and listeria monitoring in the packing zone.
Yield and whey drive the economics. A 1998 USDA-backed plant cost study recorded 10.3 pounds of cheese per 100 pounds of milk, about 9.7 kg of milk per kg, and Lactalis' new prato line in Brazil implies about 10 liters. Each kilogram of cheese also leaves about 9 kg of whey, which is either a saleable ingredient stream or a treatment burden. Larger plants concentrate and dry it, as tracked in Credence Research's dairy ingredients analysis, while smaller ones often sell liquid or concentrated whey to a neighbor.
Cheese plant setup cost
This overview models a greenfield natural cheese plant making 10,000 tonnes a year, about 33 tonnes a day, at an estimated total CapEx of USD 25–60 million. Disclosed benchmarks were scaled with an assumed 0.7 power rule and converted at an assumed USD 1.15 per euro.
The low end starts with the Britannia and Bel venture in India, reported at USD 26.1 million for 6,000 tons of natural and 10,000 tons of processed cheese. Scaled and escalated, that is about USD 20 million, with an assumed USD 5 million added for stand-alone milk intake and effluent treatment. The upper end comes from Brazil. Queijaria Unium was reported at EUR 84.5 million for up to 3,000 tonnes a month, including whey powder, which scales to about USD 44–60 million depending on whether output or milk intake is used. Lactalis' Uberlandia project, at EUR 47 million for 12,000 tonnes a year plus a butter expansion, gives a similar upper figure.
Higher-specification projects sit well outside this range. Arla's EUR 300 million plan to add about 500,000 tonnes of annual milk intake in Sweden scales to about USD 110 million, and Bel is spending USD 200 million on 10,000 more tons of portion snack cheese at an existing U.S. plant.
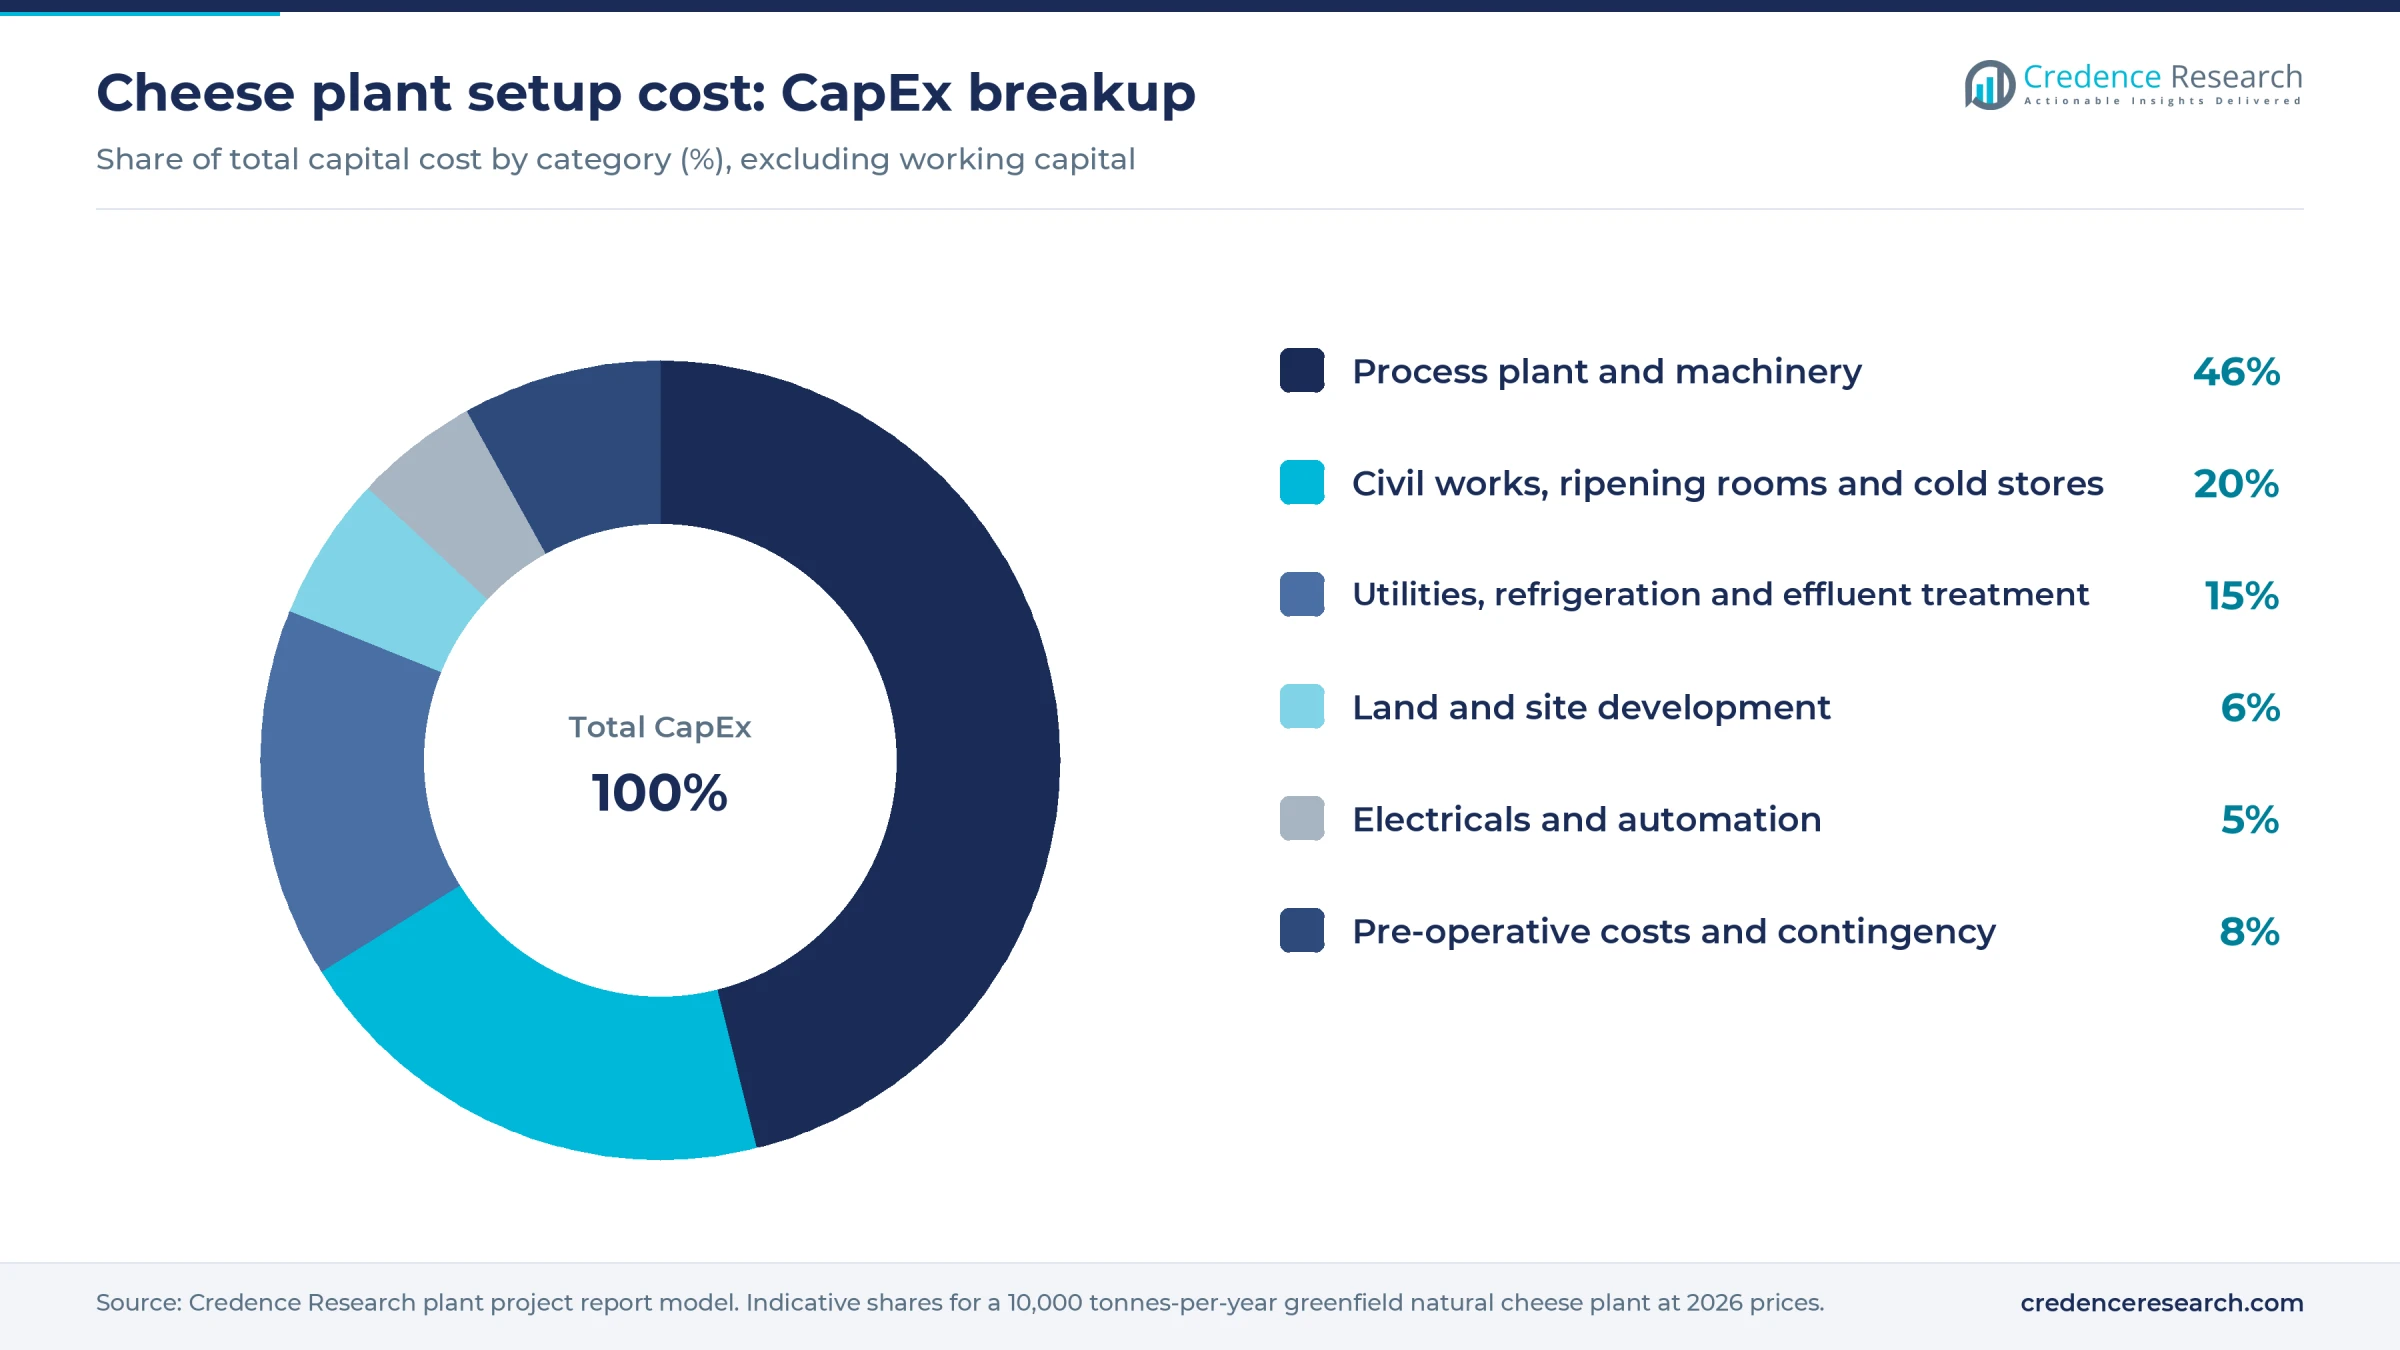
Worked example, land and site development. The plant needs an assumed 30,000–50,000 square meters, including milk intake, ripening stores and effluent treatment. At an assumed USD 20–50 per square meter in an Asian industrial park, the plot costs about USD 0.6–2.5 million. At an assumed USD 30–80 at a U.S. or EU site, it costs about USD 0.9–4 million. Site works add an assumed USD 0.4–1 million, so this row usually runs 4–8% of CapEx.
Working capital adds an estimated USD 6–10 million, because ripening cheese ties up cash for months and farmers are paid quickly. Longer-aged varieties need more than that.
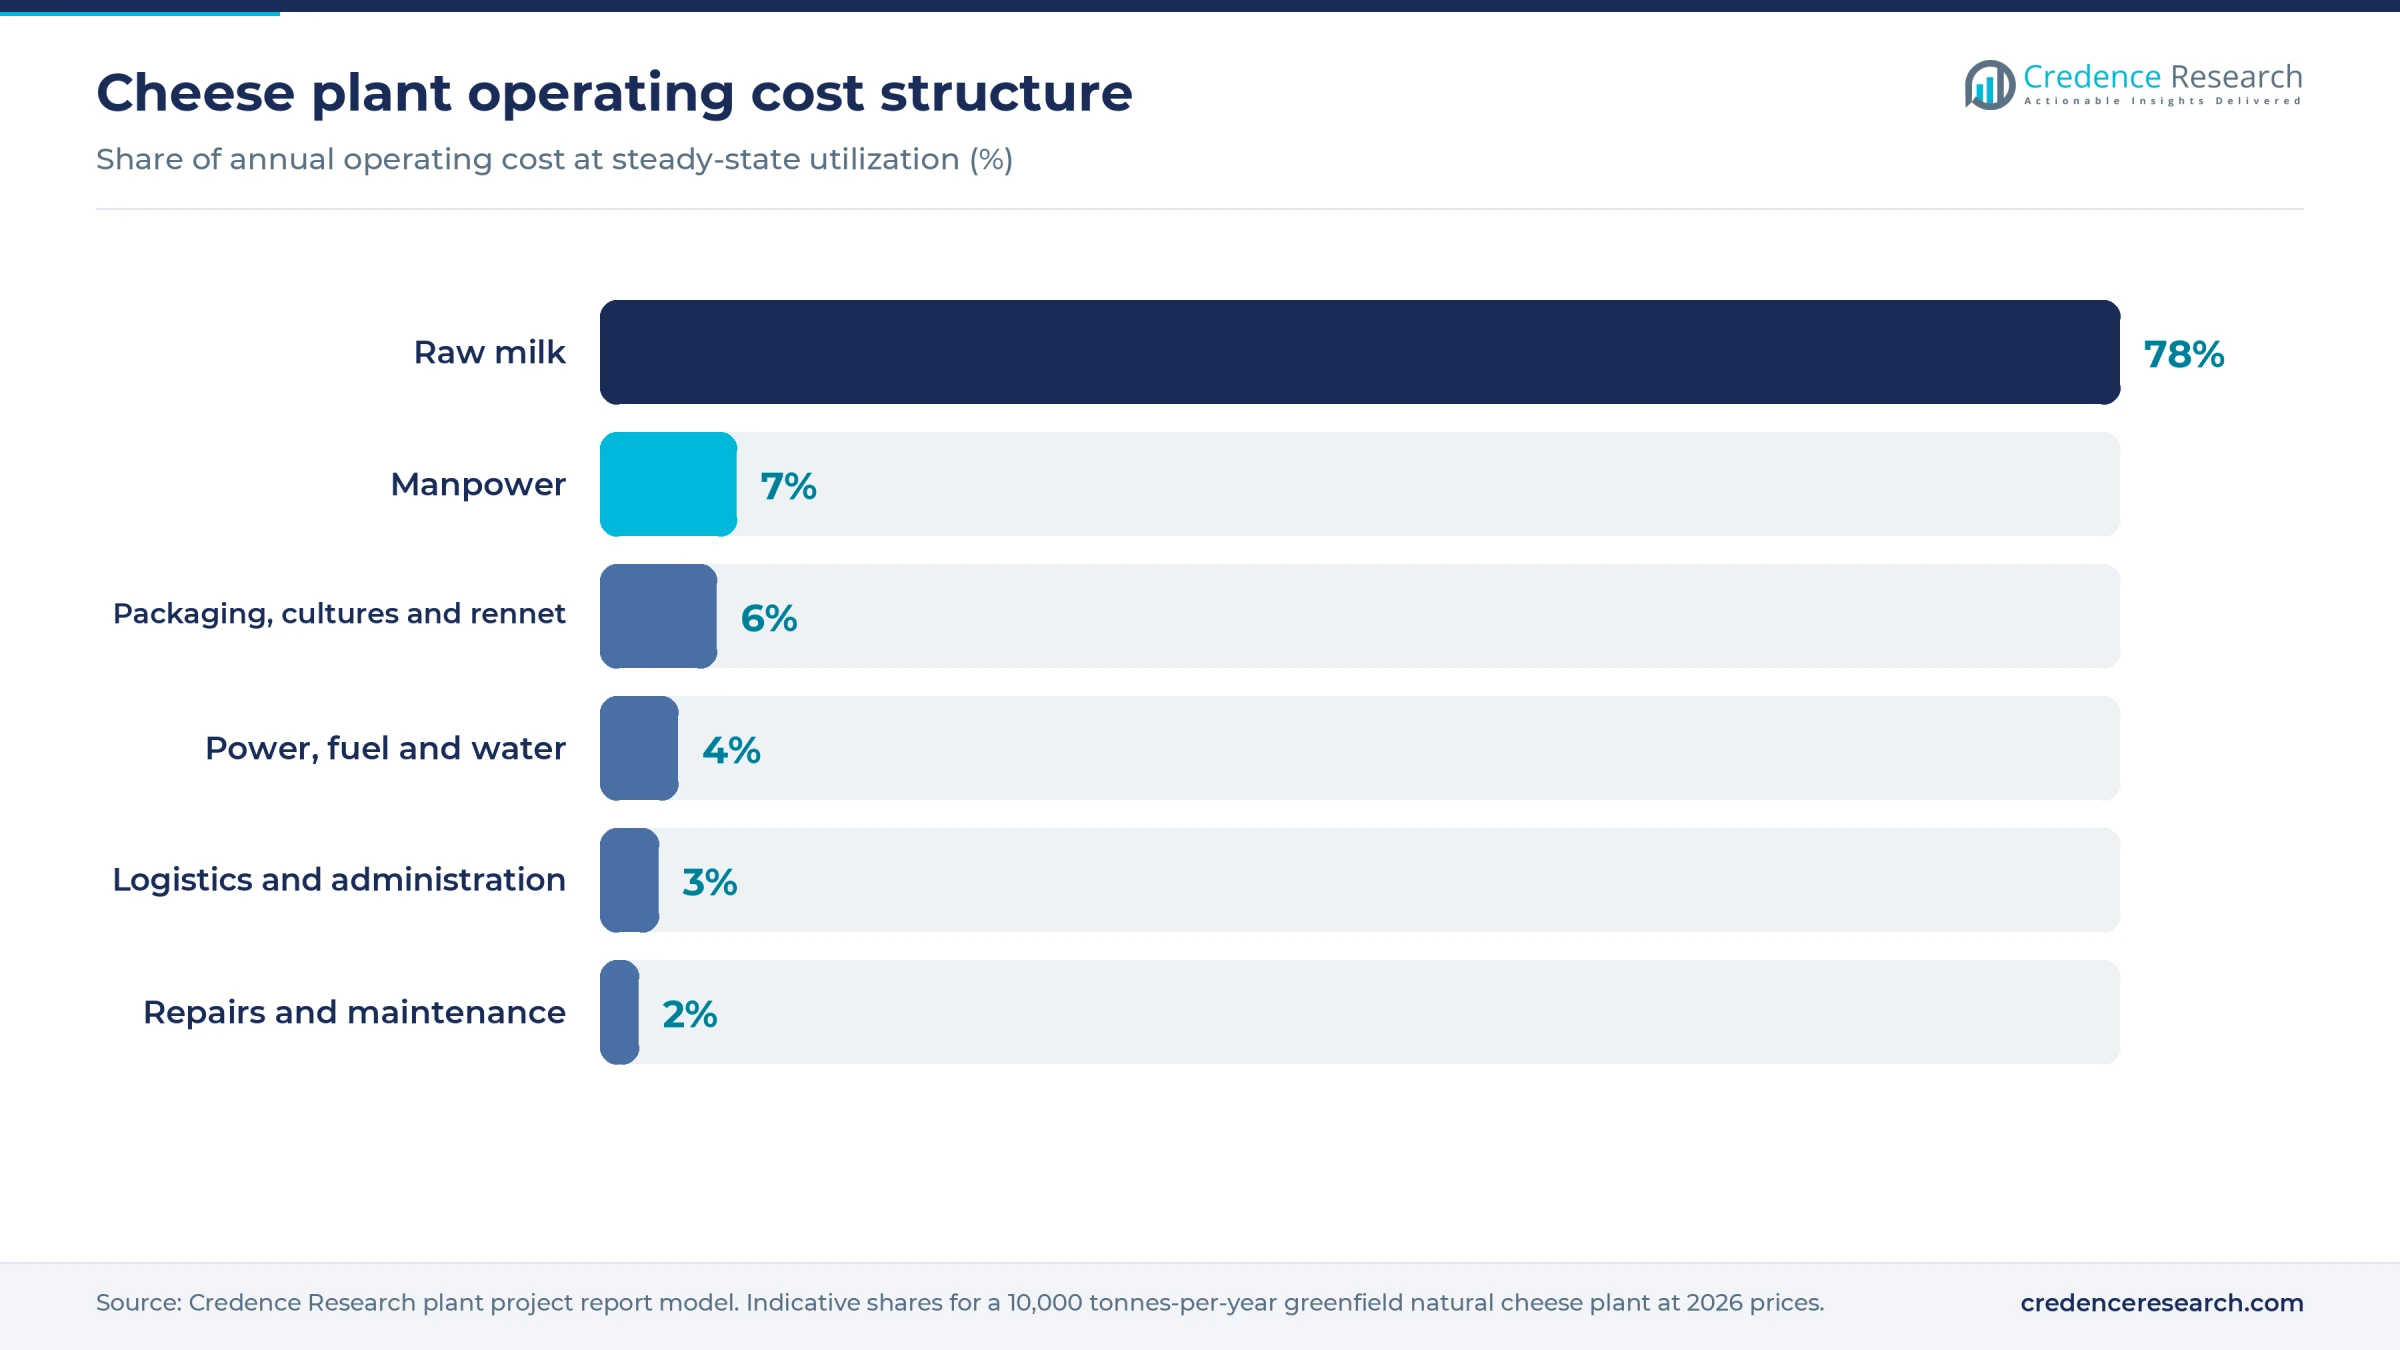
Milk dwarfs every other operating cost, which is why plant location and milk contracts matter more than equipment savings.
Machinery and raw materials for a cheese plant
The main machinery groups are listed below; capacities, specifications and quotations are available in the report.
- Milk intake: tanker bays, test laboratory, chillers, silos, clarifiers and separators
- Heat treatment: standardization skids, plate pasteurizers and optional membrane filtration
- Cheesemaking: enclosed vats, curd-whey separation, draining towers or belts, presses, and stretchers for pasta filata
- Salting and ripening: brine systems, racking, humidity-controlled rooms and cold stores
- Finishing: block cutters, shredders, vacuum and flow-wrap packers, metal detectors and palletizers
- Utilities: boilers, ammonia or glycol refrigeration, clean-in-place, effluent treatment and whey concentration
Milk is local by necessity, since hauling water is expensive and quality decays. Major surplus regions include the EU dairy belt from Ireland through the Netherlands, Germany, Denmark and Poland; the U.S. Upper Midwest and High Plains; New Zealand; Australia; southern Brazil; and western and northern India. Recent U.S. projects have clustered where herds are expanding, such as South Dakota and Texas.
Milk prices vary widely by region. The EU average was about EUR 42.5 per 100 kg in May 2026, an estimate, against a U.S. Class III price of USD 15.52 per hundredweight in July, or about USD 0.34 per kg. Cultures, microbial or calf rennet, salt, packaging film and cleaning chemicals are small by comparison and trade globally. A plant with no firm milk contract has no business case.
Cheese business profit margin and ROI
Gross margin after net milk and direct conversion costs is estimated at 10–20%, at an assumed blended price of USD 4.4–6.0 per kg. After assumed overheads, 20% tax and a one-year ramp-up, cash profit of about USD 2–5.6 million gives a typical 6–12 year payback. The best case is near 5.5 years, a USD 25 million build at the lowest profit is near 13.5, and a USD 60 million build at that profit would take about 31. Modeled unit cost is about USD 3.7–5.1 per kg, net of an assumed USD 0.3–0.5 whey and cream credit.
The European Commission's dairy price table showed EU wholesale cheddar at EUR 322 per 100 kg, gouda at EUR 380 and emmental at EUR 566 in late August 2026, about USD 3.70, USD 4.40 and USD 6.50 per kg. USDA quoted Oceania cheddar at USD 3,650–4,100 per tonne in mid-August and CME blocks at USD 1.60 per pound, about USD 3.50 per kg. Blocks alone would sit near or below modeled cost, so the mix must lean toward retail, foodservice or specialty sales.
The EU's May 2026 milk average, about USD 0.49 per kg, sits above the assumed range and would add about USD 0.40 per kg to top-end cost.
Revenue of about USD 35–48 million on 8,000 tonnes supports gross profit of about USD 3.5–9.6 million, before assumed overheads of USD 1.5–2.5 million. A USD 0.01 per kg rise in milk that cannot be passed through cuts gross margin by about 2 percentage points.
| Metric | Value |
|---|---|
| Project IRR (post-tax) | Available in report |
| NPV | Available in report |
| Return on investment | Available in report |
| DSCR | Available in report |
| Break-even utilization | Available in report |
How to start a cheese business, licenses and approvals
A cheese plant needs approvals in six areas wherever it is built. These are business and tax registration; land use, zoning and building permits; an environmental permit covering high-strength whey and wash water; occupational safety approvals, including boilers and ammonia refrigeration; dairy or food establishment approval with a documented safety plan; and customs registration for export. Retail and foodservice customers commonly also ask for FSSC 22000 or BRCGS certification, and many markets want kosher, halal or organic certificates. Protected names such as Parmigiano Reggiano cannot be used outside their registered rules.
| Market | Food and product | Environment and safety |
|---|---|---|
| United States | FDA food facility registration; preventive controls under 21 CFR 117; cheese standards of identity under 21 CFR 133; state dairy plant license and inspection | NPDES or local pretreatment permit; state air permit for boilers; OSHA process safety and EPA risk management rules for large ammonia systems |
| European Union | Establishment approval and identification mark under Regulation (EC) No 853/2004; hygiene under Regulation (EC) No 852/2004; traceability under Regulation (EC) No 178/2002 | Industrial Emissions Directive permit above 200 tonnes of milk received per day on an annual average, a level the modeled plant exceeds; national worker safety rules |
| India | FSSAI central license, which applies above 50,000 liters of milk a day and to 100% export-oriented units; Export Inspection Council certification for milk product exports where the importing market requires it | State pollution control board consents to establish and operate; factory license and boiler registration |
Key cheese manufacturers and recent developments
Lactalis, Saputo, Arla, FrieslandCampina, Savencia and Bel are large multinational makers. In the U.S., Leprino Foods is a leading mozzarella maker, alongside Hilmar cheese, Schreiber Foods and Sargento. Fonterra anchors New Zealand supply, Amul and the Britannia and Bel venture serve India, and Brazil's Queijaria Unium shows cooperative entry at scale.
- March 2026. Bel broke ground on a USD 200 million expansion in Brookings, South Dakota, doubling Mini Babybel output from 10,000 to 20,000 tons a year.
- August 2026. Food Engineering reported that Bongards' Creameries plans USD 135 million for 180 million more pounds of process cheese a year in Minnesota, with commercial operation expected by early 2028.
- September 2026. Schreiber Foods said it will spend more than USD 267 million on a process cheese plant in Carthage, Missouri, due to open in 2028.
What's inside the Cheese project report PDF
The report runs to 21 chapters. Open a chapter to see its sections.
1. Preface
2. Scope and Methodology
- 2.1 Objectives of the Study
- 2.2 Stakeholders
- 2.3 Research Methodology
- 2.4 Data Sources and Key Assumptions
3. Executive Summary
- 3.1 Market Snapshot
- 3.2 Project at a Glance (Capacity, CapEx, OpEx)
- 3.3 Key Financial Indicators (IRR, NPV, Payback, Break-even)
- 3.4 Feasibility Verdict
4. Product Overview
- 4.1 Cheese Definition and Properties
- 4.2 Grades and Specifications (BIS / ISO / ASTM)
- 4.3 HS Code and Classification
- 4.4 Key Applications
- 4.5 Substitutes
5. Global Cheese Market
- 5.1 Market Overview
- 5.2 Historical and Current Market Performance (Volume and Value)
- 5.3 Market Breakup by Grade / Type
- 5.4 Market Breakup by End-Use Industry
- 5.5 Market Breakup by Region
- 5.6 Market Drivers, Restraints and Trends
- 5.7 Value Chain Analysis
- 5.8 Market Forecast
6. Target Country Cheese Market Analysis
- 6.1 Demand and Supply Analysis
- 6.2 Installed Capacity vs Demand Gap
- 6.3 Import Dependence
- 6.4 Demand Forecast by End-Use
7. Trade Analysis
- 7.1 Imports by Volume, Value and Country
- 7.2 Exports by Volume, Value and Country
- 7.3 Trade Balance and Opportunities
8. Price Analysis
- 8.1 Historical Cheese Price Trends by Region
- 8.2 Raw Material / Feedstock Price Trends and Linkage
- 8.3 Price Forecast
- 8.4 Margins Across the Value Chain
9. Competitive Landscape
- 9.1 Market Structure
- 9.2 Key Players and Installed Capacities
- 9.3 Profiles of Key Players
- 9.4 Recent Developments (Expansions, M&A, New Plants)
10. Manufacturing Process and Technology
- 10.1 Comparison of Technology Routes
- 10.2 Selected Route and Process Flow Diagram
- 10.3 Unit Operations Involved
- 10.4 Chemical Reactions Involved
- 10.5 Mass Balance and Raw Material Requirements
- 10.6 Energy Balance
- 10.7 Quality Assurance Criteria and Technical Tests
- 10.8 By-products and Waste Handling
- 10.9 Technology Licensors / Providers
11. Project Details, Requirements and Costs
- 11.1 Land, Location and Site Development
- 11.1.1 Site Selection Criteria
- 11.1.2 Location Analysis
- 11.1.3 Land Requirement and Costs
- 11.1.4 Site Development Costs
- 11.2 Plant Layout
- 11.2.1 Layout Principles
- 11.2.2 Proposed Layout
- 11.2.3 Factors Influencing Layout
- 11.3 Civil Works and Buildings
- 11.4 Plant Machinery
- 11.4.1 Machinery Requirements and Specifications
- 11.4.2 Machinery Costs
- 11.4.3 Machinery Suppliers
- 11.5 Raw Materials
- 11.5.1 Requirements per Tonne of Output
- 11.5.2 Procurement and Sourcing
- 11.5.3 Costs
- 11.5.4 Suppliers
- 11.6 Packaging
- 11.6.1 Packaging Requirements
- 11.6.2 Packaging Costs
- 11.6.3 Packaging Suppliers
- 11.7 Storage and Material Handling
- 11.8 Transportation Requirements and Costs
- 11.9 Utilities
- 11.9.1 Power Requirements and Costs
- 11.9.2 Water Requirements and Costs
- 11.9.3 Steam, Fuel and Other Utilities
- 11.10 Manpower Requirements and Wages
12. Environment, Health, Safety and Sustainability
- 12.1 Effluent and Emissions Management
- 12.2 Hazard Classification and Safety Measures
- 12.3 Carbon Footprint
- 12.4 Green / Low-Carbon Process Options
13. Regulatory Procedures, Approvals and Certifications
- 13.1 Licences and Registrations
- 13.2 Environmental Clearances
- 13.3 Product Certifications (BIS, REACH, etc.)
- 13.4 Approval Timeline
14. Project Implementation Schedule
15. Project Economics
- 15.1 Capital Cost of the Project
- 15.2 Techno-Economic Parameters
- 15.3 Capacity Utilization and Ramp-up
- 15.4 Product Pricing and Margins
- 15.5 Income Projections
- 15.6 Expenditure Projections
- 15.7 Working Capital Requirement
- 15.8 Taxation
- 15.9 Depreciation
16. Financial Analysis
- 16.1 Projected Profit and Loss Account
- 16.2 Projected Cash Flow Statement
- 16.3 Projected Balance Sheet
- 16.4 Liquidity Analysis
- 16.5 Profitability Analysis (Payback, NPV, IRR, ROI)
- 16.6 Break-even Analysis
- 16.7 Debt Service Coverage Ratio (DSCR)
- 16.8 Sensitivity Analysis
- 16.9 Scenario and Uncertainty Analysis
17. Funding and Incentives
- 17.1 Means of Finance and Debt-Equity Structure
- 17.2 Loans and Financial Assistance
- 17.3 Government Schemes and Subsidies (PLI, State Policies)
18. Risk Assessment
- 18.1 Key Success Factors
- 18.2 Key Risk Factors
- 18.3 Risk Mitigation
19. Strategic Recommendations
20. Case Study of a Successful Venture
21. Appendix
- 21.1 Detailed Assumptions
- 21.2 Abbreviations
- 21.3 List of Tables and Figures
- 21.4 Sources
This page vs. the full report
| Data point | On this page (free) | In the full report |
|---|---|---|
| Total CapEx | One rounded range at one capacity | Exact figure at three capacities with a line-item breakup |
| CapEx breakup | Category shares (%) only | Cost, quantity and supplier for every machine |
| Operating cost | Share of raw materials, utilities and labor | Per-unit cost sheet with each input price and consumption |
| Profitability | Gross margin range and payback band | Exact IRR, NPV, ROI, break-even and DSCR |
| Financial statements | List of what is included | 10-year P&L, cash flow, balance sheet and Excel model |
| Sensitivity | One directional line | Full sensitivity and scenario tables |
| Process | Simplified flow diagram | Detailed process flow, mass and energy balance, operating conditions |
| Machinery | Names of the main machines | Specifications, capacity, cost and supplier list |
| Market | Headline size, growth and India demand trend | Segment, region, trade and price forecast tables |
| Suppliers and buyers | Supplier types and sourcing hubs | Named suppliers and buyers |
Cheese project report: FAQs
How much does it cost to set up a cheese plant?
How much milk is needed to make 1 kg of cheese?
What profit margin can a cheese plant earn?
What should a new plant do with whey?
Which licenses does a cheese plant need?
Which cheese type suits a new plant best?

About the analyst
Priyanka Mor, Senior Consultant
Senior Consultant at Credence Research Inc directing strategic market advisory, cross-border commercial due diligence and enterprise intelligence frameworks for global B2B clients. Combines quantitative modeling with executive advisory, translating macroeconomic variables and supply chain data into go-to-market blueprints, M&A screenings and competitive war-gaming strategies.
Related market research
- Cheese Market Size, Share, Trends, Growth and Forecast 2032
- Specialty Cheese Market Size, Growth, Share and Forecast 2032
- Dairy Ingredients Market Size, Growth, Share and Forecast 2032
- Organic Cheese Market Size, Share, Growth and Forecast 2032
- Cheese Powder Market Size, Share, Growth and Forecast 2032
- Cream Cheese Market Size, Growth, Share and Forecast 2032
More plant project reports
- Bread Manufacturing Plant Project Report (DPR) 2026
- Chocolate Manufacturing Plant Project Report (DPR) 2026
- Camel Dairy Processing Plant Project Report (DPR) 2026
- Vinegar Manufacturing Plant Project Report (DPR) 2026
- Onion Powder Manufacturing Plant Project Report (DPR) 2026
- Tea Processing Plant Project Report (DPR) 2026