
Quick answer
A biofertilizer plant grows beneficial soil microbes and formulates them into liquid or carrier-based crop inputs. A 1,000 kiloliter a year liquid plant needs fixed CapEx of about USD 1.2–2.5 million at an Asian industrial site and an assumed USD 3–6 million in the U.S. or EU. Gross margin runs about 35–55%, and payback typically takes 4–7 years, because selling costs and shelf life absorb much of the margin.
Viable for operators with proven strains, tight contamination control and a funded field sales effort; weak as a low-priced commodity line sold through dealers alone.
Biofertilizer plant: key highlights
| Parameter | Indicative value | Note |
|---|---|---|
| Plant capacity | 1,000 KL a year | Liquid formulations, about 3,300 liters a day over 300 days |
| Total CapEx | USD 1.2–2.5 million | Asian industrial site; assumed USD 3–6 million in the U.S. or EU; excludes working capital |
| Raw material share of operating cost | 45–60% | Growth media, carriers and packaging combined |
| Gross margin | 35–55% | At USD 2–3 per liter bulk, before selling costs |
| Payback period | 4–7 years | At 75% utilization, including a ramp-up year |
| IRR | Available in report | Post-tax, 10-year model |
| Break-even | Available in report | Capacity utilization basis |
Ranges assume a 1,000 KL a year liquid plant on an assumed 4,000 square meters at an Asian industrial site, 2026 prices, 75% utilization, an assumed bulk price of USD 2–3 per liter informed by Indian supplier listings, 90 rupees per USD and a 25% tax rate. U.S. and EU costs are assumed multiples. The full report is customizable to any country.
What is biofertilizer?
A biofertilizer is a crop input containing living microorganisms that improve a plant's access to nutrients. Unlike mineral fertilizer, it supplies little nutrient itself. Its microbes fix atmospheric nitrogen, make soil phosphorus or potassium more available, or extend the root's reach. The main groups are Rhizobium for legumes, Azotobacter and Azospirillum for cereals and vegetables, phosphate-solubilizing bacteria, and mycorrhizal fungi.
Products come in two commercial forms. Carrier-based grades hold cells on a powder or granule, while liquid grades suspend them in a protective broth and suit seed treatment and drip lines. Quality is measured as viable cells, not as nutrient content, and buyers should expect a stated minimum count at expiry. India's standard, for example, sets 5×10⁷ colony-forming units per gram of carrier or 1×10⁸ per milliliter of liquid for the main bacterial types.
HS classification is unsettled. HS 3101.00 covers animal or vegetable fertilizers and does not name microbial products, while heading 3002 covers cultures of micro-organisms. Indian advance rulings have gone both ways, so exporters should confirm treatment before shipping. Buyers include row-crop and legume growers, organic farms, fertilizer cooperatives, seed treaters and government input programs.
Biofertilizer market overview and global demand
Credence Research values the global market for microbial crop nutrition at USD 1.60 billion in 2025 and projects USD 3.69 billion by 2032, a 12.63% CAGR. That is small next to mineral fertilizer, with world exports of all HS chapter 31 fertilizers at about USD 68 billion in 2023, according to TrendEconomy trade statistics. The gap explains both the opportunity and the challenge, since a new entrant competes for a tiny share of the nutrient budget and must prove value against a familiar product.
Three demand pools matter. Legume inoculation is the most established, led by South American soybeans. Organic agriculture is a second, with FiBL counting about 98.9 million hectares of organic farmland in 2024. Conventional growers trying to trim nitrogen bills form a newer third pool, tracked within the broader agricultural microbials sector.
Public volume data is thin, because few countries publish production. India is an exception. A 2024 parliamentary answer recorded 2022-23 output of about 67,000 tonnes of carrier product and 112,000 kiloliters of liquid in Gujarat, and about 133,000 tonnes of carrier product in Tamil Nadu. State figures swing sharply from year to year, so they are best read as a sign of scale rather than a trend. Policy also shapes demand. Brazil's Law 15,070 of December 2024 created a dedicated framework for bio-inputs, and Indian crop programs have subsidized Rhizobium and phosphate-solubilizing inputs at 50% of cost, up to a per-hectare limit.
Biofertilizer manufacturing process
A biofertilizer plant is closer to a small fermentation or food-grade facility than to a fertilizer blending shed. The product is alive, so the plant's central task is to keep one intended organism growing and every other organism out. A single contaminated batch can mean scrapping thousands of liters, which makes sterile practice the main driver of cost, layout and staff training.
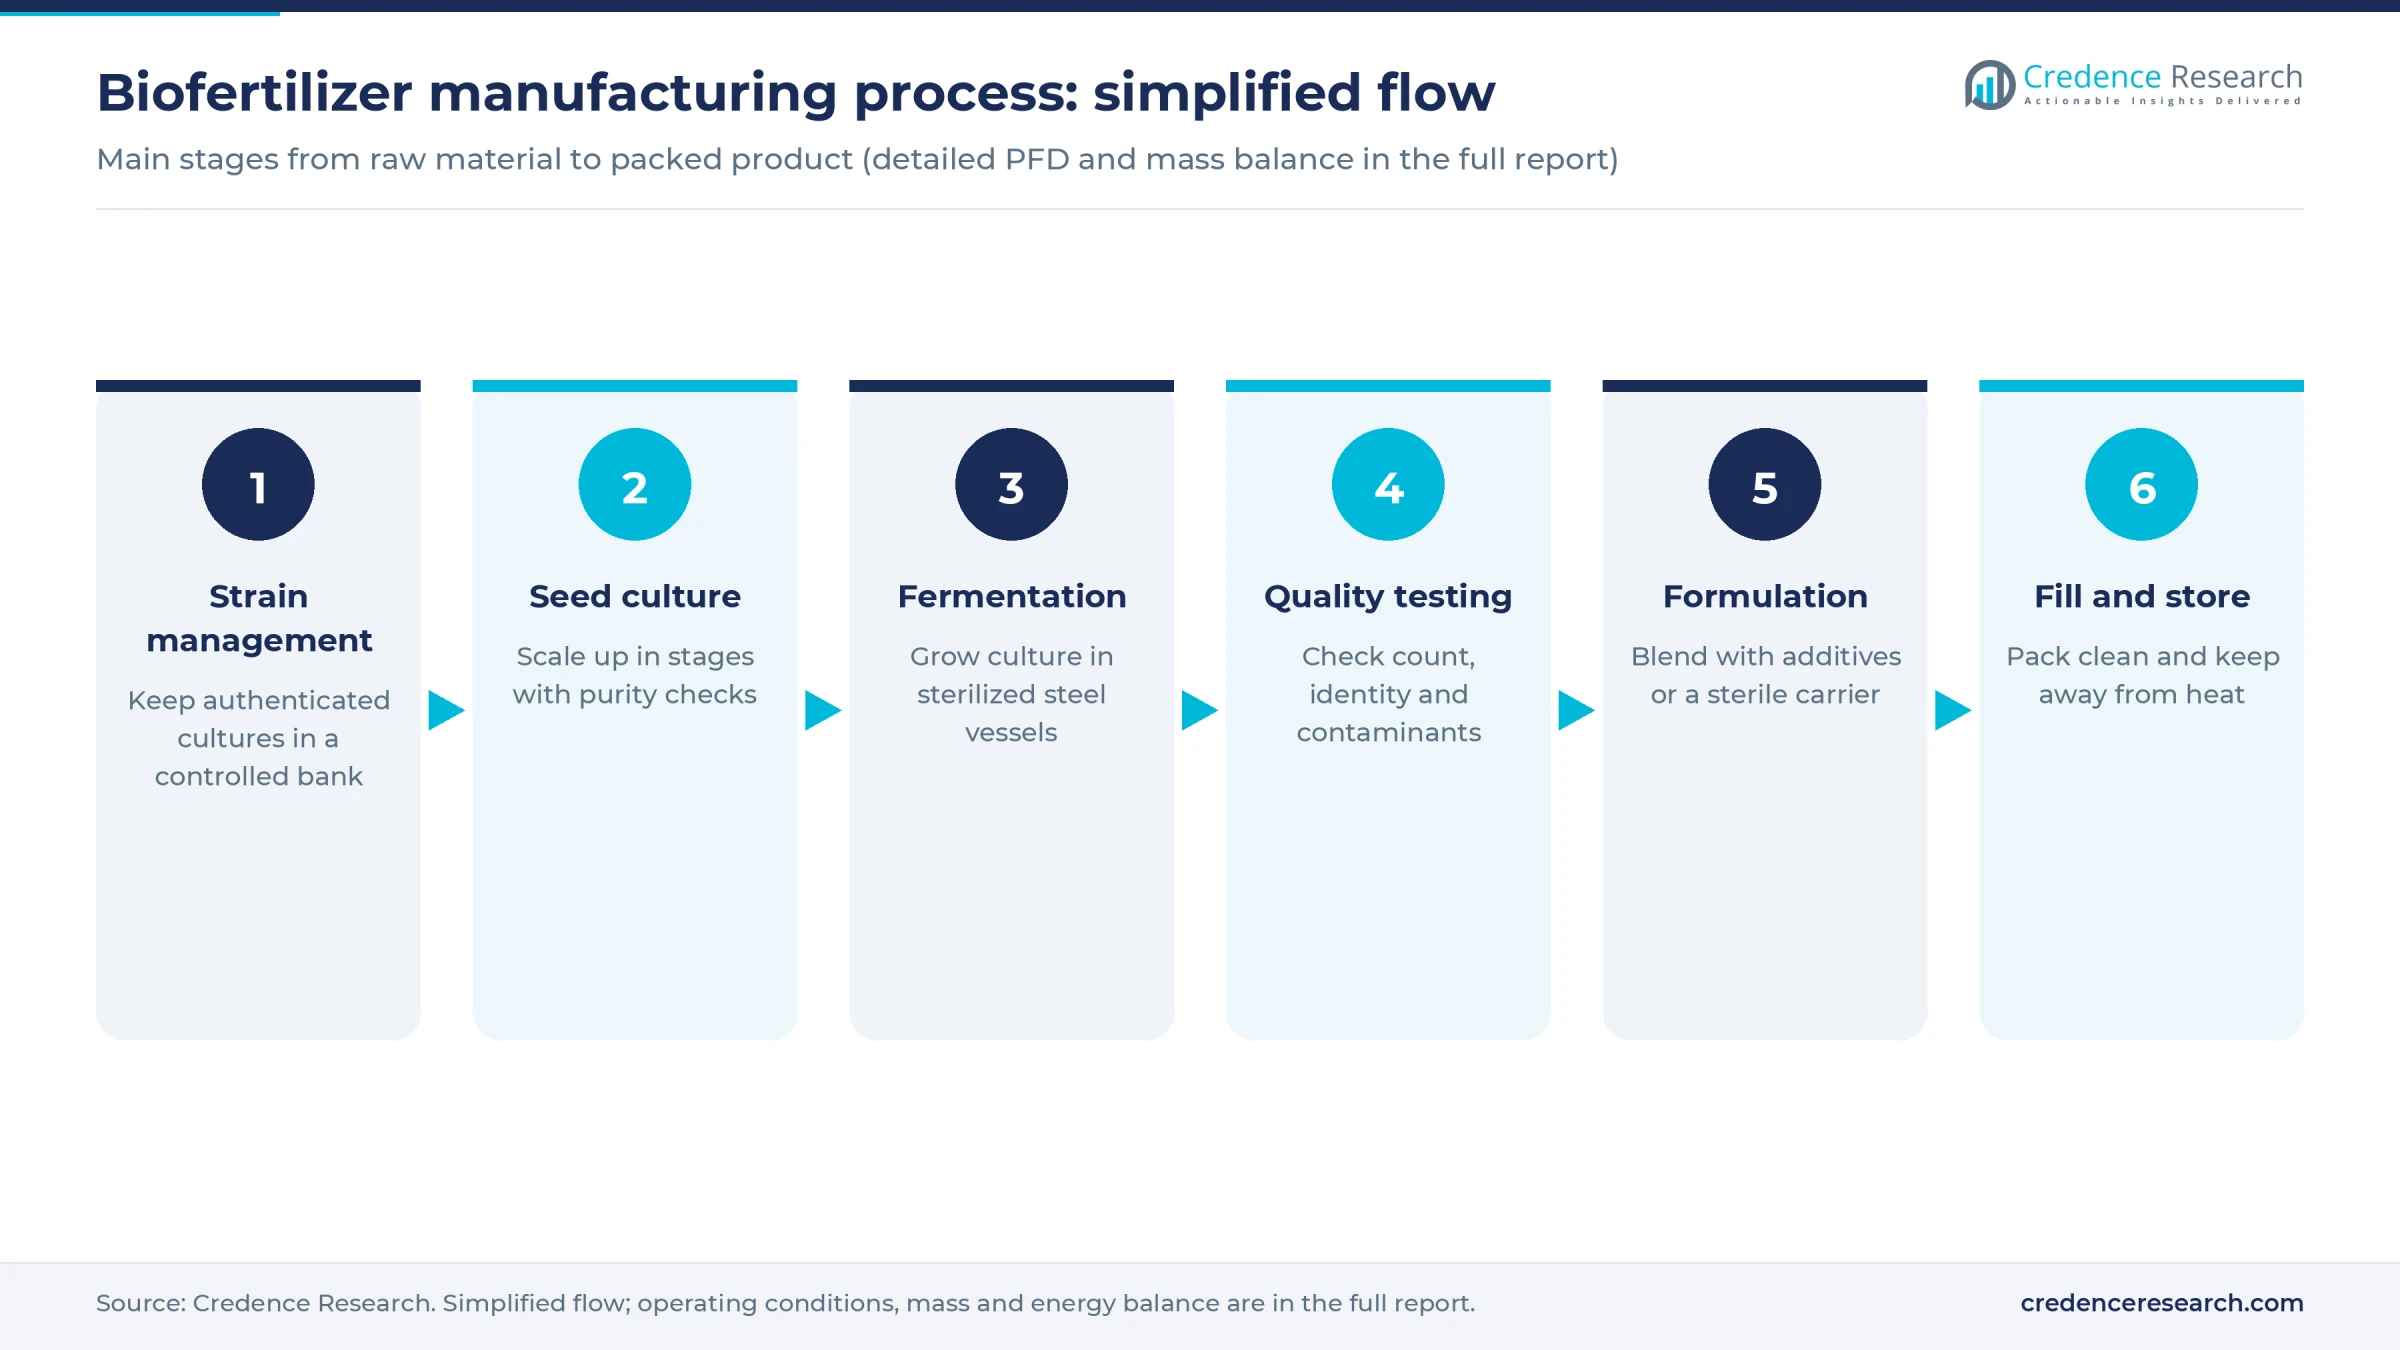
- Strain management. The plant keeps authenticated, documented strains in a controlled culture bank, licensed or sourced from a recognized collection. Strain performance on target crops underpins every commercial claim.
- Seed culture. Small lab cultures are scaled up in stages, with a purity check at each stage before material moves to the next vessel.
- Production fermentation. Stainless steel fermenters, sterilized in place with steam, grow the culture under controlled conditions. Each organism has its own recipe, which sits in the proprietary know-how of the producer.
- Quality testing. Each batch is checked for viable count, identity and contaminants before release. Results take days, so plants need holding capacity.
- Formulation. Liquid grades are blended with protective additives that support shelf life. Carrier grades are mixed into a sterilized, finely milled base such as peat or lignite, then cured.
- Filling and storage. Filling lines pack product in bottles, drums or pouches under clean conditions. Finished goods are stored away from heat, and distributors must follow the same rule.
Mycorrhizal products follow a different route, typically propagated with host plant roots or in specialized culture systems, and they need much more space. Shelf life is the commercial risk that follows from all of this. Viable count falls over time, so product left too long in hot warehouses can fail its label claim well before a grower opens it. Spent broth must also be deactivated before discharge.
Biofertilizer plant setup cost
The indicative build is a 1,000 kiloliter a year liquid plant, about 3,300 liters a day over 300 working days. That is a mid-sized regional scale: Argentina's Rizobacter reported capacity of 7.2 million liters a year after its 2024 expansion. Fixed CapEx comes to about USD 1.2–2.5 million at an Asian industrial site and an assumed USD 3–6 million in the U.S. or EU, where clean construction, engineering and permitting cost more. Working capital of about USD 0.3–0.4 million is excluded, and the full report can be recast for any country.
Land shows how each row was built. A 4,000 square meter plot at an assumed USD 40–60 per square meter costs USD 160,000–240,000, about 11% of CapEx at the midpoint. Land spread is wide, and serviced EU parks can cost several times that rate.
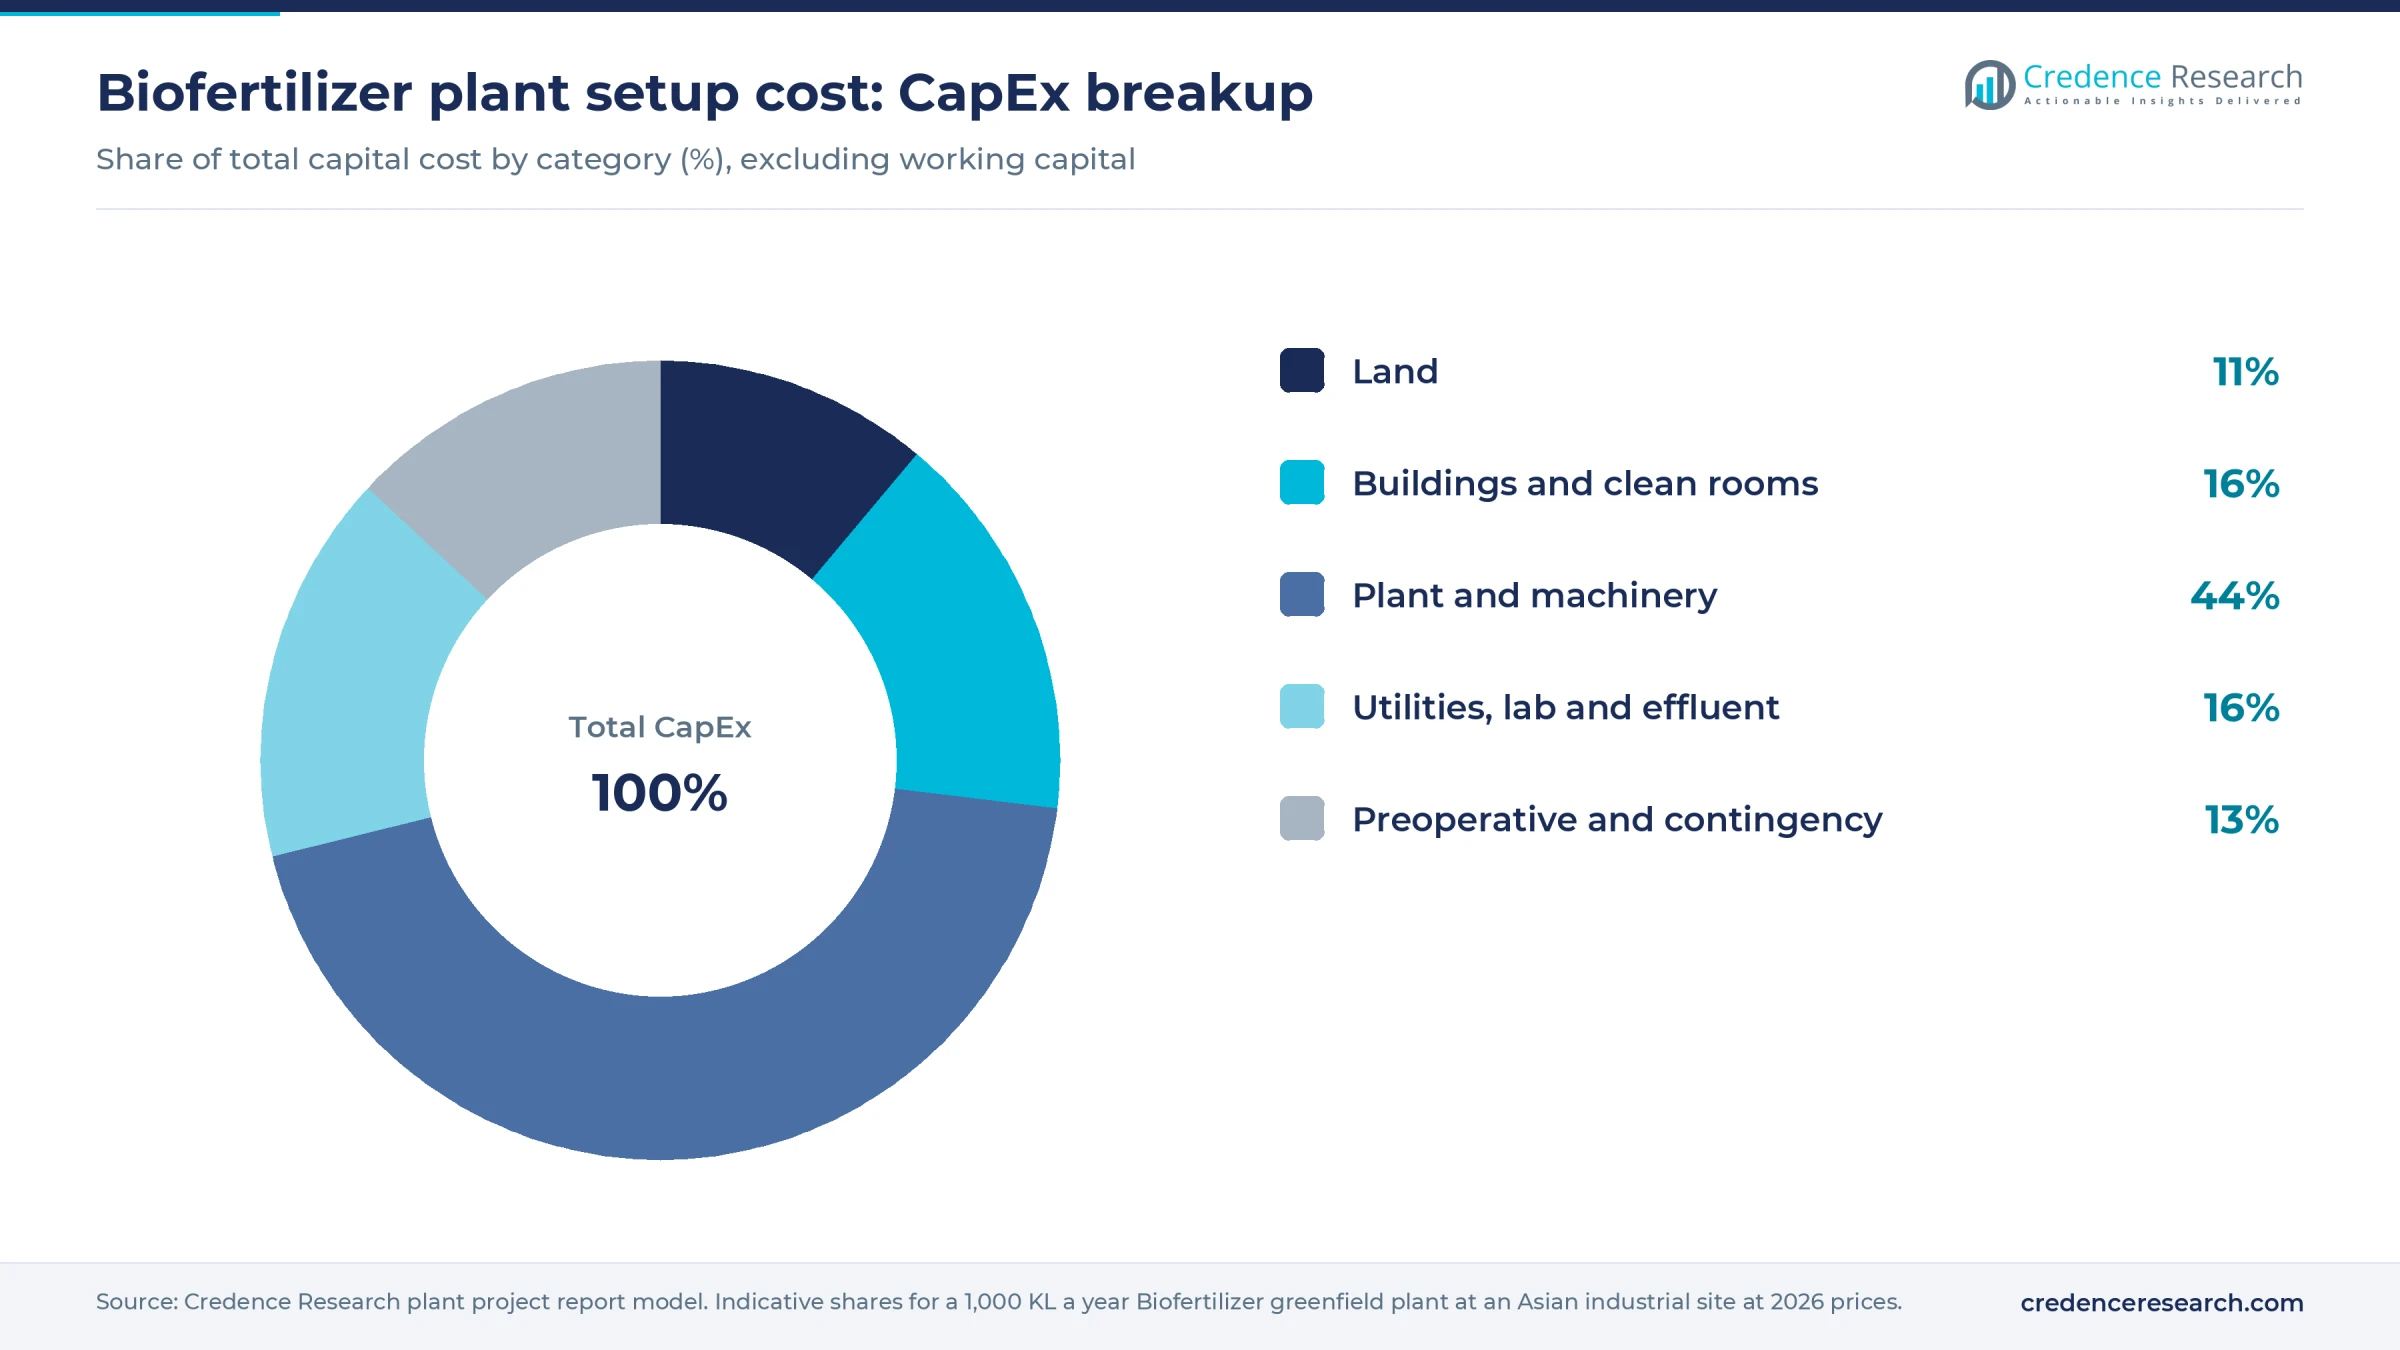
Two public benchmarks bracket the estimate. India's capital subsidy scheme, as described to parliament in 2020, allows up to about USD 178,000 for a 200 tonne a year unit, at 90 rupees per USD, which scales to about USD 470,000 at this capacity using the common six-tenths rule and treating a tonne and a kiloliter as roughly equal. That sets a floor for a basic plant. Rizobacter's investment of more than USD 10 million for 2.4 million additional liters scales to about USD 5.9 million, an upper reference for a multi-technology export plant. IPL Biologicals' reported Indian investment would scale higher, but its added capacity is not reported, so it is not used. The Asian range sits between them, built from assumed rates for clean buildings, fermenters, utilities, a quality lab and contingency.
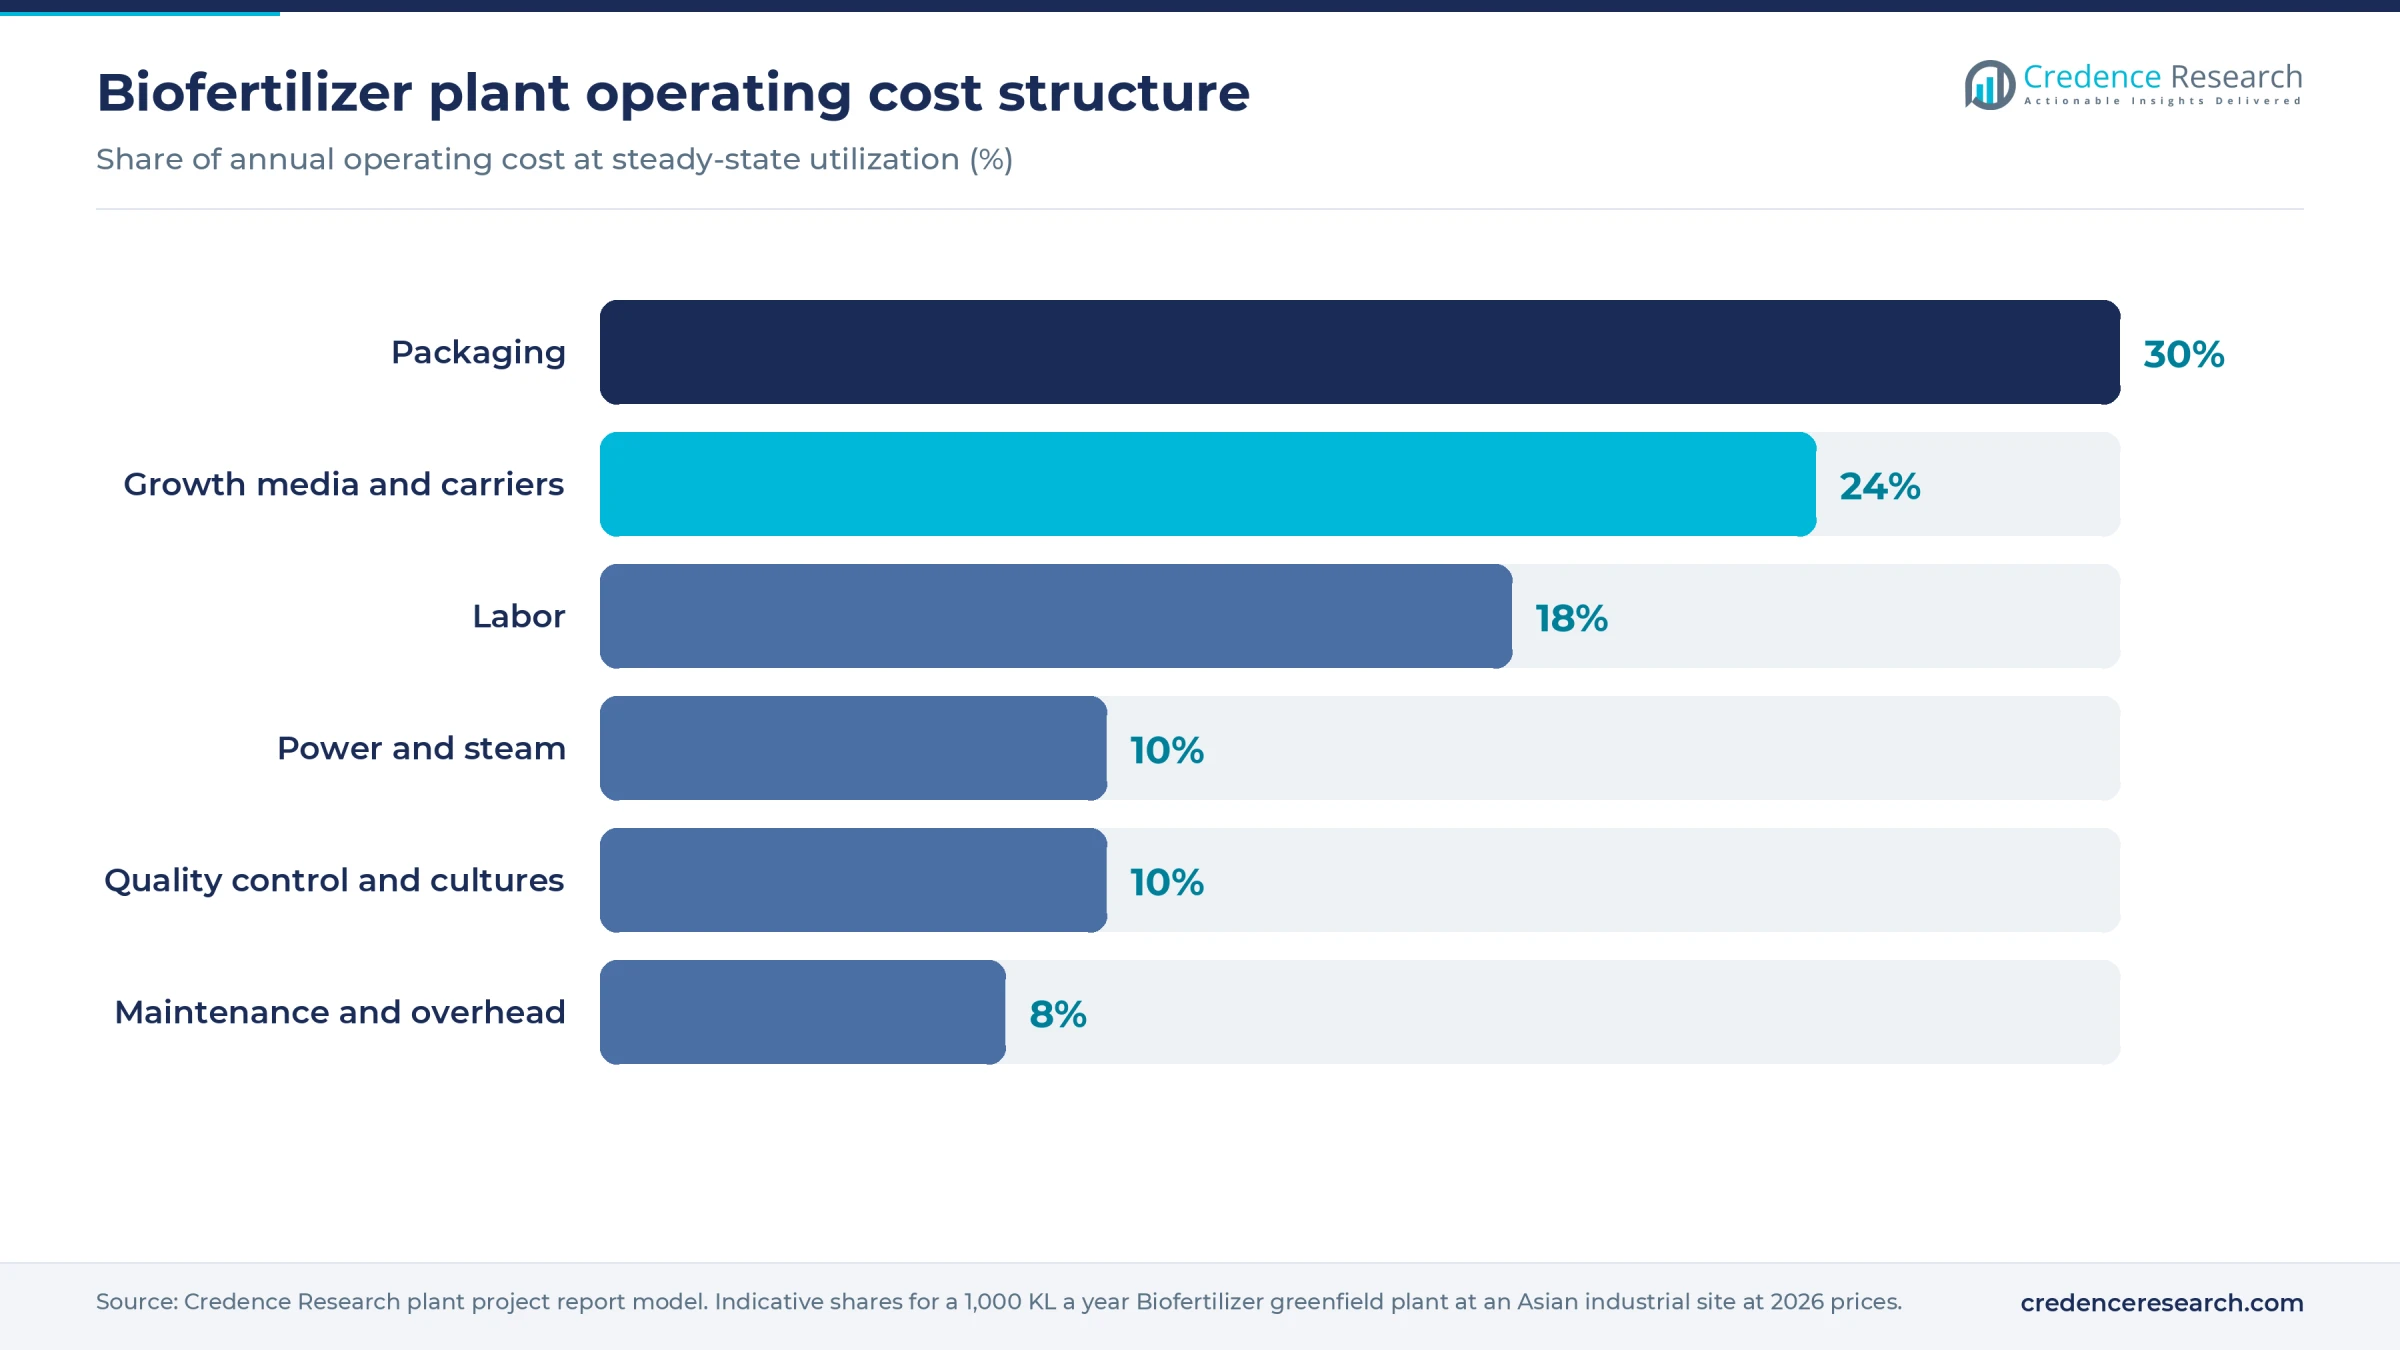
Machinery takes the largest share at about 44%, because sterile stainless vessels and clean utilities are not easily cheapened. Packaging is the largest cash cost item at about 30% of operating cost, since small farmer packs cost far more per liter than drums. Growth media add about 24%. A move from bottles to bulk drums can therefore change unit cost more than a better fermentation recipe.
Machinery and raw materials for a biofertilizer plant
Core equipment for a 1,000 kiloliter a year line includes the following items.
- Laminar flow benches, incubators and a shaker for the culture room
- Seed fermenters and production fermenters in stainless steel with sterilize-in-place piping
- A steam boiler, autoclaves, sterile air filtration and purified water treatment
- Formulation and holding tanks with agitators
- Bottle washing, filling, capping and labeling machines, plus a drum filling station
- A mixer, mill and dryer if carrier-based grades are added
- A microbiology lab for plate counts, identity checks and contaminant testing
- Cool storage for finished goods and a broth deactivation and effluent system
Raw materials are mostly widely traded, so supply risk sits less with volume than with consistency. Molasses and other sugars come from sugar producers in Brazil, India, Thailand and Australia. Yeast extract and peptones come from fermentation suppliers in Europe, China and North America. Peat, the classic carrier, is mined in Canada, northern Europe and Russia, while lignite and other mineral carriers are usually sourced locally to reduce freight. Mother cultures come from a plant's own bank, licensed strains or culture collections, and the right to use a strain can matter more than any other input. HDPE bottles and drums are available from regional packaging plants in most markets.
Biofertilizer business profit margin and ROI
Margins look strong at the factory gate and shrink in the field. Indian supplier listings for drum and bottle liquid Azotobacter ran from about USD 1.2 to USD 6.4 per liter at 90 rupees per dollar in late 2026, with bulk-oriented offers mostly at USD 1.8–2.9. An assumed bulk price of USD 2–3 per liter against an assumed cash cost near USD 1.30–1.35 gives a gross margin of about 35–55%. A state-published Indian pre-feasibility study for a far simpler 300 tonne a year unit shows profit near 31% of sales at full capacity, a useful but optimistic cross-check. Branded farmer packs can sell for far more in some markets, with higher distribution costs.
Selling costs decide the outcome. Field trials, agronomists, dealer margins, expired stock returns and registrations can take an assumed 20–25% of sales. At 750 kiloliters a year and USD 2.50 per liter, sales reach about USD 1.9 million and post-tax cash profit about USD 0.36 million. In a stronger case, it reaches about USD 0.59 million. Against USD 1.6–2.2 million of fixed CapEx plus working capital, that supports a payback of about 4–7 years, including a ramp-up year. Near USD 2 per liter, payback extends past a decade, which is the main sensitivity.
| Metric | Value |
|---|---|
| Project IRR (post-tax) | Available in report |
| NPV | Available in report |
| ROI | Available in report |
| DSCR | Available in report |
| Break-even utilization | Available in report |
How to start a biofertilizer business with the right licenses
Every plant needs business and tax registration, zoning and building permits, an environmental permit covering wastewater and biological waste, occupational safety approval for steam and pressure vessels, and export or import registration for traded strains and finished goods. The label claim then sets the product route. A nutrition claim usually falls under fertilizer rules, while any claim against pests or disease generally triggers pesticide registration. Biosafety and strain import rules also apply, especially for engineered organisms.
| Market | Key approvals for biofertilizer |
|---|---|
| United States | State fertilizer or soil amendment registration, such as CDFA licensing in California. 40 CFR 152.6(g) excludes plant inoculants that only improve nutrient uptake from EPA pesticide regulation under FIFRA. Intergeneric engineered microbes may need an EPA TSCA notice. |
| European Union | CE marking under Regulation (EU) 2019/1009 as a microbial plant biostimulant, through a notified body; component category CMC 7 currently covers Azotobacter, Azospirillum, Rhizobium and mycorrhizal fungi, processed only by drying or freeze-drying, which limits the route for liquid grades. Other strains follow national fertilizer rules. |
| India | Certificate of manufacture under the Fertiliser (Control) Order, 1985, with products meeting Schedule III; state pollution control board consent. |
Key biofertilizer manufacturers and recent developments
The industry mixes global biologicals specialists with many regional makers. Rizobacter in Argentina is a leading soybean inoculant producer, Lallemand Plant Care sells rhizobial inoculants such as LALFIX in North America and beyond, and Koppert covers mycorrhiza through a joint venture in India. Pivot Bio in the United States sells gene-edited nitrogen-fixing microbes, Corteva markets Symborg-derived nitrogen-fixation products, and IPL Biologicals is a large Indian maker. Linking these players to the wider agricultural inoculants landscape shows that strain ownership and distribution reach set the leaders apart.
- September 2026. Pivot Bio said it had significantly increased production and availability of its RETURN product for winter wheat and launched a dry formulation, opening spring wheat orders for 2027 pending state registrations, iGrow News reported.
- May 2026. IPL Biologicals opened a third plant in Vadodara, raising capacity to 7,000 kiloliters a year, with a reported investment equal to about USD 22 million at 90 rupees per dollar, ThePrint reported.
- February 2026. Koppert's Indian joint venture with Agrilife inaugurated a large mycorrhiza facility in Hyderabad, Global Agriculture reported.
What's inside the Biofertilizer project report PDF
The report runs to 21 chapters. Open a chapter to see its sections.
1. Preface
2. Scope and Methodology
- 2.1 Objectives of the Study
- 2.2 Stakeholders
- 2.3 Research Methodology
- 2.4 Data Sources and Key Assumptions
3. Executive Summary
- 3.1 Market Snapshot
- 3.2 Project at a Glance (Capacity, CapEx, OpEx)
- 3.3 Key Financial Indicators (IRR, NPV, Payback, Break-even)
- 3.4 Feasibility Verdict
4. Product Overview
- 4.1 Biofertilizer Definition and Properties
- 4.2 Grades and Specifications (BIS / ISO / ASTM)
- 4.3 HS Code and Classification
- 4.4 Key Applications
- 4.5 Substitutes
5. Global Biofertilizer Market
- 5.1 Market Overview
- 5.2 Historical and Current Market Performance (Volume and Value)
- 5.3 Market Breakup by Grade / Type
- 5.4 Market Breakup by End-Use Industry
- 5.5 Market Breakup by Region
- 5.6 Market Drivers, Restraints and Trends
- 5.7 Value Chain Analysis
- 5.8 Market Forecast
6. Target Country Biofertilizer Market Analysis
- 6.1 Demand and Supply Analysis
- 6.2 Installed Capacity vs Demand Gap
- 6.3 Import Dependence
- 6.4 Demand Forecast by End-Use
7. Trade Analysis
- 7.1 Imports by Volume, Value and Country
- 7.2 Exports by Volume, Value and Country
- 7.3 Trade Balance and Opportunities
8. Price Analysis
- 8.1 Historical Biofertilizer Price Trends by Region
- 8.2 Raw Material / Feedstock Price Trends and Linkage
- 8.3 Price Forecast
- 8.4 Margins Across the Value Chain
9. Competitive Landscape
- 9.1 Market Structure
- 9.2 Key Players and Installed Capacities
- 9.3 Profiles of Key Players
- 9.4 Recent Developments (Expansions, M&A, New Plants)
10. Manufacturing Process and Technology
- 10.1 Comparison of Technology Routes
- 10.2 Selected Route and Process Flow Diagram
- 10.3 Unit Operations Involved
- 10.4 Chemical Reactions Involved
- 10.5 Mass Balance and Raw Material Requirements
- 10.6 Energy Balance
- 10.7 Quality Assurance Criteria and Technical Tests
- 10.8 By-products and Waste Handling
- 10.9 Technology Licensors / Providers
11. Project Details, Requirements and Costs
- 11.1 Land, Location and Site Development
- 11.1.1 Site Selection Criteria
- 11.1.2 Location Analysis
- 11.1.3 Land Requirement and Costs
- 11.1.4 Site Development Costs
- 11.2 Plant Layout
- 11.2.1 Layout Principles
- 11.2.2 Proposed Layout
- 11.2.3 Factors Influencing Layout
- 11.3 Civil Works and Buildings
- 11.4 Plant Machinery
- 11.4.1 Machinery Requirements and Specifications
- 11.4.2 Machinery Costs
- 11.4.3 Machinery Suppliers
- 11.5 Raw Materials
- 11.5.1 Requirements per Tonne of Output
- 11.5.2 Procurement and Sourcing
- 11.5.3 Costs
- 11.5.4 Suppliers
- 11.6 Packaging
- 11.6.1 Packaging Requirements
- 11.6.2 Packaging Costs
- 11.6.3 Packaging Suppliers
- 11.7 Storage and Material Handling
- 11.8 Transportation Requirements and Costs
- 11.9 Utilities
- 11.9.1 Power Requirements and Costs
- 11.9.2 Water Requirements and Costs
- 11.9.3 Steam, Fuel and Other Utilities
- 11.10 Manpower Requirements and Wages
12. Environment, Health, Safety and Sustainability
- 12.1 Effluent and Emissions Management
- 12.2 Hazard Classification and Safety Measures
- 12.3 Carbon Footprint
- 12.4 Green / Low-Carbon Process Options
13. Regulatory Procedures, Approvals and Certifications
- 13.1 Licences and Registrations
- 13.2 Environmental Clearances
- 13.3 Product Certifications (BIS, REACH, etc.)
- 13.4 Approval Timeline
14. Project Implementation Schedule
15. Project Economics
- 15.1 Capital Cost of the Project
- 15.2 Techno-Economic Parameters
- 15.3 Capacity Utilization and Ramp-up
- 15.4 Product Pricing and Margins
- 15.5 Income Projections
- 15.6 Expenditure Projections
- 15.7 Working Capital Requirement
- 15.8 Taxation
- 15.9 Depreciation
16. Financial Analysis
- 16.1 Projected Profit and Loss Account
- 16.2 Projected Cash Flow Statement
- 16.3 Projected Balance Sheet
- 16.4 Liquidity Analysis
- 16.5 Profitability Analysis (Payback, NPV, IRR, ROI)
- 16.6 Break-even Analysis
- 16.7 Debt Service Coverage Ratio (DSCR)
- 16.8 Sensitivity Analysis
- 16.9 Scenario and Uncertainty Analysis
17. Funding and Incentives
- 17.1 Means of Finance and Debt-Equity Structure
- 17.2 Loans and Financial Assistance
- 17.3 Government Schemes and Subsidies (PLI, State Policies)
18. Risk Assessment
- 18.1 Key Success Factors
- 18.2 Key Risk Factors
- 18.3 Risk Mitigation
19. Strategic Recommendations
20. Case Study of a Successful Venture
21. Appendix
- 21.1 Detailed Assumptions
- 21.2 Abbreviations
- 21.3 List of Tables and Figures
- 21.4 Sources
This page vs. the full report
| Data point | On this page (free) | In the full report |
|---|---|---|
| Total CapEx | One rounded range at one capacity | Exact figure at three capacities with a line-item breakup |
| CapEx breakup | Category shares (%) only | Cost, quantity and supplier for every machine |
| Operating cost | Share of raw materials, utilities and labor | Per-unit cost sheet with each input price and consumption |
| Profitability | Gross margin range and payback band | Exact IRR, NPV, ROI, break-even and DSCR |
| Financial statements | List of what is included | 10-year P&L, cash flow, balance sheet and Excel model |
| Sensitivity | One directional line | Full sensitivity and scenario tables |
| Process | Simplified flow diagram | Detailed process flow, mass and energy balance, operating conditions |
| Machinery | Names of the main machines | Specifications, capacity, cost and supplier list |
| Market | Headline size, growth and India demand trend | Segment, region, trade and price forecast tables |
| Suppliers and buyers | Supplier types and sourcing hubs | Named suppliers and buyers |
Biofertilizer project report: FAQs
How much does it cost to set up a biofertilizer plant?
What is the profit margin in biofertilizer manufacturing?
What is the payback period for a biofertilizer plant?
Do biofertilizers need pesticide registration in the U.S.?
Which microbes can be CE marked in the EU?
Is liquid or carrier-based biofertilizer better for a new plant?
What is the biggest risk in a biofertilizer business?

About the analyst
Nisha Gupta, Senior Research Analyst
Nisha Gupta is a Senior Research Analyst at Credence Research Inc. who works across industry domains, including packaging, automotive parts and machinery. Her focus is the modelling engine behind each study: she builds quantitative market databases and econometric forecasting frameworks, and developed automated Excel-based market modelling templates that cut client turnaround time by 30%.
Related market research
- Azotobacter-Based Biofertilizer Market Size, Share and Forecast 2032
- Biostimulants Market Size, Share, Growth and Forecast 2032
- Agricultural Biologicals Market Size, Share, Growth & Forecast 2032
- Organic Farming Market Size, Share, Growth and Forecast 2032
- Specialty Fertilizers Market Size, Growth, Share and Forecast 2032
More plant project reports
- Avocado Processing Plant Project Report (DPR) 2026
- Copper Wire Manufacturing Plant Project Report (DPR) 2026
- Cigarette Lighter Manufacturing Plant Project Report (DPR) 2026
- Bread Manufacturing Plant Project Report (DPR) 2026
- Chocolate Manufacturing Plant Project Report (DPR) 2026
- Cheese Manufacturing Plant Project Report (DPR) 2026