
Quick answer
An aluminum foil manufacturing plant cold-rolls purchased foilstock into thin gauge foil for packaging, household and technical buyers. A greenfield mill of about 20,000 metric tons a year needs an estimated USD 30–45 million of CapEx. Metal is close to 90% of operating cost and largely passes through to buyers, so the plant earns on its conversion fee, leaving a gross margin of 6–12% and a payback of about 5–13 years.
Viable for entrants with secured foilstock and a protected or specialty market, but risky as a plain commodity mill competing against Chinese export pricing.
Aluminum Foil plant: key highlights
| Parameter | Indicative value | Note |
|---|---|---|
| Plant capacity | About 20,000 metric tons per year | Two to three foil mills rolling purchased foilstock, no casting line |
| Total CapEx | USD 30–45 million | Greenfield, Asian or emerging-market industrial park; U.S. and EU sites usually higher |
| Raw material share of operating cost | 88–92% | Foilstock, net of scrap returned to the metal supplier |
| Gross margin | 6–12% | Price minus foilstock, yield loss and direct conversion |
| Payback period | 5–13 years | At 85% utilization and mid-range CapEx, before tax and financing |
| IRR | Available in report | Post-tax, 10-year model |
| Break-even | Available in report | Capacity utilization basis |
Ranges assume a greenfield 20,000 metric ton a year cold-rolling mill on purchased foilstock, an Asian or emerging-market industrial park (U.S./EU costs higher), 2026 prices, 85% utilization, LME aluminum near USD 3,050 per metric ton and assumed foil prices, foilstock premiums and conversion costs. Yuan converted at an assumed 7.1 and rupees at an assumed 88 per USD. Customizable to any country.
What is aluminum foil?
Aluminum foil is flat-rolled aluminum thinner than 0.2 mm, sold in jumbo coils to converters or in small rolls to households and food service. Its commercial value lies in barrier performance, because even very thin gauges block light, oxygen and moisture when pinholes are controlled.
Common grades include 1235, 8011 and 8079 alloys, in soft or hard temper. Household and container foil usually runs from about 9 to 40 microns, flexible packaging and blister lidding from about 6 to 25 microns, and battery current collector foil at the thin end with far tighter surface and strength requirements. An International Aluminium Institute fact sheet puts packaging at about three quarters of European foil output, with the rest in technical uses such as heat exchangers and insulation.
Foil falls under Harmonized System heading 7607. Subheading 7607.11 covers unbacked foil rolled but not further worked, 7607.19 covers other unbacked foil, and 7607.20 covers backed foil, so a plain rolling mill mainly trades under 7607.11.
Aluminum foil market overview and global demand
The global aluminum foil packaging market stands at about USD 30.1 billion in 2025, based on Credence Research's estimate of USD 29.0 billion for 2024 and a 3.86% CAGR through 2032. That figure covers packaging only, so battery and heat exchanger foil come on top.
China dominates in physical terms. AL Circle reported in November 2025 that China produced 4.7 million metric tons in 2024, about 70% of the world total, and consumed 3.32 million metric tons, about half of world demand. Its rolling capacity of 6.1–6.5 million metric tons sits well above output, which is the central fact any new entrant has to price in.
UN Comtrade data for HS 7607 show 2024 exports of about USD 5.7 billion from China, USD 1.75 billion from Germany, USD 750 million from Italy, USD 650 million from the United States, USD 560 million from Japan and USD 540 million from Turkey. China's export volume then fell 13.8% to about 1.34 million metric tons in 2025 as trade barriers bit.
Those barriers are what create room for regional mills. The European Union imposed anti-dumping duties of 15.4–28.5% on Chinese converter foil in December 2021, the U.S. Commerce Department's February 2026 countervailing review (C-570-054) set rates from 22.10% upward on Chinese foil, and India extended anti-dumping duties on foil up to 80 microns from four Asian countries to December 15, 2026. Duties can lapse or shift, so a project case should hold up without them. Buyers are flexible packaging converters, household brands, container makers, drugmakers and battery cell makers, and the last two pay most for qualified supply.
Aluminum foil manufacturing process from foilstock to finished coil
A foil plant is a sequence of cold-rolling passes that take metal from about a millimeter to a few microns, with each pass reducing thickness by roughly half at the thin end. The reference plant buys foilstock instead of casting it, which removes melting furnaces, cuts CapEx and shortens permitting.
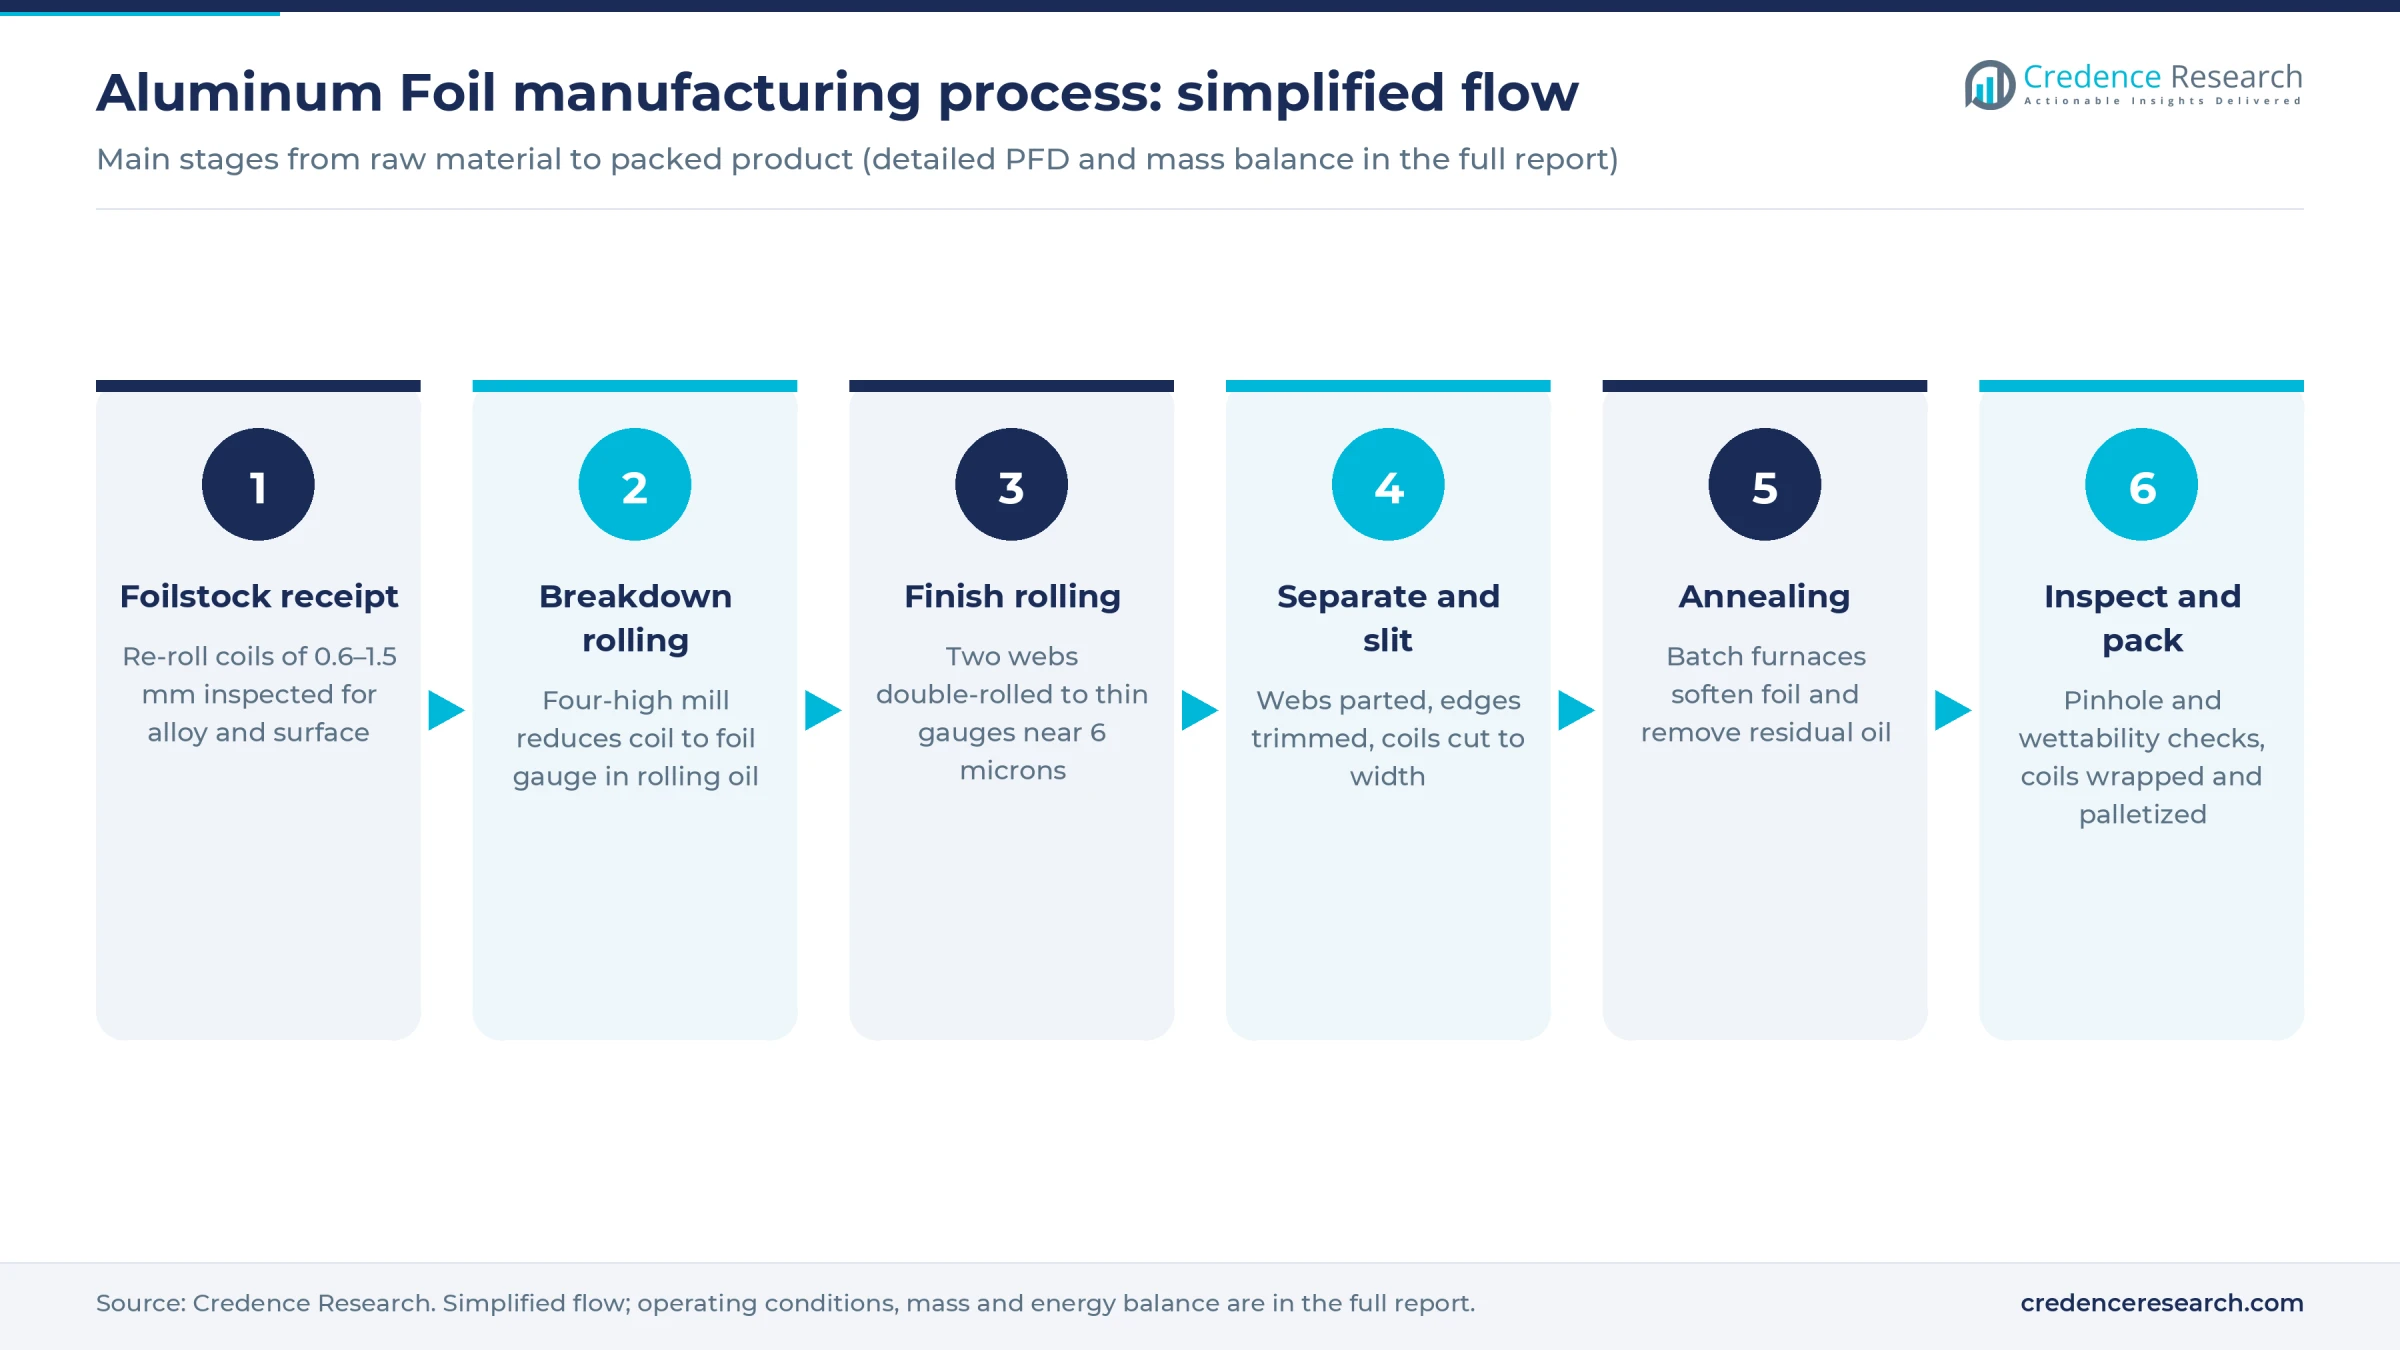
- Foilstock receipt and inspection. Coils of re-roll stock, typically 0.6–1.5 mm thick, are checked for alloy, gauge, flatness and surface. Inclusions that are invisible at this stage become pinholes later, so supplier quality sets the plant's yield.
- Breakdown rolling. A four-high mill takes the coil through several passes in rolling oil to foil gauge. Automatic gauge control and flatness control run throughout, and speeds on modern mills can reach about 2,500 meters a minute.
- Intermediate and finish rolling. Below roughly 25 microns, two webs are joined and rolled together in double rolling, which allows gauges of about 6 microns without tearing at speed. The rubbing inner faces turn matte, and the outer faces take the bright finish of the rolls.
- Separating and slitting. A separator parts the double-rolled webs and a slitter trims edges and cuts customer widths. Edge trim is baled and returned as scrap, which is why net yield matters more than gross yield.
- Annealing. Coils go into batch furnaces, where controlled heating restores softness and drives off residual rolling oil. Soft foil has to come out clean enough to wet with lacquer and pass food-contact checks, and uneven annealing is a common source of rejected coils.
- Finishing and packing. Coils are inspected for pinholes and wettability, then wrapped and palletized. Some plants rewind household rolls or add lacquer and lamination, which raises value but adds solvent permits and a separate customer base.
Oil recovery is part of the process, not an accessory. A mill burns through large oil volumes without it, and a full recovery system lowers both cost and emissions. Fire protection on the mills is also essential because of the fine oil mist.
Aluminum foil plant setup cost
The reference plant is a greenfield cold-rolling unit producing about 20,000 metric tons a year on two to three foil mills, with slitters, annealing furnaces and oil recovery. At this scale, total CapEx is estimated at USD 30–45 million, covering land, buildings, utilities, environmental systems, preoperative cost and a working capital margin.
The range is scaled from disclosed projects. A 2026 expansion at Luoyang Wanji in China added 20,000 metric tons a year for about 200 million yuan, or close to USD 1,400 per metric ton of capacity, on an existing site. Henan Zhongfu's June 2026 specialty project budgets 365 million yuan for 30,000 metric tons, close to USD 1,700. Those figures imply about USD 28–34 million for 20,000 metric tons in China, before adding land, greenfield works and the higher cost of equipment and construction elsewhere. Shyam Metalics' roughly USD 90 million for 18,000 metric tons of foil plus 60,000 metric tons of flat-rolled capacity in India offers a cross-check. U.S. and EU sites usually land above the top of the range.
For the land row, the plant needs about 10 acres, or 40,000 square meters, for the mill hall, annealing bay, coil storage and truck access. At an assumed USD 40–100 per square meter in an Asian industrial park, land costs about USD 1.6–4 million, close to 6% of CapEx at mid-range. Prices in U.S. and European parks vary too widely by site for one figure, and the report can be customized to any country or region.
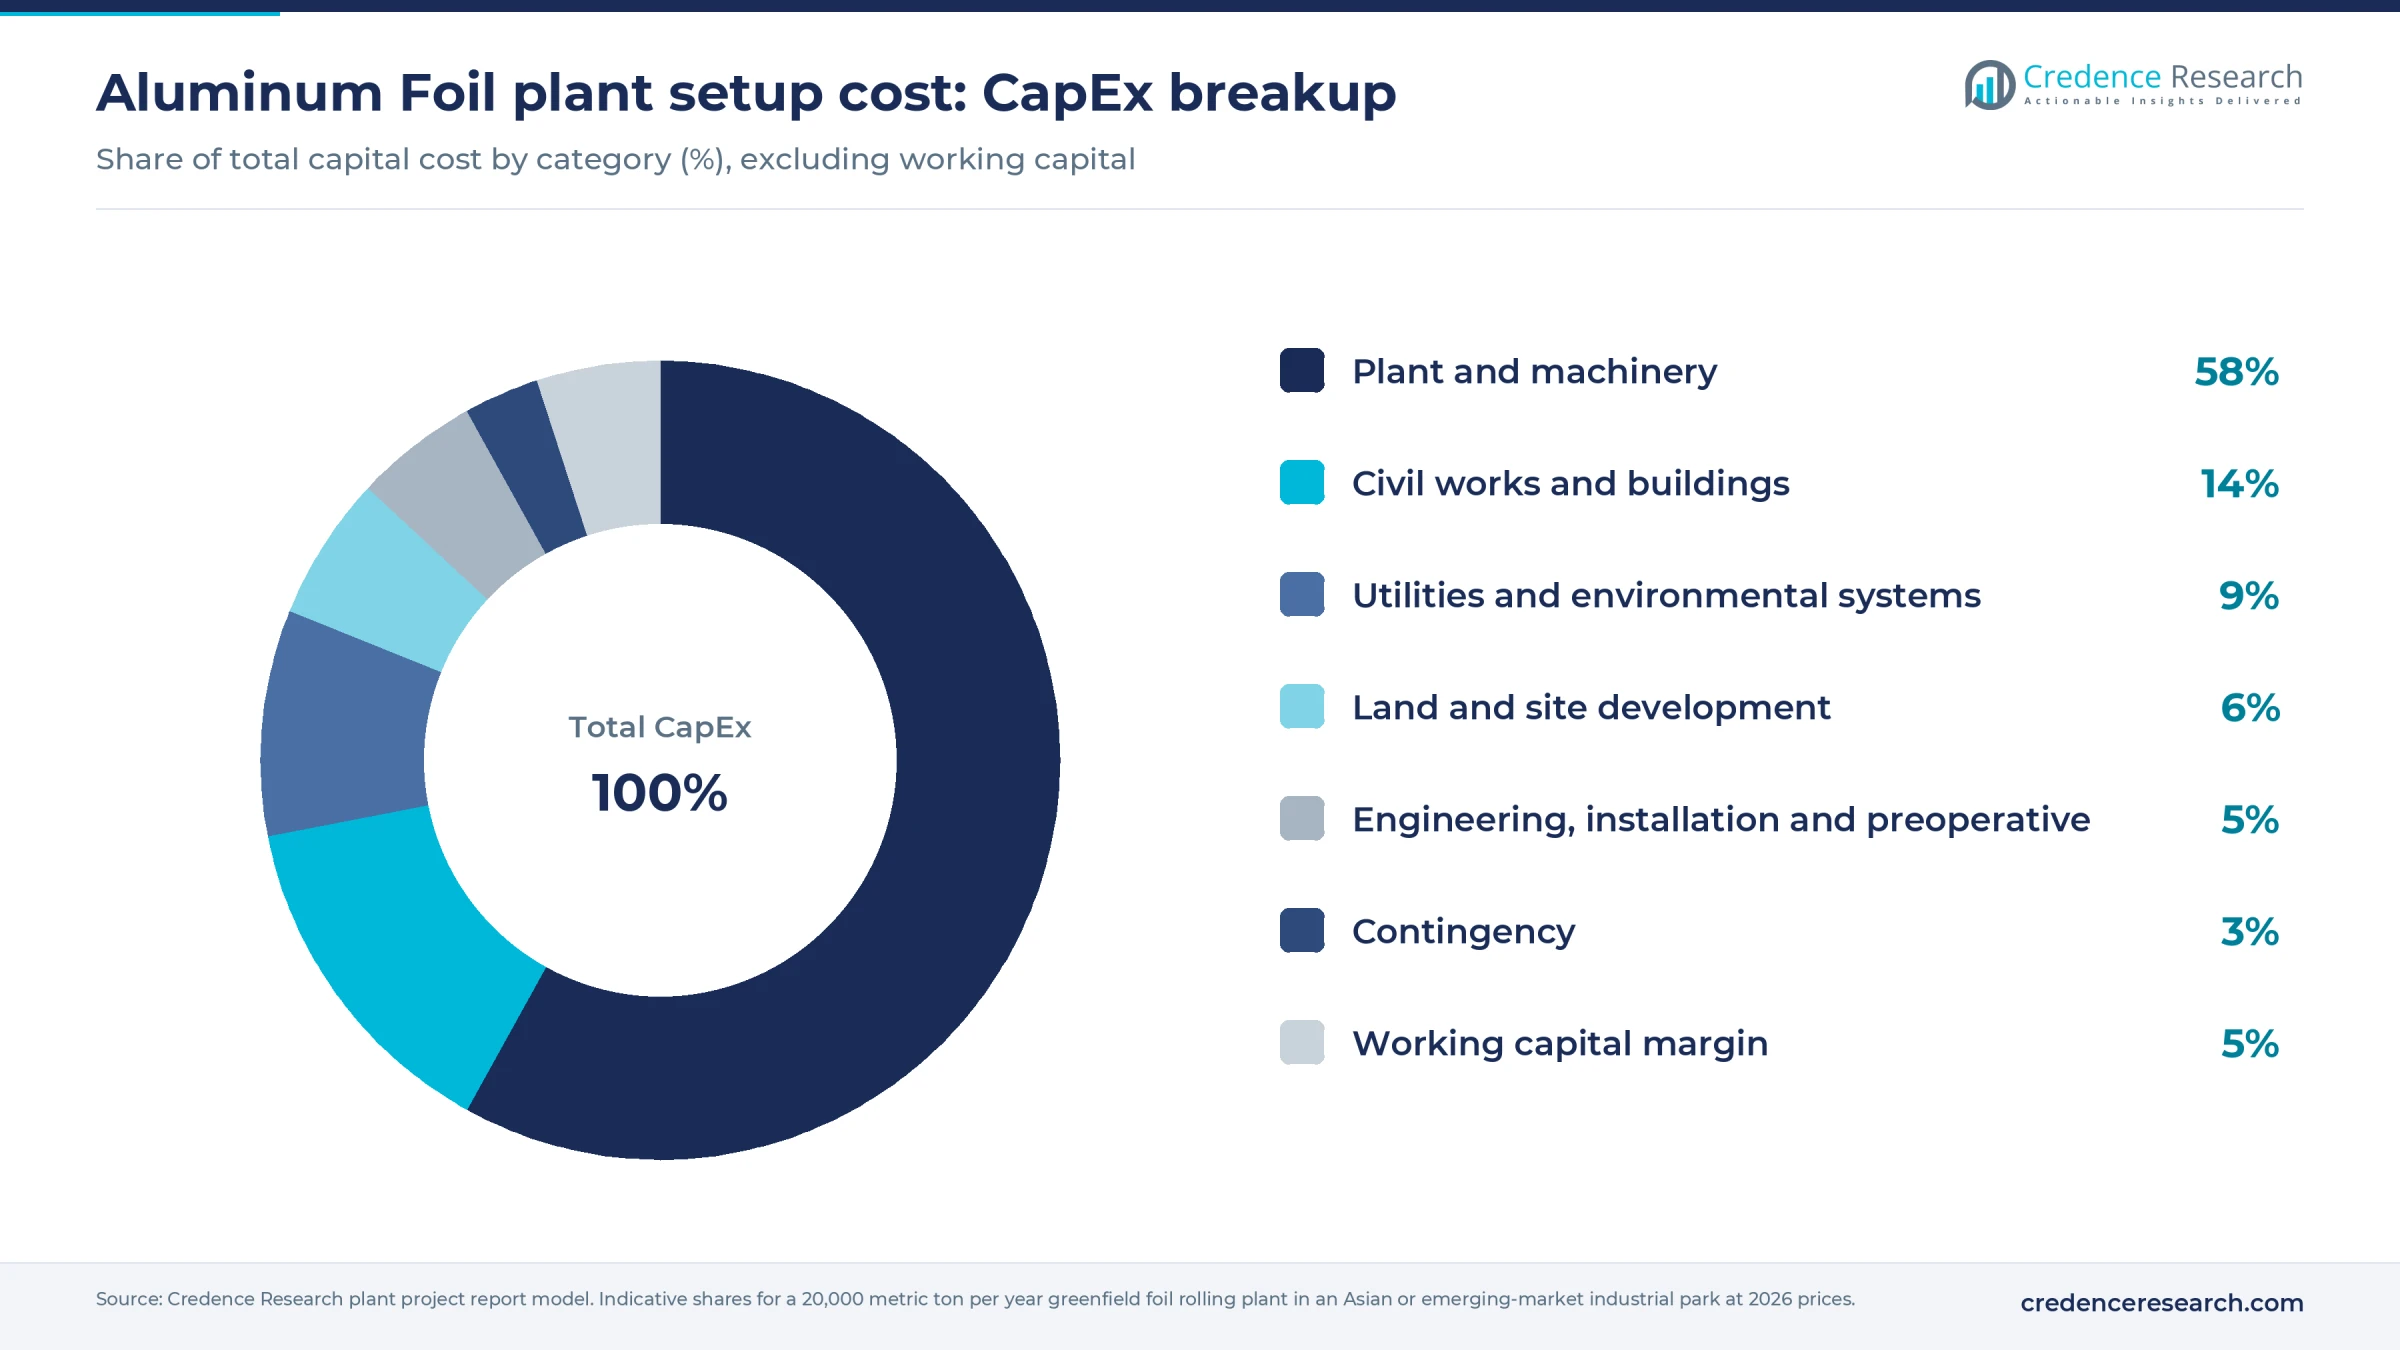
Plant and machinery take about 58% of CapEx, and the mills drive that share, so the choice between premium and lower-cost builders moves the total more than any civil work does. The working capital line is only a margin. One month of foilstock at full rate is worth about USD 6 million, so metal financing needs its own bank line.
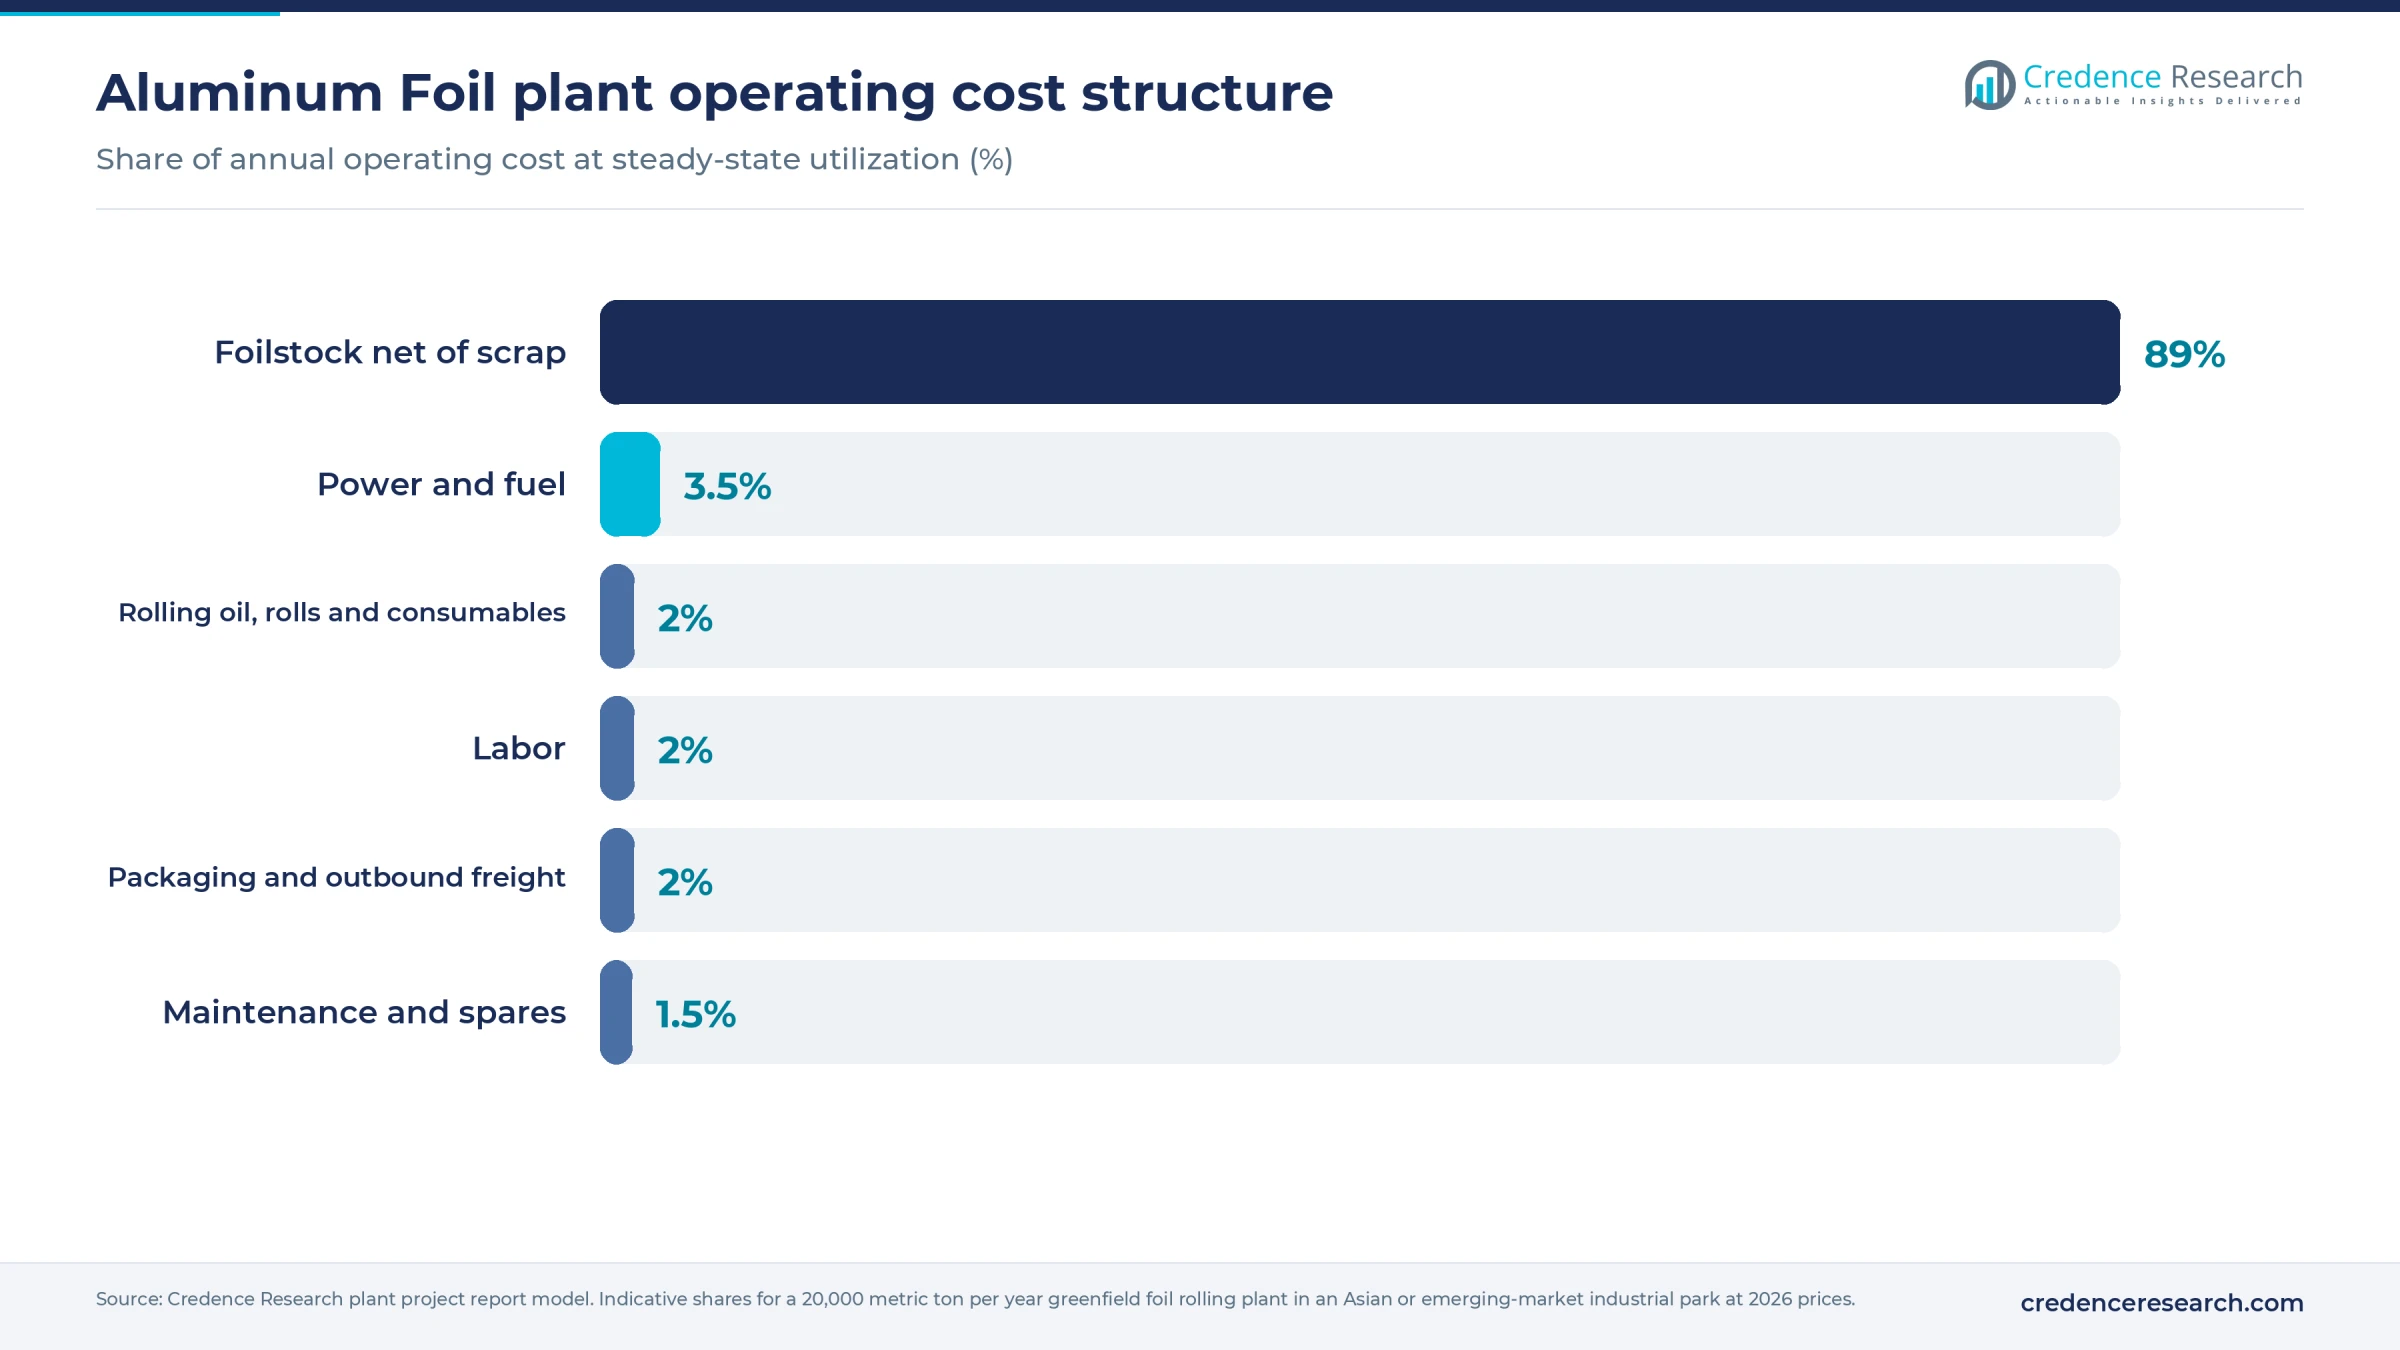
Foilstock makes up about 89% of operating cost, while power, oils, labor and maintenance share the rest. Those smaller items are where the plant can actually out-perform a rival.
Machinery and raw materials for an aluminum foil plant
The main equipment groups are listed below. Mill widths, speeds and the full equipment schedule are in the report.
- Four-high foil rolling mills for breakdown, intermediate and finish passes, with gauge and flatness control
- Doubler and separator lines for double-rolled gauges
- Slitters with edge trim handling and scrap baler
- Batch annealing furnaces with controlled atmosphere and exhaust handling
- Roll grinder and roll shop
- Rolling oil filtration and full oil recovery system
- Mill fire suppression, compressors, cooling towers and substation
- Pinhole detection, wettability testing and a coil packing line
Foilstock in 1xxx and 8xxx alloys comes from twin-roll casters and hot-rolling lines in China, India, the Gulf states, Turkey, Europe and the United States. Primary metal behind it comes mainly from China, India, the Gulf, Russia and Canada. Rolling oils and additives are bought from global lubricant suppliers, and food-contact grades need supplier documentation.
Sourcing is the main strategic choice. Chinese stock is widely available but may carry trade remedies into some destinations and raises origin questions for buyers, while local stock can cost more and comes from fewer mills. Scrap sold back to secondary aluminum alloy producers or the stock supplier recovers most of the metal value lost in trimming.
Aluminum foil business profit margin and ROI
At central direct cost, gross margin for the reference plant is estimated at 6–12%, and the full cost range widens that to about 0–18%, measured as selling price minus foilstock, yield loss and direct conversion cost. The build starts from 2024 export unit values for HS 7607 of about USD 3,660 per metric ton for China, USD 3,940–4,400 for Thailand, Turkey and Greece and USD 6,280 for Germany, where more converted product lifts the average. Aluminum averaged USD 2,421 in 2024 on the IMF global price series, and LME cash was near USD 3,050 in late October 2026. Adding that roughly USD 630 rise lifts China to about USD 4,300 and the middle group to about USD 4,570–5,030. A new plain foil mill competes near export pricing, so its price is assumed at USD 4,300–4,600.
Against that, foilstock is assumed at USD 3,450–3,750, net yield loss adds 3–5%, and power, oil, labor, maintenance, packing and freight add an assumed USD 230–350. Total direct cost centers on about USD 4,035 per metric ton, within USD 3,780–4,290.
At 85% utilization, or 17,000 metric tons, cash profit after assumed overheads of about USD 100 per metric ton is roughly USD 3–8 million a year, so mid-range CapEx of USD 37.5 million pays back in about 5–13 years. Because metal largely passes through, the conversion fee is the key sensitivity: USD 100 per metric ton moves annual cash profit by about USD 1.7 million.
| Metric | Value |
|---|---|
| Gross margin | 6–12% |
| Payback period | 5–13 years |
| IRR (post-tax) | Available in report |
| NPV | Available in report |
| Return on investment | Available in report |
| DSCR | Available in report |
| Break-even utilization | Available in report |
How to start an aluminum foil business, licenses and approvals
The steps are broadly the same across countries: company and tax registration, land use and building permits, an environmental permit covering rolling oil emissions and wastewater, occupational safety and fire approvals, product certification or food-contact compliance, and import-export registration for stock and finished coils. Oil mist and fire risk get the most attention from regulators, and adding a melting line or a lacquering line brings stricter permits.
Examples by market
| Market | Key approvals for a foil rolling plant |
|---|---|
| United States | State air permit under the Clean Air Act; EPA aluminum forming effluent rules at 40 CFR Part 467, including rolling with neat oils; FDA rules at 21 CFR 178.3910 for lubricants used to roll food-contact foil |
| European Union | National environmental permit, moving under the Industrial Emissions Directive if a casting line melts more than 20 metric tons a day; food-contact compliance under Regulation (EC) 1935/2004 and good manufacturing practice under Regulation (EC) 2023/2006 |
| India | Consent to establish and operate from the state pollution control board; BIS license and ISI Mark to IS 15392 for food packaging foil under the Aluminium Foil (Quality Control) Order, 2020; IS 16011 for pharmaceutical foil, which BIS lists among products notified for compulsory marking |
Food and drug customers also audit foil suppliers against packaging hygiene standards before approving a new mill, and that approval can take longer than the permits.
Key aluminum foil manufacturers and recent developments
China supplies most of the world's foil through Jiangsu Dingsheng New Materials, Henan Zhongfu, Luoyang Wanji and Jiangsu Zhongji Lamination. Elsewhere, leading makers include Symetal in Greece, Assan Aluminyum in Turkey, Toyo Aluminium in Japan and Hindalco in India. Converters then turn plain coil into products such as foil laminated paper and pharmaceutical blister packs.
- January 2026: Hindalco commissioned a battery-grade foil plant in Odisha, India, within a roughly USD 510 million flat-rolled and foil project, designed to support up to 100 GWh of lithium-ion cell capacity.
- June 2026: Henan Zhongfu approved a 365 million yuan line for 30,000 metric tons a year, mainly battery pouch film foil with electronic and pharmaceutical grades, over a two-year build.
- July 2026: Shyam Metalics began commercial production at an 18,000 metric ton foil plant in Sambalpur, India, rolling 6–40 micron foil, with a 60,000 metric ton flat-rolled phase to follow.
New capacity is concentrated in battery and specialty grades, so plain foil competition is likely to remain price-led.
What's inside the Aluminum Foil project report PDF
The report runs to 21 chapters. Open a chapter to see its sections.
1. Preface
2. Scope and Methodology
- 2.1 Objectives of the Study
- 2.2 Stakeholders
- 2.3 Research Methodology
- 2.4 Data Sources and Key Assumptions
3. Executive Summary
- 3.1 Market Snapshot
- 3.2 Project at a Glance (Capacity, CapEx, OpEx)
- 3.3 Key Financial Indicators (IRR, NPV, Payback, Break-even)
- 3.4 Feasibility Verdict
4. Product Overview
- 4.1 Aluminum Foil Definition and Properties
- 4.2 Grades and Specifications (BIS / ISO / ASTM)
- 4.3 HS Code and Classification
- 4.4 Key Applications
- 4.5 Substitutes
5. Global Aluminum Foil Market
- 5.1 Market Overview
- 5.2 Historical and Current Market Performance (Volume and Value)
- 5.3 Market Breakup by Grade / Type
- 5.4 Market Breakup by End-Use Industry
- 5.5 Market Breakup by Region
- 5.6 Market Drivers, Restraints and Trends
- 5.7 Value Chain Analysis
- 5.8 Market Forecast
6. Target Country Aluminum Foil Market Analysis
- 6.1 Demand and Supply Analysis
- 6.2 Installed Capacity vs Demand Gap
- 6.3 Import Dependence
- 6.4 Demand Forecast by End-Use
7. Trade Analysis
- 7.1 Imports by Volume, Value and Country
- 7.2 Exports by Volume, Value and Country
- 7.3 Trade Balance and Opportunities
8. Price Analysis
- 8.1 Historical Aluminum Foil Price Trends by Region
- 8.2 Raw Material / Feedstock Price Trends and Linkage
- 8.3 Price Forecast
- 8.4 Margins Across the Value Chain
9. Competitive Landscape
- 9.1 Market Structure
- 9.2 Key Players and Installed Capacities
- 9.3 Profiles of Key Players
- 9.4 Recent Developments (Expansions, M&A, New Plants)
10. Manufacturing Process and Technology
- 10.1 Comparison of Technology Routes
- 10.2 Selected Route and Process Flow Diagram
- 10.3 Unit Operations Involved
- 10.4 Chemical Reactions Involved
- 10.5 Mass Balance and Raw Material Requirements
- 10.6 Energy Balance
- 10.7 Quality Assurance Criteria and Technical Tests
- 10.8 By-products and Waste Handling
- 10.9 Technology Licensors / Providers
11. Project Details, Requirements and Costs
- 11.1 Land, Location and Site Development
- 11.1.1 Site Selection Criteria
- 11.1.2 Location Analysis
- 11.1.3 Land Requirement and Costs
- 11.1.4 Site Development Costs
- 11.2 Plant Layout
- 11.2.1 Layout Principles
- 11.2.2 Proposed Layout
- 11.2.3 Factors Influencing Layout
- 11.3 Civil Works and Buildings
- 11.4 Plant Machinery
- 11.4.1 Machinery Requirements and Specifications
- 11.4.2 Machinery Costs
- 11.4.3 Machinery Suppliers
- 11.5 Raw Materials
- 11.5.1 Requirements per Tonne of Output
- 11.5.2 Procurement and Sourcing
- 11.5.3 Costs
- 11.5.4 Suppliers
- 11.6 Packaging
- 11.6.1 Packaging Requirements
- 11.6.2 Packaging Costs
- 11.6.3 Packaging Suppliers
- 11.7 Storage and Material Handling
- 11.8 Transportation Requirements and Costs
- 11.9 Utilities
- 11.9.1 Power Requirements and Costs
- 11.9.2 Water Requirements and Costs
- 11.9.3 Steam, Fuel and Other Utilities
- 11.10 Manpower Requirements and Wages
12. Environment, Health, Safety and Sustainability
- 12.1 Effluent and Emissions Management
- 12.2 Hazard Classification and Safety Measures
- 12.3 Carbon Footprint
- 12.4 Green / Low-Carbon Process Options
13. Regulatory Procedures, Approvals and Certifications
- 13.1 Licences and Registrations
- 13.2 Environmental Clearances
- 13.3 Product Certifications (BIS, REACH, etc.)
- 13.4 Approval Timeline
14. Project Implementation Schedule
15. Project Economics
- 15.1 Capital Cost of the Project
- 15.2 Techno-Economic Parameters
- 15.3 Capacity Utilization and Ramp-up
- 15.4 Product Pricing and Margins
- 15.5 Income Projections
- 15.6 Expenditure Projections
- 15.7 Working Capital Requirement
- 15.8 Taxation
- 15.9 Depreciation
16. Financial Analysis
- 16.1 Projected Profit and Loss Account
- 16.2 Projected Cash Flow Statement
- 16.3 Projected Balance Sheet
- 16.4 Liquidity Analysis
- 16.5 Profitability Analysis (Payback, NPV, IRR, ROI)
- 16.6 Break-even Analysis
- 16.7 Debt Service Coverage Ratio (DSCR)
- 16.8 Sensitivity Analysis
- 16.9 Scenario and Uncertainty Analysis
17. Funding and Incentives
- 17.1 Means of Finance and Debt-Equity Structure
- 17.2 Loans and Financial Assistance
- 17.3 Government Schemes and Subsidies (PLI, State Policies)
18. Risk Assessment
- 18.1 Key Success Factors
- 18.2 Key Risk Factors
- 18.3 Risk Mitigation
19. Strategic Recommendations
20. Case Study of a Successful Venture
21. Appendix
- 21.1 Detailed Assumptions
- 21.2 Abbreviations
- 21.3 List of Tables and Figures
- 21.4 Sources
This page vs. the full report
| Data point | On this page (free) | In the full report |
|---|---|---|
| Total CapEx | One rounded range at one capacity | Exact figure at three capacities with a line-item breakup |
| CapEx breakup | Category shares (%) only | Cost, quantity and supplier for every machine |
| Operating cost | Share of raw materials, utilities and labor | Per-unit cost sheet with each input price and consumption |
| Profitability | Gross margin range and payback band | Exact IRR, NPV, ROI, break-even and DSCR |
| Financial statements | List of what is included | 10-year P&L, cash flow, balance sheet and Excel model |
| Sensitivity | One directional line | Full sensitivity and scenario tables |
| Process | Simplified flow diagram | Detailed process flow, mass and energy balance, operating conditions |
| Machinery | Names of the main machines | Specifications, capacity, cost and supplier list |
| Market | Headline size, growth and India demand trend | Segment, region, trade and price forecast tables |
| Suppliers and buyers | Supplier types and sourcing hubs | Named suppliers and buyers |
Aluminum Foil project report: FAQs
How much does it cost to set up an aluminum foil manufacturing plant?
Does a new foil plant need its own casting line?
What is the profit margin in aluminum foil manufacturing?
What is the payback period for an aluminum foil plant?
Which approvals does an aluminum foil plant need?
Where do foil makers source foilstock?
How do anti-dumping duties affect a new foil project?

About the analyst
Satyabrat Rajawat, Senior Research Analyst – Strategic Advisory
Satyabrat Rajawat is a Senior Research Analyst in the Strategic Advisory practice at Credence Research Inc. He works across domains, with the deepest coverage in packaging, automotive parts and machinery, and sits at the point where a client question becomes a research plan: he works with sales and business development teams to scope RFP and RFI responses, set the project methodology, and then build the quantitative databases and econometric forecasts that answer it.
Related market research
- Aluminum Foil Packaging Market Size, Share and Forecast 2032
- Aluminum Foil Laminated Paper Market Size, Share and Forecast 2032
- Aluminum Foil Zipper Pouch Market Size, Growth & Forecast 2032
- Pharmaceutical Blister Packaging Market Size, Share and Forecast 2032
- Secondary Aluminum Alloys Market Size, Trends, Share and Forecast 2032
- Aluminum Alloys Market Size, Trends, Share and Forecast 2032
More plant project reports
- PET Bottle Manufacturing Plant Project Report (DPR) 2026
- Copper Wire Manufacturing Plant Project Report (DPR) 2026
- Cigarette Lighter Manufacturing Plant Project Report (DPR) 2026
- Bread Manufacturing Plant Project Report (DPR) 2026
- Chocolate Manufacturing Plant Project Report (DPR) 2026
- Biofertilizer Manufacturing Plant Project Report (DPR) 2026