
Quick answer
A chocolate plant mixes cocoa liquor, cocoa butter, sugar and milk solids, then refines, conches, tempers and molds the mass. This overview models a greenfield plant making 10,000 tonnes a year from purchased cocoa ingredients, with estimated CapEx of USD 25–55 million. Gross margin is estimated at 15–25% on assumed prices, with payback at 4–10 years. Cocoa swings and weak volumes are the main risks.
Viable for a producer with contracted customers, cocoa price pass-through and a retail, private-label or couverture mix; an unbranded new entrant buying cocoa unhedged in a shrinking market carries real risk.
Chocolate plant: key highlights
| Parameter | Indicative value | Note |
|---|---|---|
| Plant capacity | 10,000 tonnes of chocolate per year | About 33 tonnes a day over 300 operating days, made from purchased cocoa liquor and butter, with no bean roasting or pressing |
| Total CapEx | USD 25–55 million | Greenfield, scaled from disclosed chocolate plants; excludes working capital. A small premium brand site in Australia costs far more per tonne |
| Raw material share of operating cost | 72–80% | Cocoa butter and liquor carry most of it; the share moves with the cocoa market |
| Gross margin | 15–25% | At an assumed USD 5–7 per kg blended price, with prices assumed to track cocoa costs |
| Payback period | 4–10 years | At 80% utilization, including an assumed one-year ramp-up; a high-CapEx build at the lowest profit falls well outside this band |
| IRR | Available in report | Post-tax, 10-year model |
| Break-even | Available in report | Capacity utilization basis |
Ranges assume a 10,000 tonnes-per-year greenfield plant, 300 operating days, 80% utilization and 2026 prices. Selling prices of USD 5–7 per kg, cocoa butter at USD 8–12 per kg, liquor at USD 6–8.5 per kg and land rates are assumed. Conversions use assumed rates of USD 1.15 per euro and USD 1.33 per pound. CapEx is scaled from disclosed plants and excludes working capital. The full report can be customized to any country or region.
What is chocolate?
Chocolate is a suspension of very fine cocoa and sugar particles in cocoa butter, solid at room temperature and melting near body temperature. That melting behavior is the product's main selling point and its main production problem, since it depends on how the fat crystallizes.
Three broad types dominate the category. Dark chocolate combines cocoa liquor, cocoa butter and sugar. Milk chocolate adds milk solids, and white chocolate uses cocoa butter without the non-fat cocoa solids. Couverture is a high-butter grade sold to bakers and chocolatiers, while compound coatings replace some cocoa butter with other fats and often cannot legally be called chocolate.
The Harmonized System places chocolate under heading 18.06. Subheading 1806.20 covers blocks and bulk preparations over 2 kg, 1806.31 filled bars and 1806.32 unfilled bars, with 1806.90 for other forms such as pralines. Buyers include grocery chains, travel retail, bakeries, biscuit and ice cream makers, and foodservice, where demand is tracked in Credence Research's foodservice chocolate analysis.
Chocolate market overview and global demand
Credence Research values the global market for chocolate at about USD 117 billion in 2025, based on its USD 111.9 billion for 2024 and a 4.6% CAGR, and expects USD 160.3 billion by 2032. Its narrower chocolate confectionery study puts that segment at USD 87 billion in 2024.
Value and volume are telling different stories. Barry Callebaut said on Nov. 4, 2026, that the chocolate confectionery market shrank 4.3% by volume in its fiscal year to August, including 5.8% in North America. Much recent value growth reflects higher prices rather than more tonnage, so a new plant should not read a dollar forecast as volume growth.
Europe is the main manufacturing center. Germany produced about 1.07 million tonnes of cocoa-containing products in 2024, according to its statistics office, and exported 981,400 tonnes while importing 525,400, which shows how heavily the region trades within itself. Euronews, citing Eurostat, reported 2025 exports of about EUR 3 billion from Belgium and EUR 2.5 billion from Poland. Newer capacity is spreading outward, as Barry Callebaut's plants in Serbia, Turkey, India and Indonesia show.
Cocoa supply has loosened after a severe shortage. The International Cocoa Organization's February 2026 bulletin estimated 2024/25 production at 4.728 million tonnes against grindings of 4.606 million, a 75,000-tonne surplus after a 492,000-tonne deficit. London futures, above GBP 10,000 per tonne in early 2025, stood near GBP 4,132 on Nov. 5, 2026, Business Recorder reported.
Chocolate manufacturing process
The modeled plant buys cocoa liquor and butter rather than handling beans, which removes roasting, winnowing and pressing, along with their capital and odor control. The steps below describe a molded and bulk line.
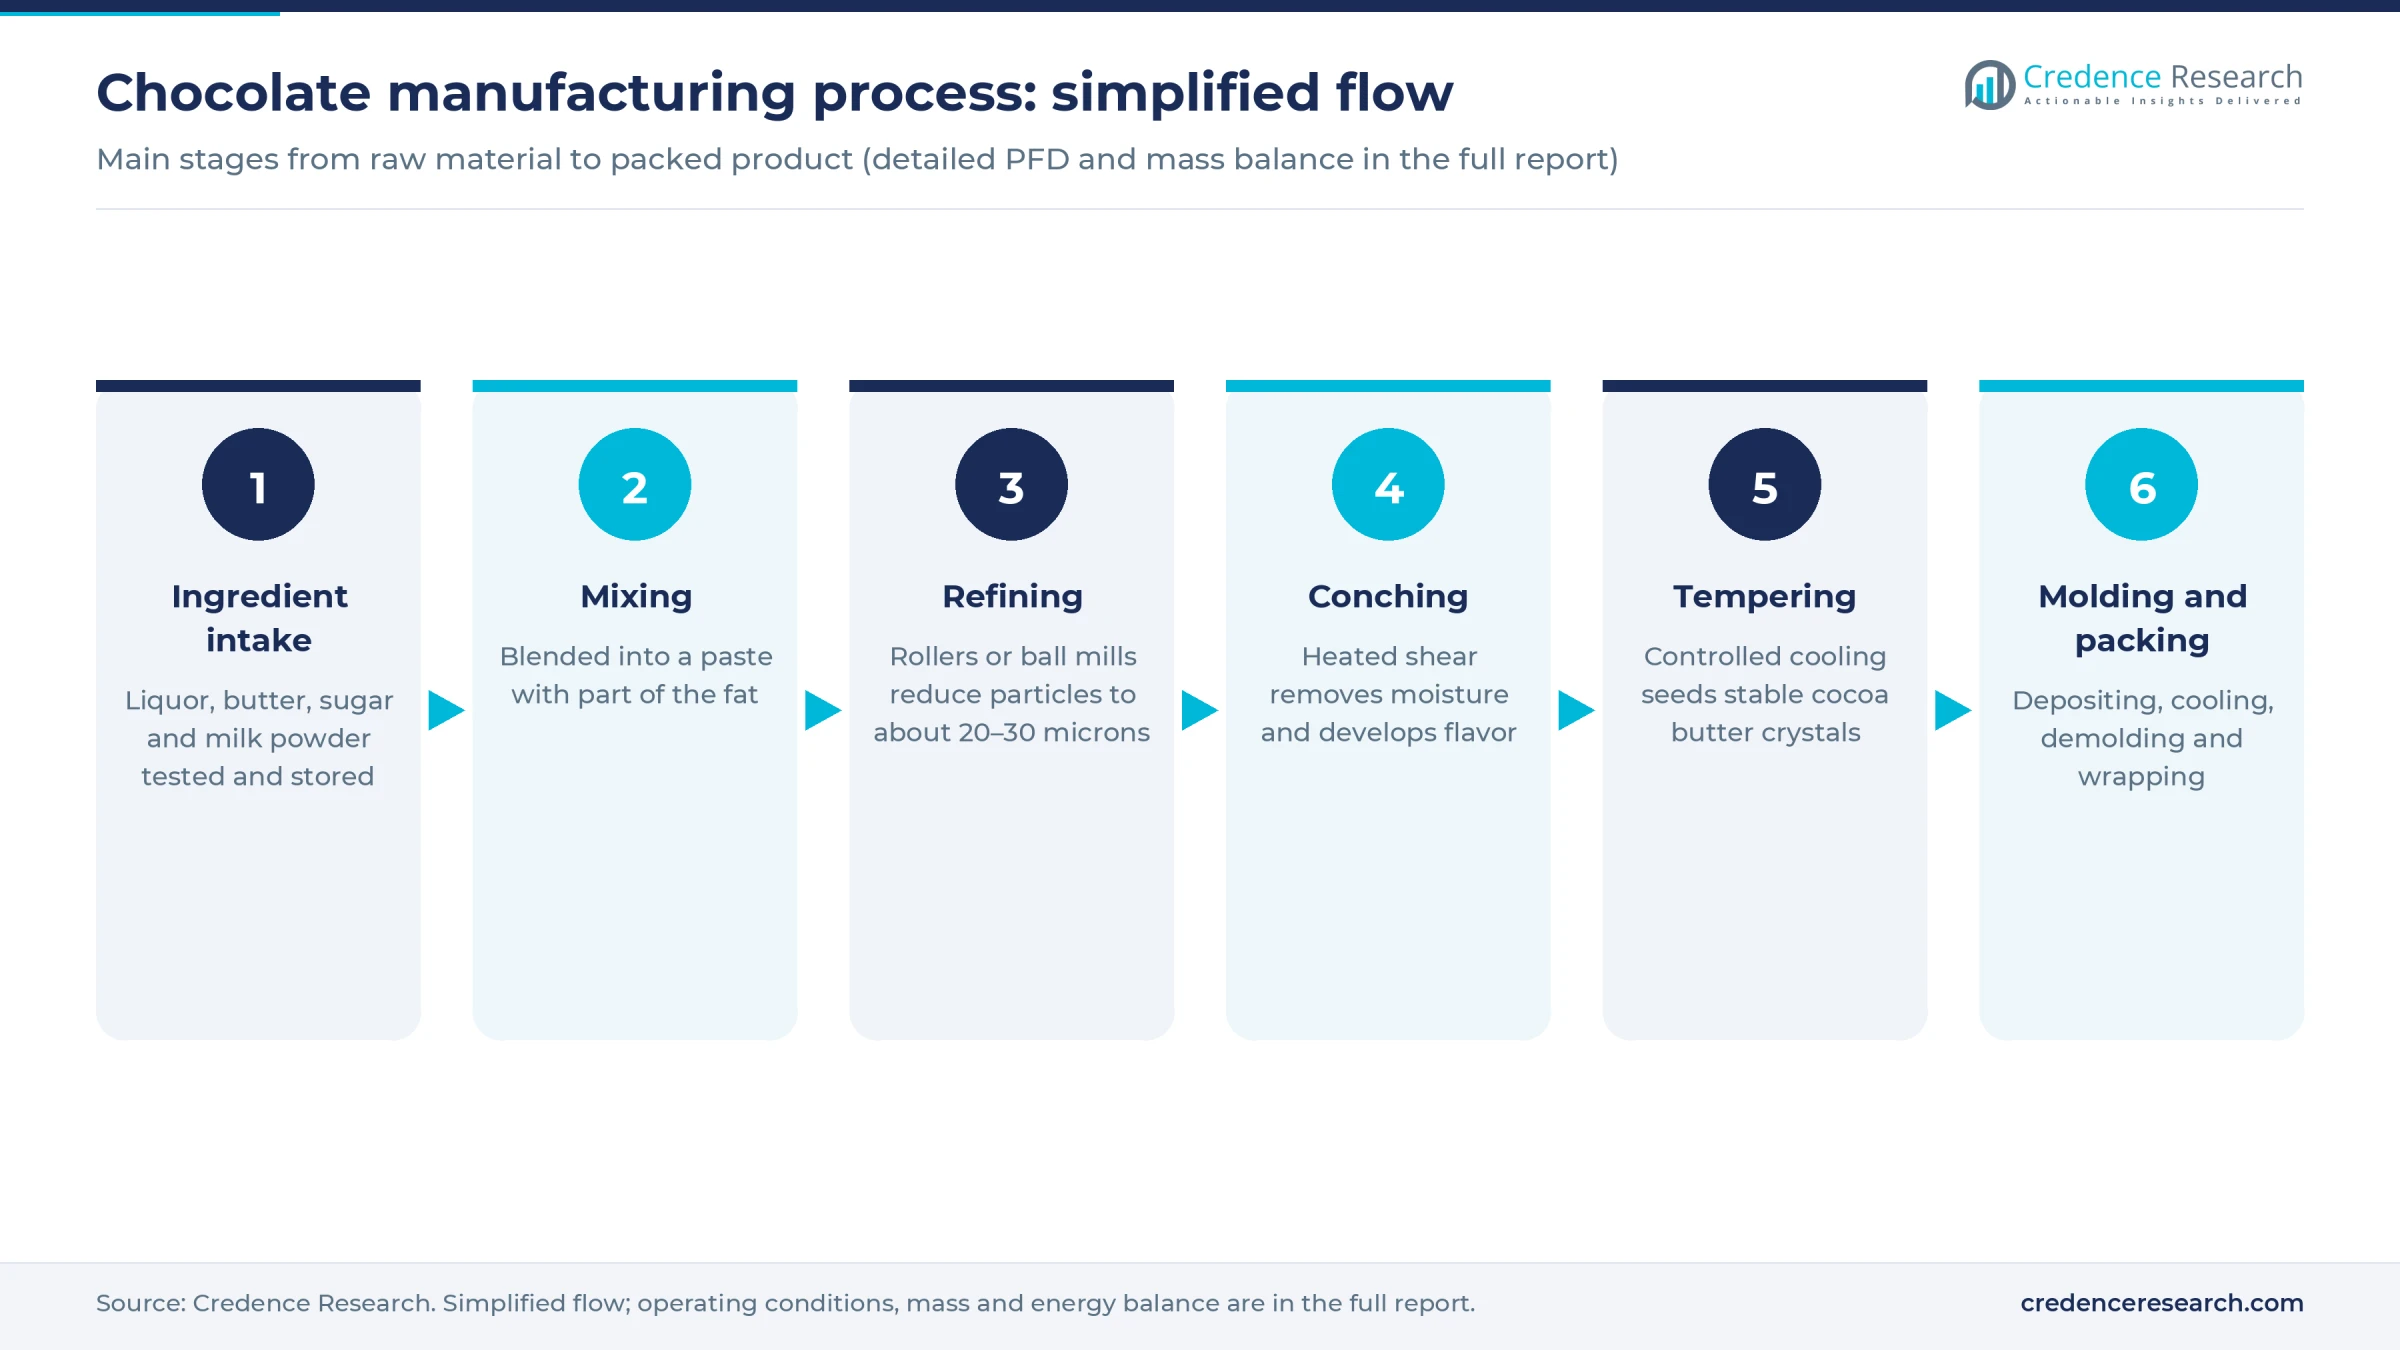
- Ingredient intake. Liquor and butter arrive in heated tankers or frozen blocks, with sugar and milk powder in silos or big bags. Lots are tested for moisture, flavor, microbes and heavy metals. Bean-to-bar makers add roasting and grinding upstream.
- Mixing. Ingredients are blended into a paste with part of the fat, in batches or continuously, to a texture the refiners can handle.
- Refining. Five-roll refiners or ball mills reduce particles to roughly 20–30 microns. Coarser mass feels gritty, while finer mass needs more fat to flow, and that fat is the costliest ingredient.
- Conching. Heated shear over several hours to more than a day drives off moisture and volatile acids and coats particles with fat. Lecithin and the remaining butter set viscosity. Conch time is a direct trade-off between flavor and throughput.
- Tempering. Controlled cooling and reheating seeds the stable crystal form of cocoa butter, typically finishing near 27–32°C depending on type. Poor temper causes bloom, soft texture and poor release from molds.
- Molding, cooling and packing. Chocolate is deposited into molds or enrobed over centers, vibrated, cooled in tunnels, demolded and wrapped, with metal detection. Bulk grades go out as blocks, drops or heated tankers.
Packing rooms need tight temperature and humidity control, and finished goods need cool storage and transport, so warm-climate plants carry more energy cost. Wet cleaning is limited, because water ruins chocolate and encourages microbial risk, which makes dry sanitation and salmonella control in raw materials the central food safety issues. Allergen changeovers among milk, nut and dairy-free lines also eat into productive hours.
Chocolate plant setup cost
This overview models a greenfield chocolate plant making 10,000 tonnes a year, about 33 tonnes a day, at an estimated total CapEx of USD 25–55 million. Disclosed benchmarks were scaled with an assumed 0.7 power rule, escalated to 2026 by assumed factors and converted at an assumed USD 1.15 per euro.
Three industrial plants set the base. Barry Callebaut's Novi Sad, Serbia, factory was reported at EUR 55 million for more than 50,000 tonnes in 2021, its Brantford, Canada, plant was planned at USD 104 million for more than 50,000 tonnes, and its 2013 Eskisehir, Turkey, factory at USD 17 million for 14,000 tons. These scale to about USD 20–39 million. They are large-group builds mostly for bulk output, so the range adds an assumed USD 5–15 million for retail molding and packing.
A fourth case supports the middle. Forbes Italia reported that ICAM's EUR 40 million expansion lifts capacity from about 30,000 to 50,000 tonnes. On a 10,000-tonne basis that is about USD 29 million, before the extra costs of a new site. Haigh's AUD 120 million Australian project, for a 2,000-tonne premium brand, shows how far specification can push cost, and sits outside this range.
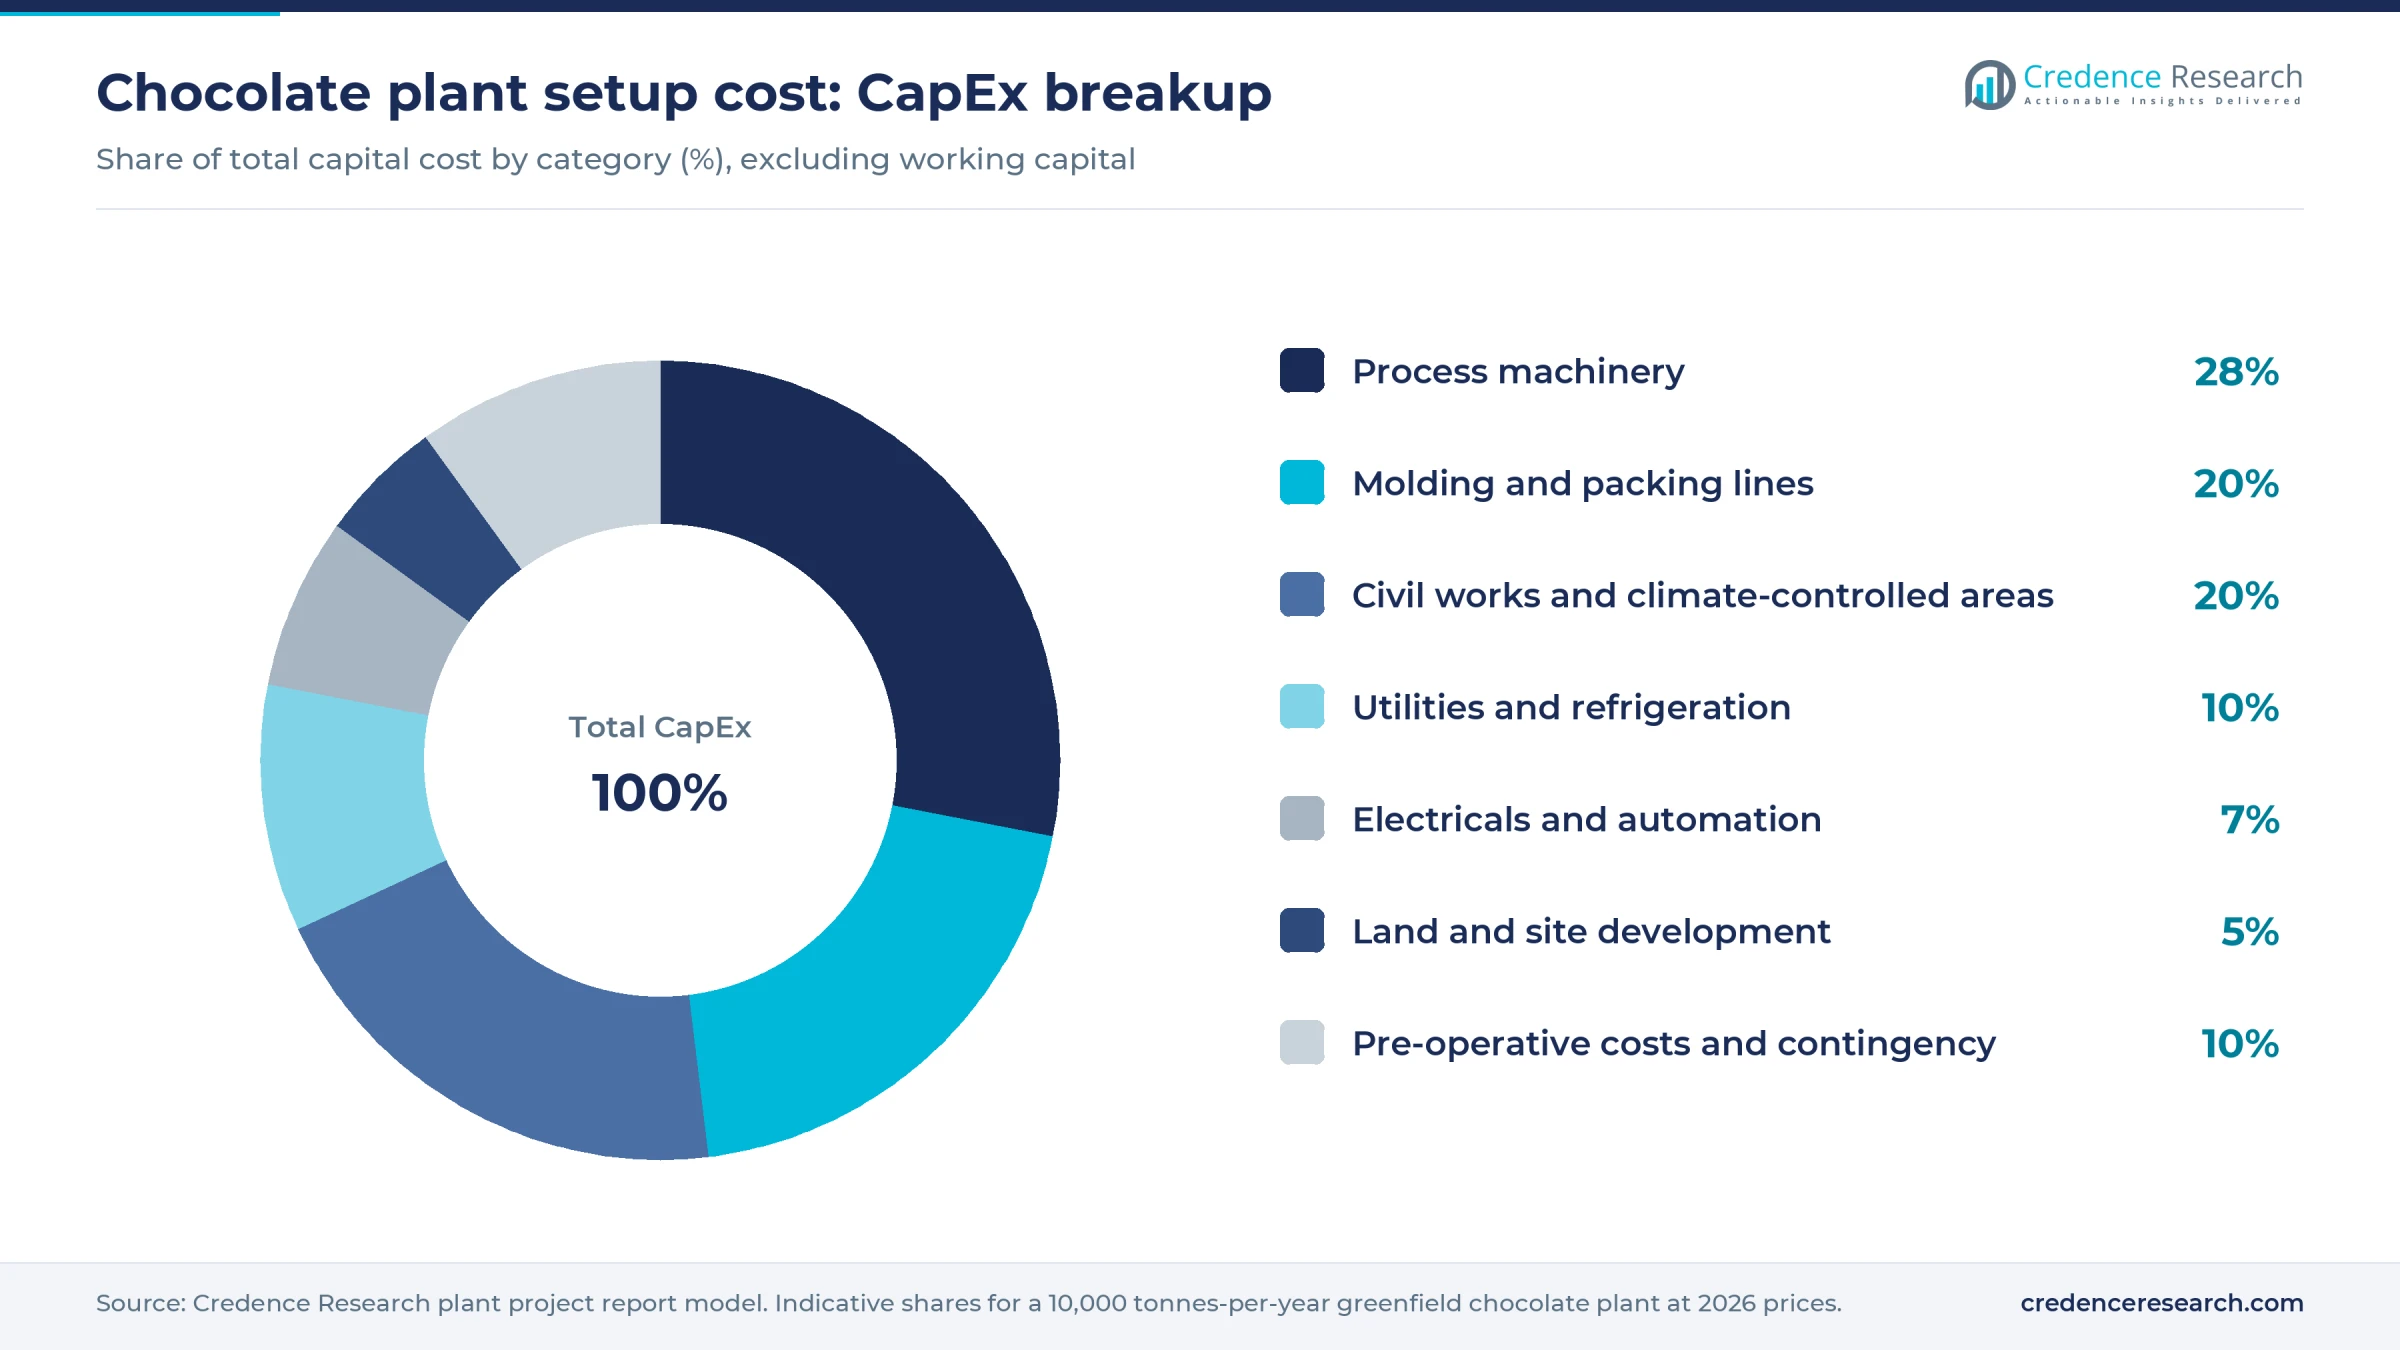
Worked example, land and site development. The plant needs an assumed 20,000–35,000 square meters. At an assumed USD 20–50 per square meter in an Asian industrial park, the plot costs about USD 0.4–1.8 million. At an assumed USD 30–80 at a U.S. or EU site, it costs about USD 0.6–2.8 million. Site works add an assumed USD 0.3–0.8 million, so this row usually runs 3–7% of CapEx.
Working capital adds an estimated USD 6–12 million for ingredient stock, seasonal finished goods and customer credit, and it rises sharply when cocoa does.
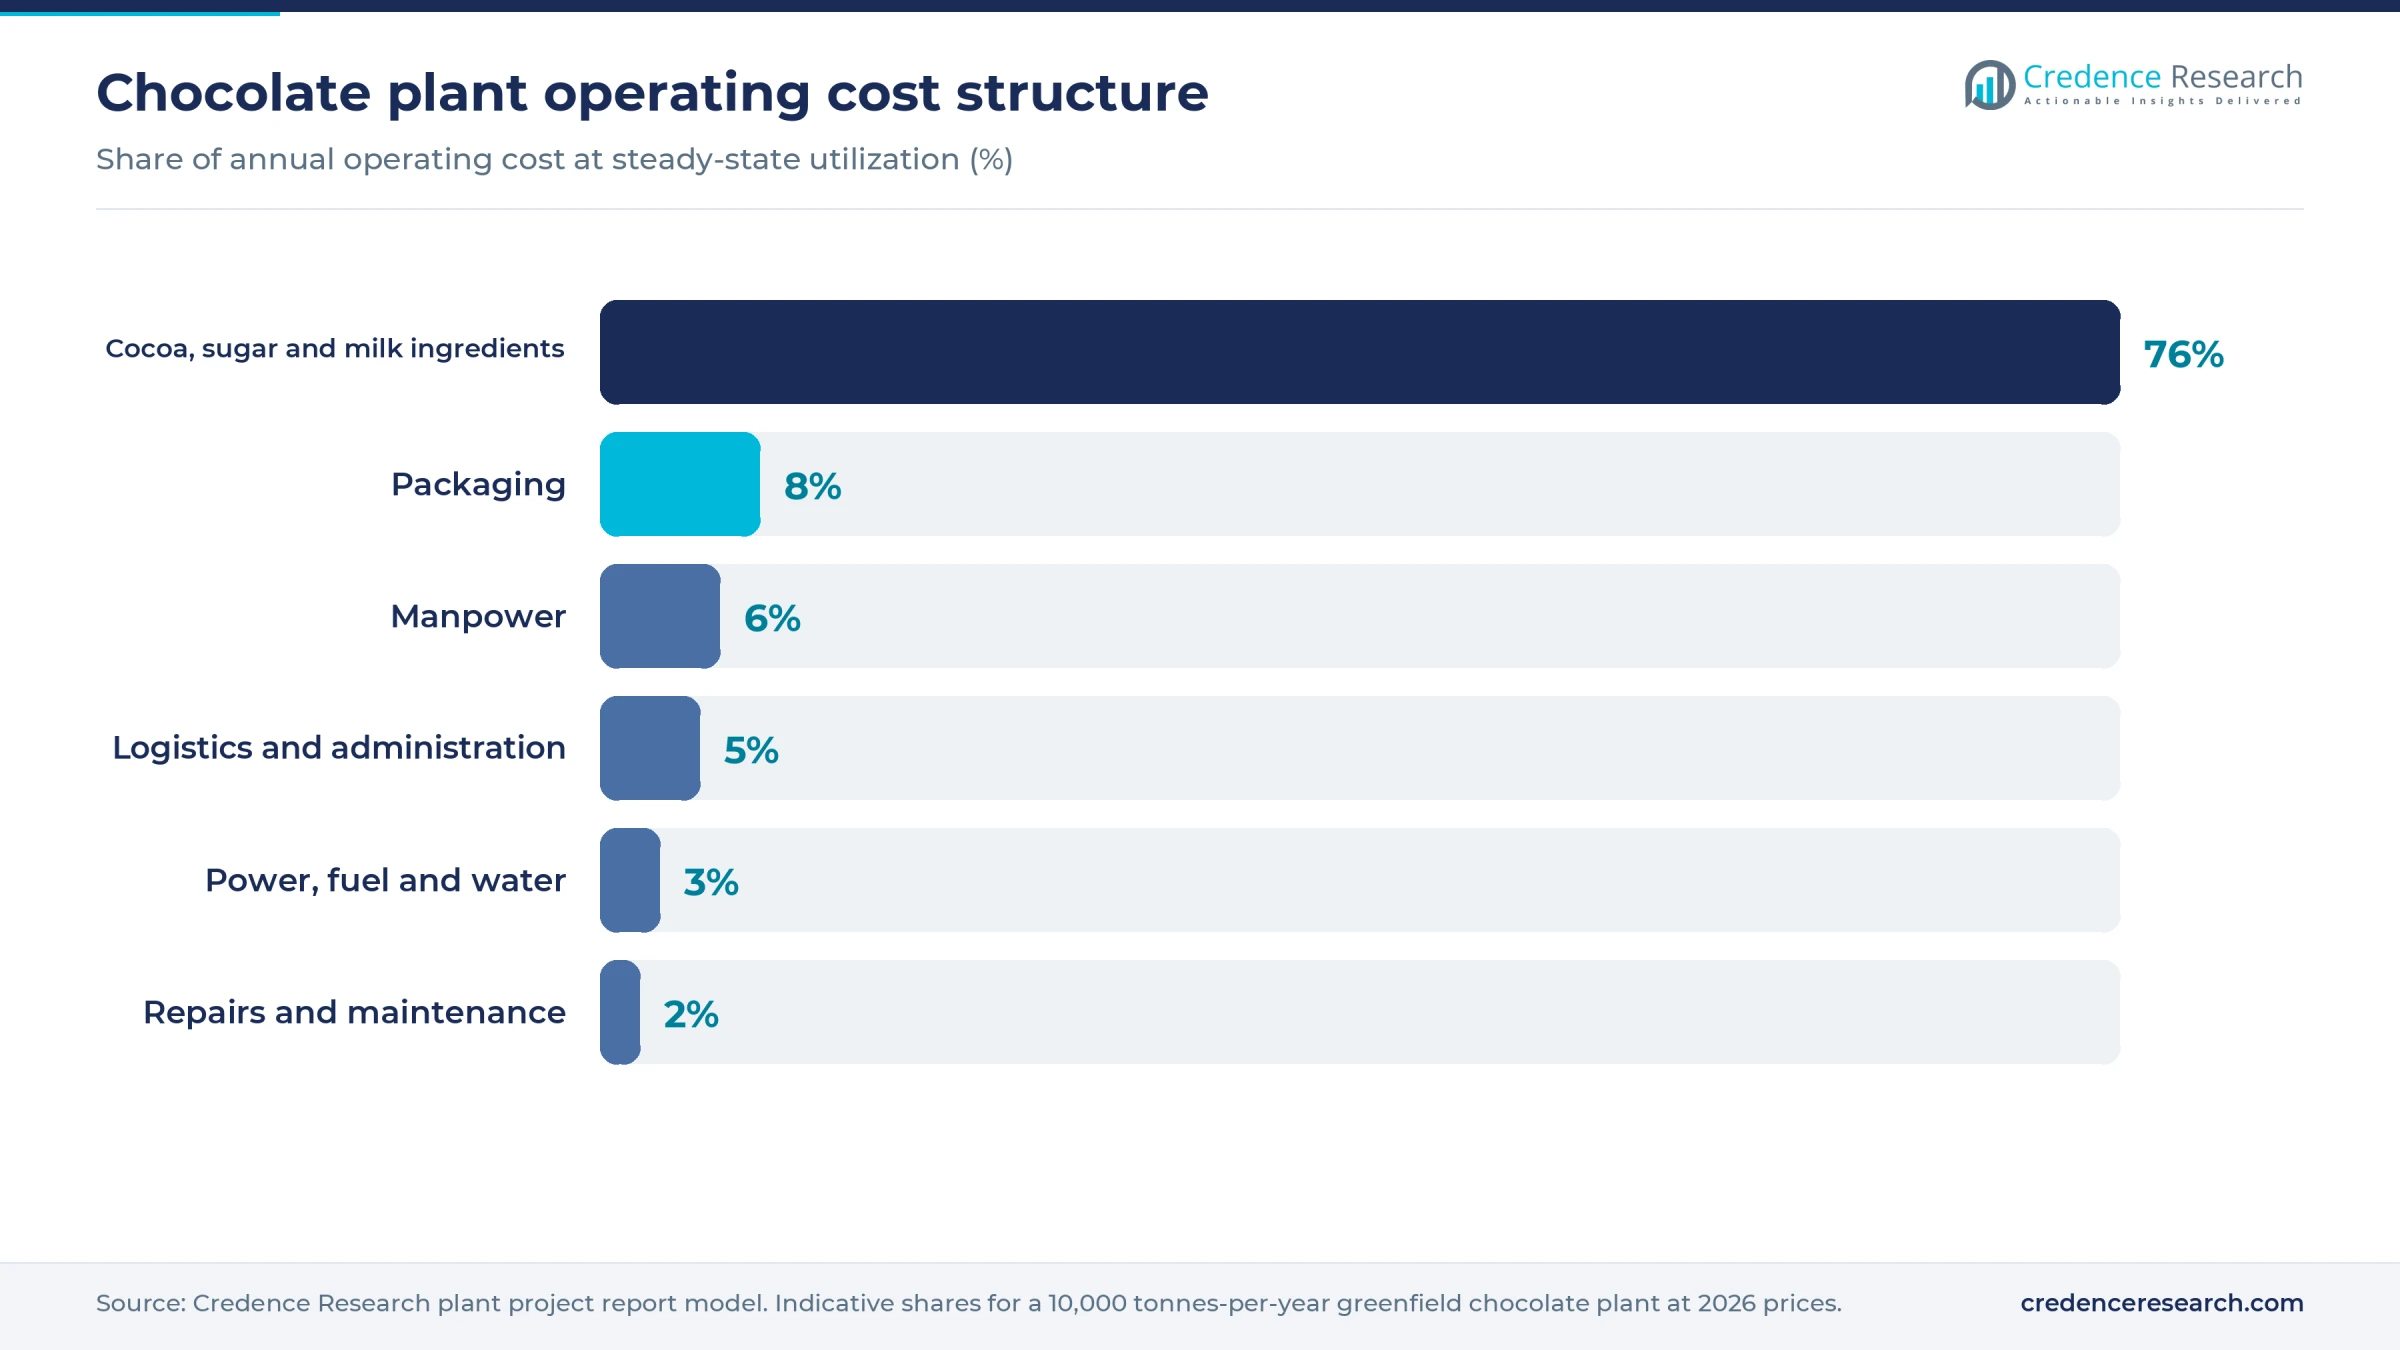
Cocoa ingredients dominate operating cost, so purchasing and hedging discipline usually matters more than savings on equipment.
Machinery and raw materials for a chocolate plant
The main machinery groups are listed below; capacities, specifications and quotations are available in the report. Suppliers and equipment trends are covered in Credence Research's processing equipment study.
- Intake: heated tanks, butter melters, sugar and milk powder silos, sieves and magnets
- Mass preparation: mixers, five-roll refiners or ball mills, and conches
- Finishing the mass: storage tanks, temperers and inclusion dosing
- Forming: depositors, mold circuits, enrobers, cooling tunnels and demolders
- Packing: flow-wrappers, cartoners, metal detectors, checkweighers and palletizers
- Utilities: chilled water, dehumidified air, hot water circuits, compressed air and dust control
West Africa supplies most of the world's beans, led by Cote d'Ivoire and Ghana, followed by Nigeria and Cameroon. Ecuador, Peru, Colombia and Brazil supply Latin American origins, and Indonesia remains the main Asian source. The Netherlands, Belgium, Malaysia and Indonesia are important grinding centers for the liquor and butter this plant would buy.
The World Bank's April 2026 data put world sugar at USD 0.32 per kg, against USD 0.38 in the EU and USD 0.77 in the U.S., a gap that can decide where a plant should sit. Milk powder comes from the EU, New Zealand and the U.S. Lecithin, vanilla flavor, inclusions and film are smaller purchases that trade globally.
Chocolate business profit margin and ROI
Gross margin after ingredients and direct conversion is estimated at 15–25%, at an assumed blended price of USD 5–7 per kg. After assumed overheads, 20% tax and a one-year ramp-up, cash profit of about USD 2.8–8 million gives a typical 4–10 year payback. A USD 55 million build at the lowest profit would take about 21 years.
Germany's production statistics offer one check. Output worth EUR 6.75 billion on 1.07 million tonnes works out to about EUR 6.30 per kg in 2024, or about USD 7.25, across every grade and brand. A new plant selling private-label bars and couverture should expect less, which is why the assumed range starts at USD 5.
Margins depend heavily on cocoa timing. Barry Callebaut said in July 2026 that average bean prices over nine months were 47% lower than a year earlier. Its model passes costs through to customers, but a smaller maker buying unhedged can be squeezed both ways, since falling prices leave expensive inventory and rising ones outrun contracts. Each USD 1,000 per tonne move in cocoa that cannot be passed on shifts gross margin by an estimated 7–12 percentage points.
Revenue of about USD 40–56 million on 8,000 tonnes supports gross profit of about USD 6–14 million before assumed overheads of USD 2.5–4 million. Branded sales raise the margin, but marketing costs absorb much of the gain.
| Metric | Value |
|---|---|
| Project IRR (post-tax) | Available in report |
| NPV | Available in report |
| Return on investment | Available in report |
| DSCR | Available in report |
| Break-even utilization | Available in report |
How to start a chocolate business, licenses and approvals
A chocolate plant needs approvals in six areas wherever it is built. These are business and tax registration; land use, zoning and building permits; an environmental permit covering boilers, wash water and any bean-roasting emissions; occupational safety approvals, including refrigeration and combustible sugar dust; food establishment registration with a documented safety plan; and customs registration for imports and exports. Customers commonly also ask for FSSC 22000 or BRCGS certification, plus kosher, halal, organic or cocoa sustainability certificates. Product names matter, because legal definitions of chocolate differ by market and can decide whether a recipe with other fats may use the word.
| Market | Food and product | Environment and safety |
|---|---|---|
| United States | FDA food facility registration; preventive controls under 21 CFR 117; cacao product standards under 21 CFR 163; foreign supplier verification for imported cocoa | Local pretreatment or NPDES permit; state air permit; OSHA workplace rules; California Proposition 65 warnings can arise from lead and cadmium |
| European Union | Directive 2000/36/EC, with chocolate at 35% minimum total cocoa solids, milk chocolate at 25% and other vegetable fats capped at 5%; hygiene under Regulation (EC) No 852/2004; cadmium limits under Regulation (EU) 2023/915 | National environmental and worker safety permits; deforestation due diligence under Regulation (EU) 2023/1115, applying from Dec. 30, 2026, for most operators and June 30, 2027, for certain micro and small ones |
| India | FSSAI license, central at this scale; chocolate standard under regulation 2.7.4, with vegetable fat capped at 5% and a mandatory label statement | State pollution control board consents to establish and operate; factory license and boiler registration |
Key chocolate manufacturers and recent developments
Mars, Mondelez, Ferrero, Hershey, Nestle and Lindt & Sprungli lead branded chocolate worldwide, with Meiji strong in Japan. Barry Callebaut, Cargill and Blommer dominate bulk supply to food companies, which is the segment a new plant most often competes with. Regional and specialty makers include ICAM in Italy, Fazer in Finland, which plans a EUR 400 million factory due by 2028, and Haigh's in Australia.
- February 2026. Barry Callebaut set out EUR 250 million for multi-year upgrades at Wieze, Belgium, and EUR 125 million for Halle, according to FoodBev, covering production lines, food safety and site infrastructure.
- May 2026. Mars detailed a GBP 190 million upgrade of its Slough, England, factory, spanning 2023–2028 and covering robotics, cooling and digital systems.
- November 2026. Barry Callebaut's board approved a greenfield site in Karawang, Indonesia, and a coatings expansion at Brantford, while proposing closures at Hendersonville, North Carolina, and Chester, England, by the second quarter of 2027.
What's inside the Chocolate project report PDF
The report runs to 21 chapters. Open a chapter to see its sections.
1. Preface
2. Scope and Methodology
- 2.1 Objectives of the Study
- 2.2 Stakeholders
- 2.3 Research Methodology
- 2.4 Data Sources and Key Assumptions
3. Executive Summary
- 3.1 Market Snapshot
- 3.2 Project at a Glance (Capacity, CapEx, OpEx)
- 3.3 Key Financial Indicators (IRR, NPV, Payback, Break-even)
- 3.4 Feasibility Verdict
4. Product Overview
- 4.1 Chocolate Definition and Properties
- 4.2 Grades and Specifications (BIS / ISO / ASTM)
- 4.3 HS Code and Classification
- 4.4 Key Applications
- 4.5 Substitutes
5. Global Chocolate Market
- 5.1 Market Overview
- 5.2 Historical and Current Market Performance (Volume and Value)
- 5.3 Market Breakup by Grade / Type
- 5.4 Market Breakup by End-Use Industry
- 5.5 Market Breakup by Region
- 5.6 Market Drivers, Restraints and Trends
- 5.7 Value Chain Analysis
- 5.8 Market Forecast
6. Target Country Chocolate Market Analysis
- 6.1 Demand and Supply Analysis
- 6.2 Installed Capacity vs Demand Gap
- 6.3 Import Dependence
- 6.4 Demand Forecast by End-Use
7. Trade Analysis
- 7.1 Imports by Volume, Value and Country
- 7.2 Exports by Volume, Value and Country
- 7.3 Trade Balance and Opportunities
8. Price Analysis
- 8.1 Historical Chocolate Price Trends by Region
- 8.2 Raw Material / Feedstock Price Trends and Linkage
- 8.3 Price Forecast
- 8.4 Margins Across the Value Chain
9. Competitive Landscape
- 9.1 Market Structure
- 9.2 Key Players and Installed Capacities
- 9.3 Profiles of Key Players
- 9.4 Recent Developments (Expansions, M&A, New Plants)
10. Manufacturing Process and Technology
- 10.1 Comparison of Technology Routes
- 10.2 Selected Route and Process Flow Diagram
- 10.3 Unit Operations Involved
- 10.4 Chemical Reactions Involved
- 10.5 Mass Balance and Raw Material Requirements
- 10.6 Energy Balance
- 10.7 Quality Assurance Criteria and Technical Tests
- 10.8 By-products and Waste Handling
- 10.9 Technology Licensors / Providers
11. Project Details, Requirements and Costs
- 11.1 Land, Location and Site Development
- 11.1.1 Site Selection Criteria
- 11.1.2 Location Analysis
- 11.1.3 Land Requirement and Costs
- 11.1.4 Site Development Costs
- 11.2 Plant Layout
- 11.2.1 Layout Principles
- 11.2.2 Proposed Layout
- 11.2.3 Factors Influencing Layout
- 11.3 Civil Works and Buildings
- 11.4 Plant Machinery
- 11.4.1 Machinery Requirements and Specifications
- 11.4.2 Machinery Costs
- 11.4.3 Machinery Suppliers
- 11.5 Raw Materials
- 11.5.1 Requirements per Tonne of Output
- 11.5.2 Procurement and Sourcing
- 11.5.3 Costs
- 11.5.4 Suppliers
- 11.6 Packaging
- 11.6.1 Packaging Requirements
- 11.6.2 Packaging Costs
- 11.6.3 Packaging Suppliers
- 11.7 Storage and Material Handling
- 11.8 Transportation Requirements and Costs
- 11.9 Utilities
- 11.9.1 Power Requirements and Costs
- 11.9.2 Water Requirements and Costs
- 11.9.3 Steam, Fuel and Other Utilities
- 11.10 Manpower Requirements and Wages
12. Environment, Health, Safety and Sustainability
- 12.1 Effluent and Emissions Management
- 12.2 Hazard Classification and Safety Measures
- 12.3 Carbon Footprint
- 12.4 Green / Low-Carbon Process Options
13. Regulatory Procedures, Approvals and Certifications
- 13.1 Licences and Registrations
- 13.2 Environmental Clearances
- 13.3 Product Certifications (BIS, REACH, etc.)
- 13.4 Approval Timeline
14. Project Implementation Schedule
15. Project Economics
- 15.1 Capital Cost of the Project
- 15.2 Techno-Economic Parameters
- 15.3 Capacity Utilization and Ramp-up
- 15.4 Product Pricing and Margins
- 15.5 Income Projections
- 15.6 Expenditure Projections
- 15.7 Working Capital Requirement
- 15.8 Taxation
- 15.9 Depreciation
16. Financial Analysis
- 16.1 Projected Profit and Loss Account
- 16.2 Projected Cash Flow Statement
- 16.3 Projected Balance Sheet
- 16.4 Liquidity Analysis
- 16.5 Profitability Analysis (Payback, NPV, IRR, ROI)
- 16.6 Break-even Analysis
- 16.7 Debt Service Coverage Ratio (DSCR)
- 16.8 Sensitivity Analysis
- 16.9 Scenario and Uncertainty Analysis
17. Funding and Incentives
- 17.1 Means of Finance and Debt-Equity Structure
- 17.2 Loans and Financial Assistance
- 17.3 Government Schemes and Subsidies (PLI, State Policies)
18. Risk Assessment
- 18.1 Key Success Factors
- 18.2 Key Risk Factors
- 18.3 Risk Mitigation
19. Strategic Recommendations
20. Case Study of a Successful Venture
21. Appendix
- 21.1 Detailed Assumptions
- 21.2 Abbreviations
- 21.3 List of Tables and Figures
- 21.4 Sources
This page vs. the full report
| Data point | On this page (free) | In the full report |
|---|---|---|
| Total CapEx | One rounded range at one capacity | Exact figure at three capacities with a line-item breakup |
| CapEx breakup | Category shares (%) only | Cost, quantity and supplier for every machine |
| Operating cost | Share of raw materials, utilities and labor | Per-unit cost sheet with each input price and consumption |
| Profitability | Gross margin range and payback band | Exact IRR, NPV, ROI, break-even and DSCR |
| Financial statements | List of what is included | 10-year P&L, cash flow, balance sheet and Excel model |
| Sensitivity | One directional line | Full sensitivity and scenario tables |
| Process | Simplified flow diagram | Detailed process flow, mass and energy balance, operating conditions |
| Machinery | Names of the main machines | Specifications, capacity, cost and supplier list |
| Market | Headline size, growth and India demand trend | Segment, region, trade and price forecast tables |
| Suppliers and buyers | Supplier types and sourcing hubs | Named suppliers and buyers |
Chocolate project report: FAQs
How much does it cost to set up a chocolate plant?
Should a new plant start from cocoa beans or from liquor and butter?
What profit margin can a chocolate plant earn?
How do cocoa prices affect a chocolate business?
Which licenses does a chocolate plant need?
Where should a new chocolate plant be located?

About the analyst
Priyanka Mor, Senior Consultant
Senior Consultant at Credence Research Inc directing strategic market advisory, cross-border commercial due diligence and enterprise intelligence frameworks for global B2B clients. Combines quantitative modeling with executive advisory, translating macroeconomic variables and supply chain data into go-to-market blueprints, M&A screenings and competitive war-gaming strategies.
Related market research
- Chocolate Market Size, Trends, Share, Growth and Forecast 2032
- Chocolate Confectionery Market Size, Share and Forecast 2032
- Food Service Chocolate Market Size, Growth and Forecast 2032
- Chocolate Processing Equipment Market Size and Forecast 2032
- Cocoa Butter Market Size, Growth, Trends and Forecast 2032
- Chocolate Bar Packaging Market Size, Share and Forecast 2032
More plant project reports
- Bread Manufacturing Plant Project Report (DPR) 2026
- Cheese Manufacturing Plant Project Report (DPR) 2026
- Camel Dairy Processing Plant Project Report (DPR) 2026
- Vinegar Manufacturing Plant Project Report (DPR) 2026
- Onion Powder Manufacturing Plant Project Report (DPR) 2026
- Tea Processing Plant Project Report (DPR) 2026