
Quick answer
A bread plant mixes wheat flour, water, yeast and salt, then ferments, bakes, cools, slices and bags the loaves. This overview models a greenfield plant making 100 tonnes a day, or 30,000 tonnes a year, with estimated CapEx of USD 20–70 million by region and build standard. Gross margin is estimated at 20–32%, before delivery and overheads, with payback at 7–16 years. Local fresh delivery and high utilization decide the outcome.
Viable for operators with assured retail or foodservice volume, a dense delivery area and a low-cost build or existing site; a new high-specification plant selling at thin wholesale prices faces a long payback.
Bread plant: key highlights
| Parameter | Indicative value | Note |
|---|---|---|
| Plant capacity | 100 tonnes of bread per day | 30,000 tonnes a year over 300 operating days, about 143,000 assumed 700 g loaves a day |
| Total CapEx | USD 20–70 million | Greenfield, scaled from disclosed plants; excludes working capital. A high-cost Australian line of similar output ran about USD 91 million |
| Raw material share of operating cost | 40–50% | Flour and other ingredients, excluding packaging, modeled at about 0.67 kg of flour per kg of bread |
| Gross margin | 20–32% | At an assumed USD 0.90–1.50 per kg ex-factory price, before delivery and overheads |
| Payback period | 7–16 years | At 80% utilization, including an assumed one-year ramp-up; weak price and high-CapEx pairings fall outside this band |
| IRR | Available in report | Post-tax, 10-year model |
| Break-even | Available in report | Capacity utilization basis |
Ranges assume a greenfield plant making 100 tonnes a day, 300 operating days, 80% utilization and 2026 prices. The ex-factory price of USD 0.90–1.50 per kg, delivered flour at USD 400–600 per tonne, delivery costs and land rates are assumed. Conversions use assumed rates of USD 1.15 per euro, USD 0.70 per Australian dollar and 34 birr per USD for 2020. CapEx excludes working capital. The full report can be customized to any country or region.
What is bread?
Bread is a baked staple made from a dough of flour, water, salt and usually yeast or sourdough. Fermentation produces the gas that raises the loaf, and baking sets the crumb and forms the crust. Because the loaf is more than one-third water and spoils or goes stale within days, plain fresh bread is a local business, unlike the biscuit trade.
Industrial plants mostly make sliced white and whole wheat pan loaves, along with buns and rolls. Other formats include crusty hearth loaves, flatbreads and par-baked or frozen items, which can travel long distances and finish in a store oven. Credence Research tracks that long-haul segment in its frozen bakery products study.
The Harmonized System places bread under heading 19.05, and ordinary bread falls in the residual subheading 1905.90. Crispbread sits in 1905.10, and rusks and toasted bread in 1905.40. Buyers are grocery chains, convenience stores, quick-service restaurants, hotels, institutional caterers and neighborhood retailers, and bun contracts with burger chains can anchor a whole production line.
Bread market overview and global demand
Credence Research does not publish a single global value for fresh bread, so nearby measures give a better sense of scale. Its studies put the U.S. bakery items market at USD 46 billion in 2024, with a 5.2% CAGR to 2032, and the India bakery market at USD 15.04 billion in 2025, with an 8.64% CAGR through 2035. Both include biscuits, cakes and other goods. Frozen bakery products worldwide are valued at about USD 26.9 billion in 2025, derived from Credence Research's USD 25.43 billion for 2024 and a 5.85% CAGR.
Wheat supply remains large by historical standards. The FAO's October 2026 cereal brief forecast 2026 world wheat production at 813.9 million tonnes, down 3.3% from the prior year's large crop. Packaged bread competes with home baking, flatbreads and in-store bakeries to different degrees by region, so a new plant should test local volume rather than assume growth.
Trade data understate the industry because fresh loaves rarely cross borders. Trade statistics for all of heading 19.05 show exports of just over USD 53 billion in 2023, led by Germany, Canada, Italy, France and Poland, with the U.S. taking 20% of imports. Much of that value is biscuits, pastry and frozen goods rather than fresh bread.
For a new plant, the relevant market is usually a delivery radius of a few hundred kilometers. Competition comes from incumbent bakers with depots and shelf contracts, and from in-store bakeries, so securing buyers before the build matters more than global growth rates.
Bread manufacturing process
An industrial bakery is a continuous line in which dough timing governs everything. A hold-up at one stage can ruin dough already in fermentation, so line balance and reliability matter as much as oven size. The steps below describe a sliced pan loaf.
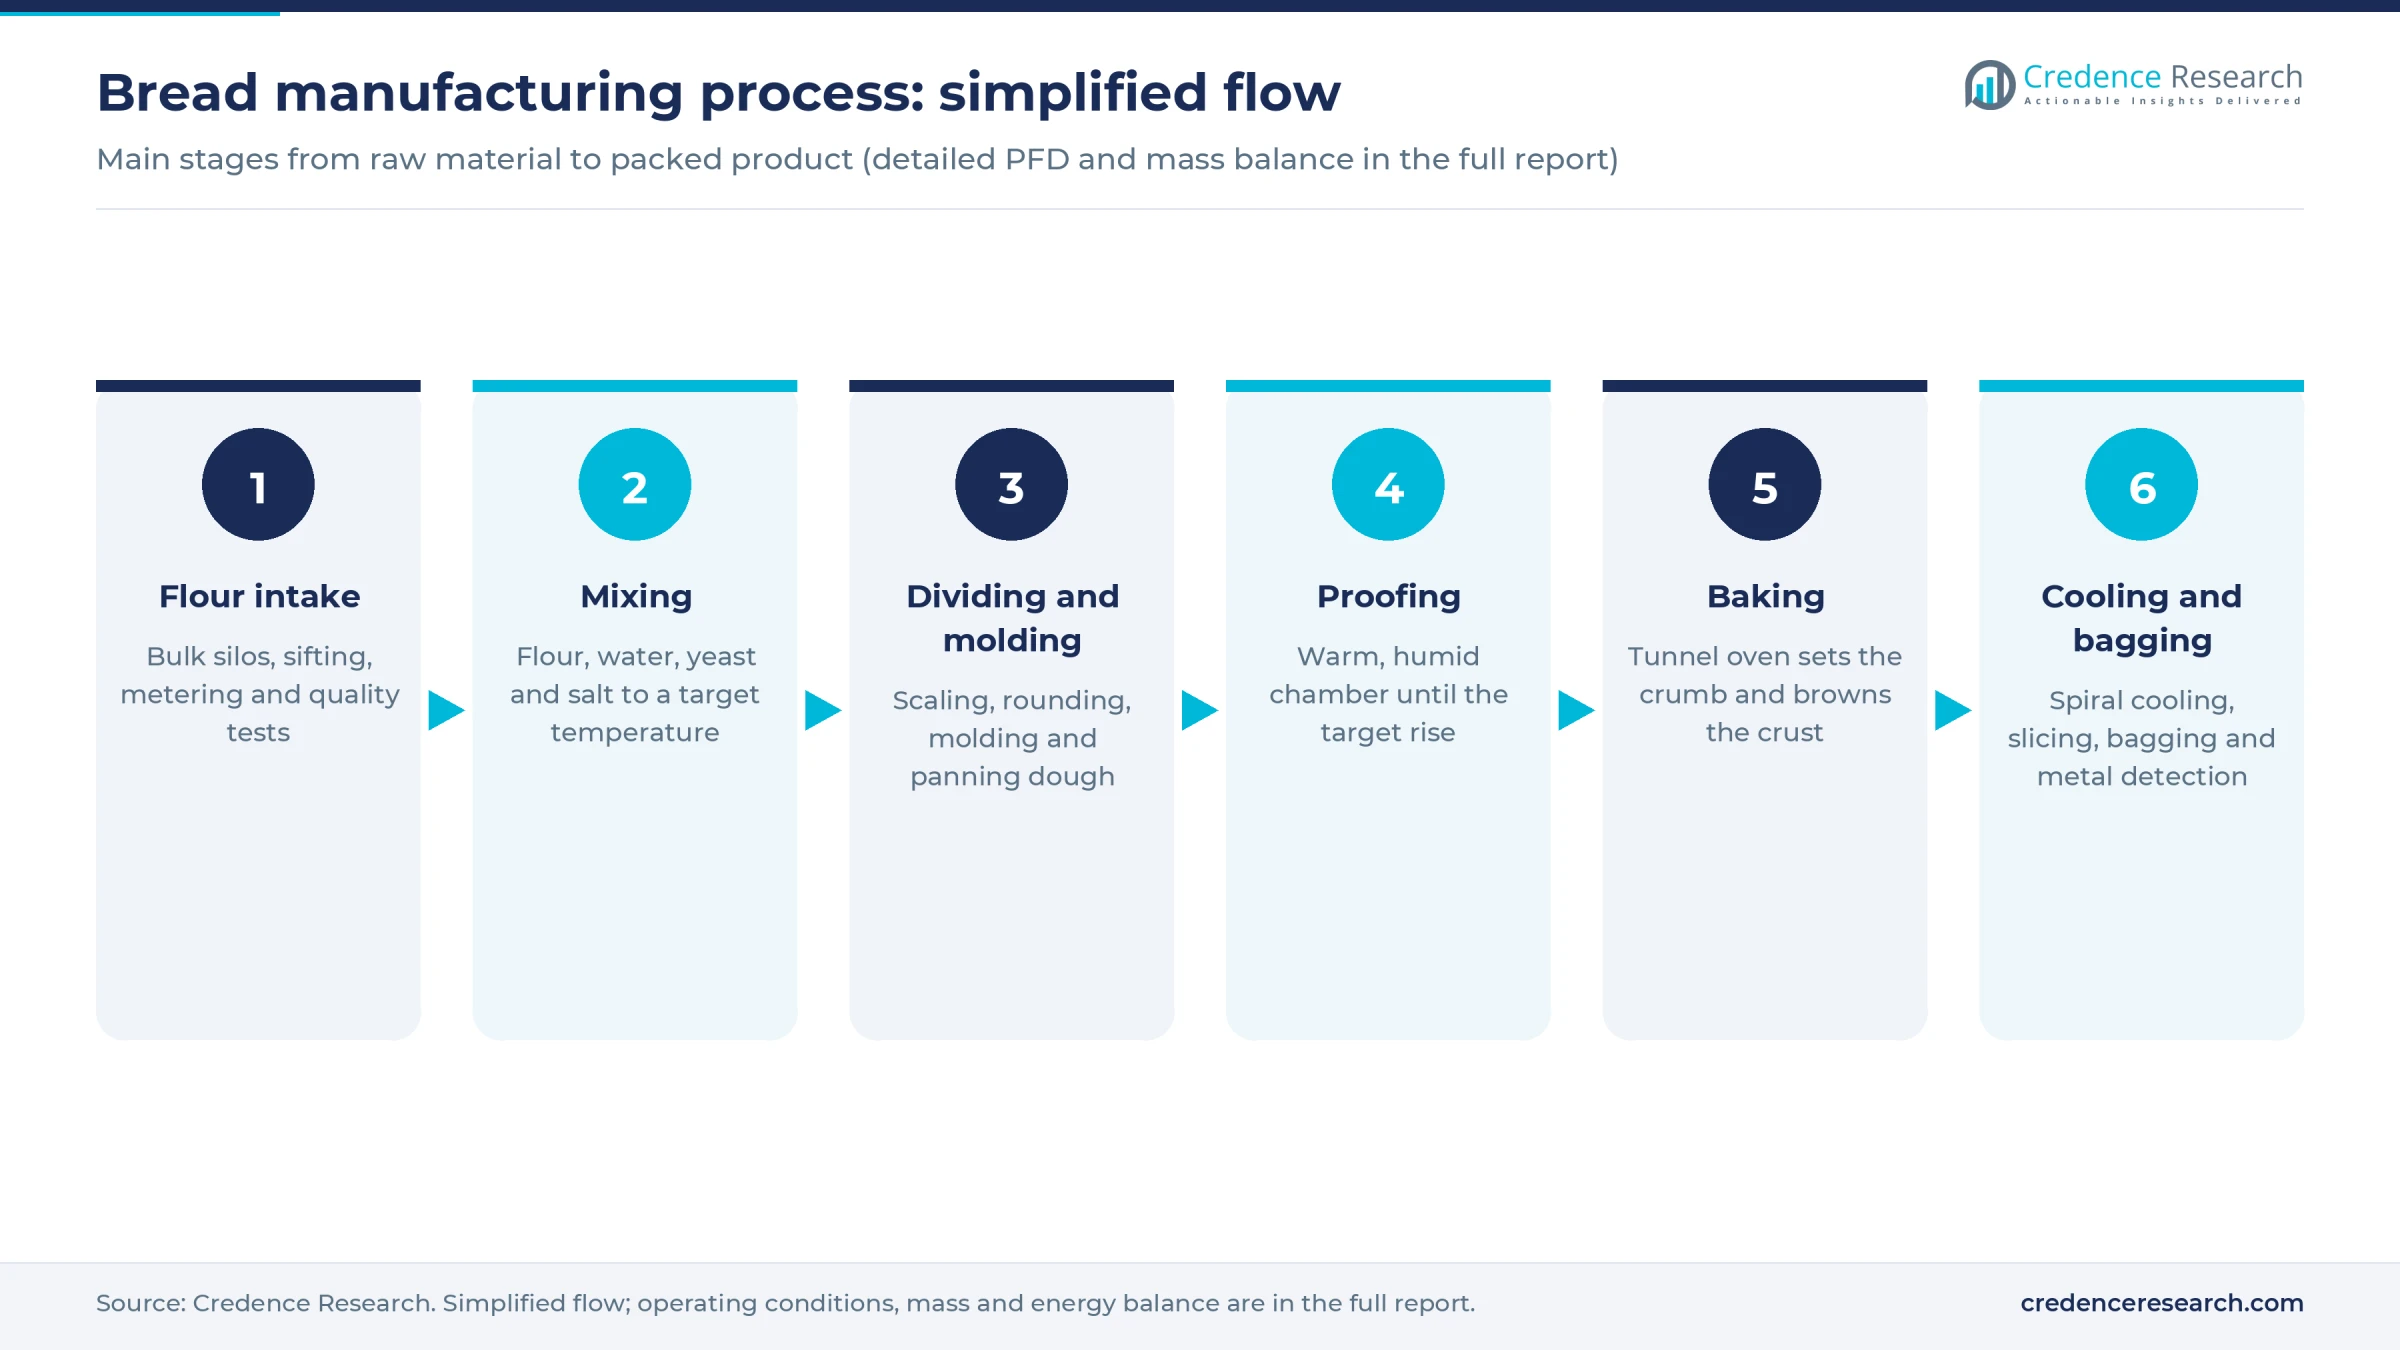
- Flour intake and sifting. Flour arrives by bulk tanker, goes into silos and is sifted and metered. Bakers test protein and enzyme activity, because weak flour needs more improver or gluten.
- Mixing. Flour, water, yeast, salt, fat, sugar and improvers go into high-speed or spiral mixers. Water temperature is controlled so that the dough finishes within a set range, often near 27°C.
- Dividing and molding. Dough is cut by weight, rounded, rested briefly and sheeted, then molded and dropped into pans. Check-weighing matters, since small overweights give away flour every hour.
- Proofing. Pans travel through a chamber held near 35–40°C at high humidity until the loaf rises to the target height.
- Baking. A tunnel oven sets the structure and browns the crust. Yeast-derived ethanol leaves in the oven exhaust, which is why regulators in some places treat bakeries as an air emissions source.
- Cooling, slicing and bagging. Loaves are depanned, cooled on spiral conveyors for up to about two hours, then sliced, bagged, clipped, date-coded and passed through metal detection.
Bread is sold almost as soon as it leaves the line. Most plants run overnight so that trucks reach stores by early morning, and unsold returns can become a real cost where retailers pay only for sold loaves. Mold is the main shelf-life risk, so hygienic cooling and slicing areas, along with preservatives or enzymes where permitted, determine how many days a loaf can survive. Cleaning also has to fit a narrow window between dry flour handling and wet washdown. Plants that run many formats lose output at each changeover, which is why large sites often dedicate lines to loaves or to buns.
Bread plant setup cost
This overview models a greenfield bakery making 100 tonnes a day at an estimated total CapEx of USD 20–70 million. At an assumed 700 g, that is about 143,000 loaves a day. Disclosed projects were scaled with an assumed 0.7 power rule and converted at stated, assumed exchange rates.
The top of the range reflects Hungary, where Agrofert's Ceres unit disclosed EUR 55 million for a plant designed for up to 100 tonnes of bread a day, or about USD 63 million. Hungarian trade press reported HUF 24.6 billion, about USD 73 million at an assumed 385 forints per euro, slightly above the range. The low end comes from Ethiopia's Sheger bakery and flour factory, built for 900 million birr in 2020, or about USD 26 million. Its bakery uses 120 tonnes of flour a day, implying about 174 tonnes of bread. Scaled down and escalated by an assumed 25%, it comes to about USD 22 million, and that figure includes a flour mill that a stand-alone bakery would skip.
Higher-cost countries can exceed the range. Tip Top's AUD 130 million line in Western Australia, about USD 91 million, makes 8,350 loaves an hour, near the modeled output, on an existing site. An expansion or the purchase of a closed bakery can cost far less, though the older layouts may limit automation.
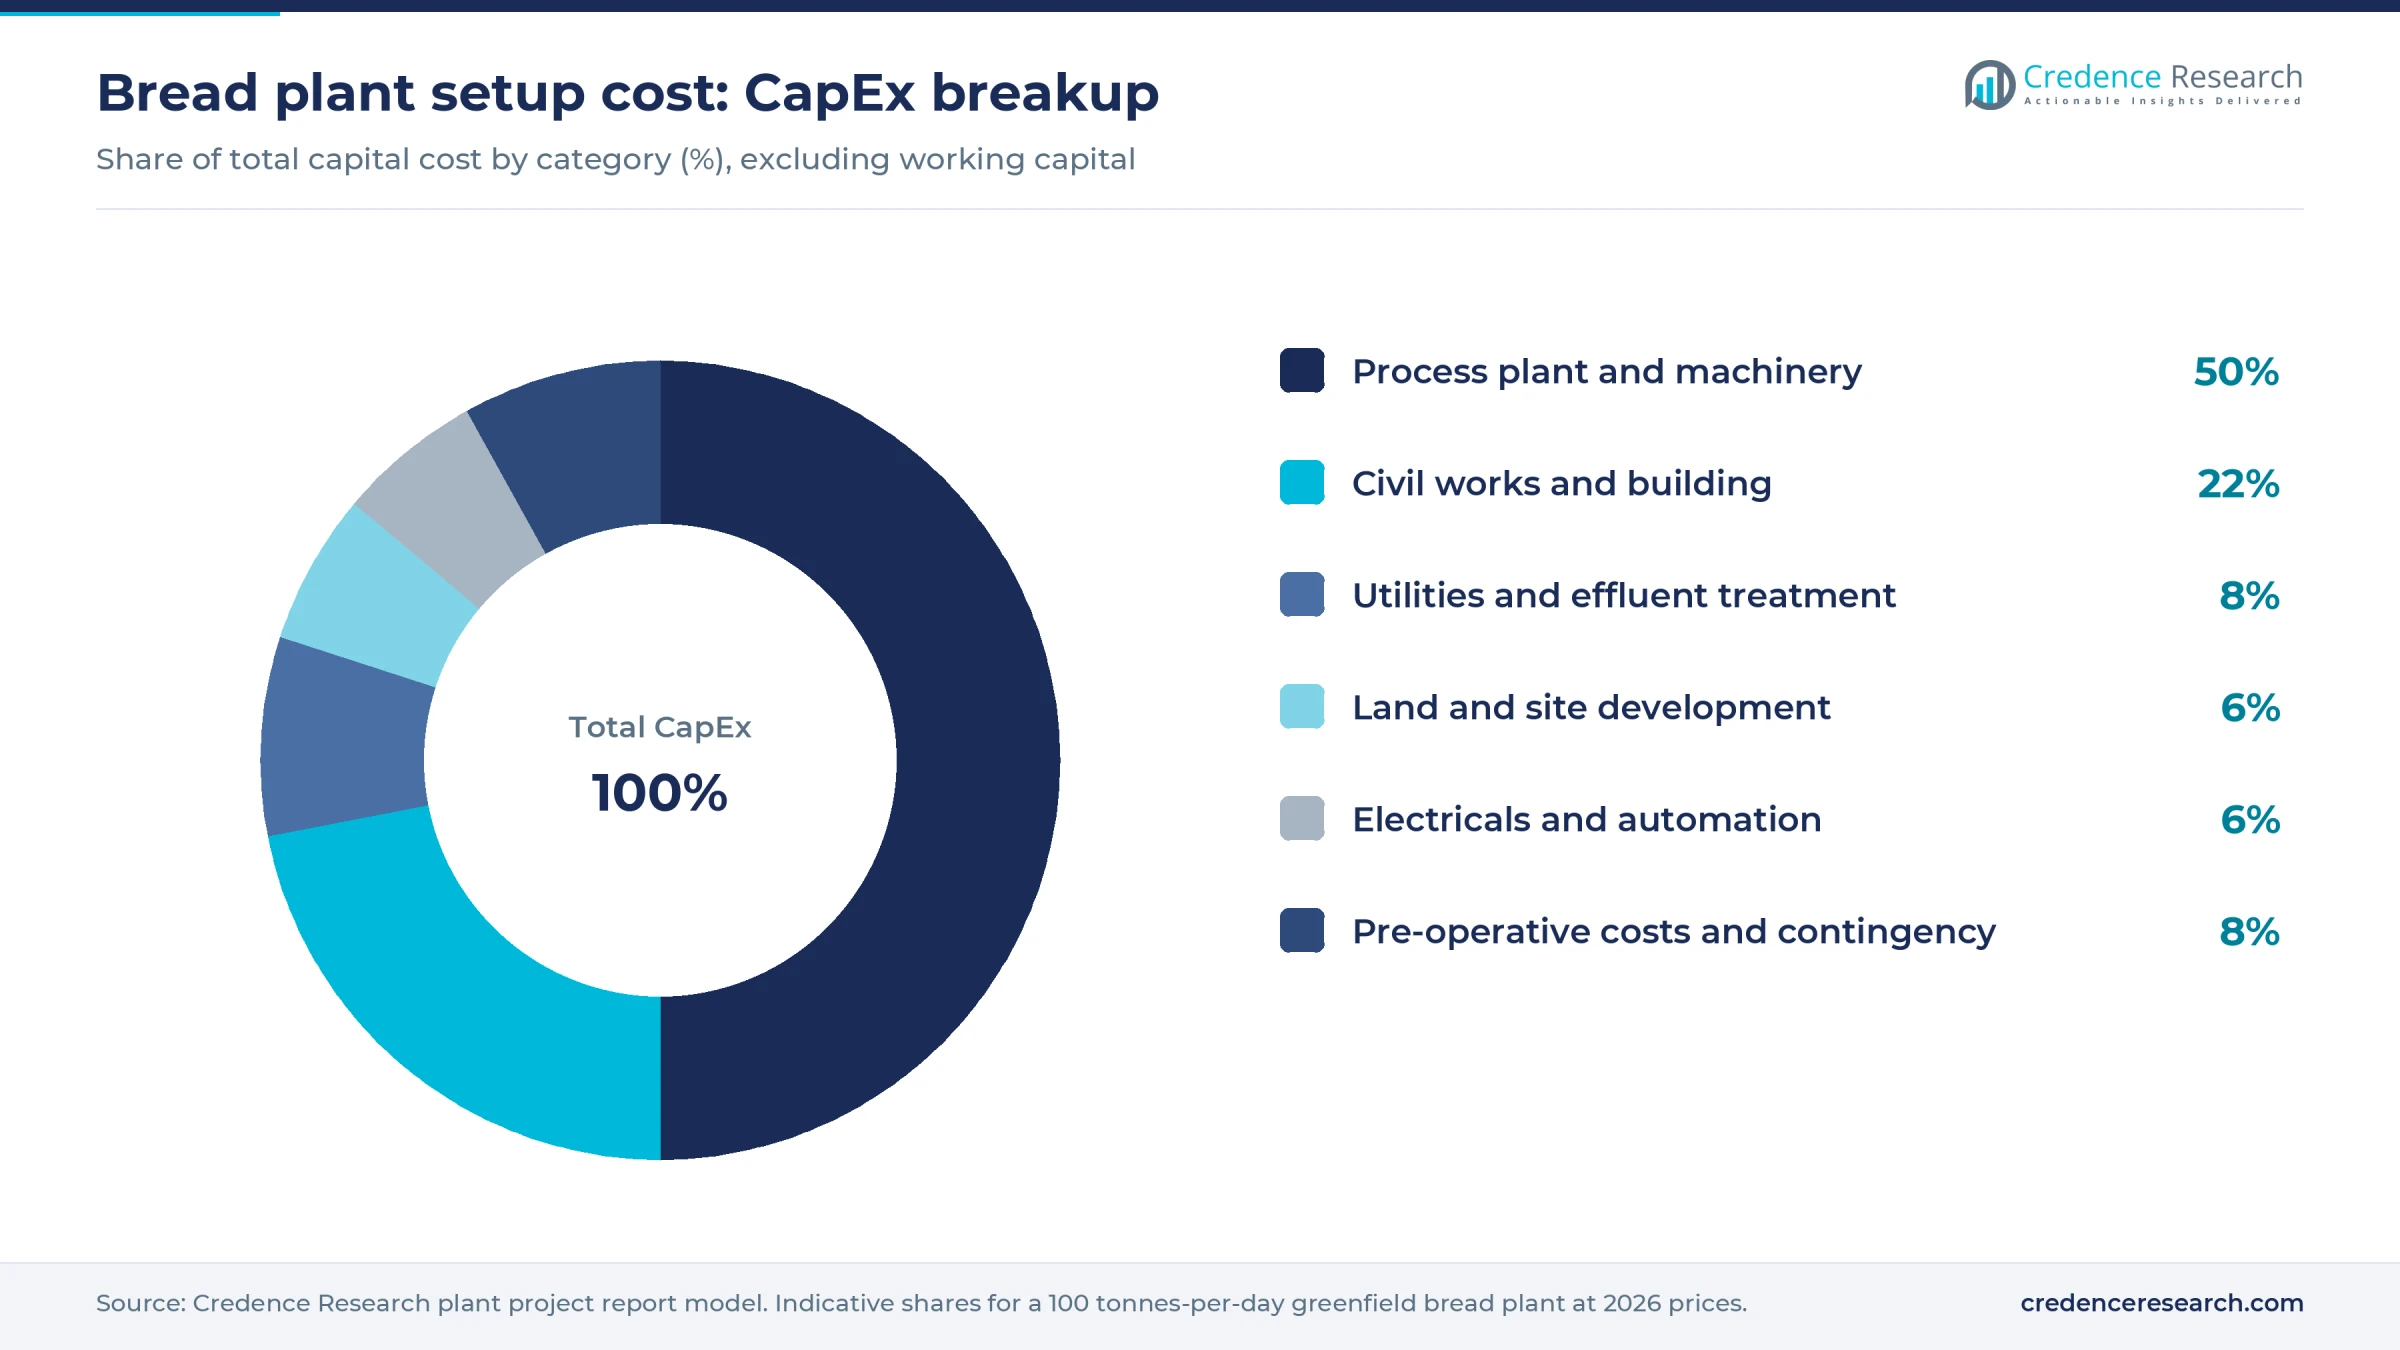
Worked example, land and site development. The plant needs an assumed 30,000–50,000 square meters; Ceres' Hungarian site covers 70,000 and Sheger's about 41,000. At an assumed USD 20–50 per square meter in an Asian industrial park, the plot costs about USD 0.6–2.5 million. At an assumed USD 30–80 at a U.S. or EU site, it costs about USD 0.9–4 million. Site works add an assumed USD 0.4–1 million, so this row usually runs 5–7% of CapEx.
Working capital adds an estimated USD 1.5–3 million. Stock turns in days, so receivables from grocery chains account for most of it.
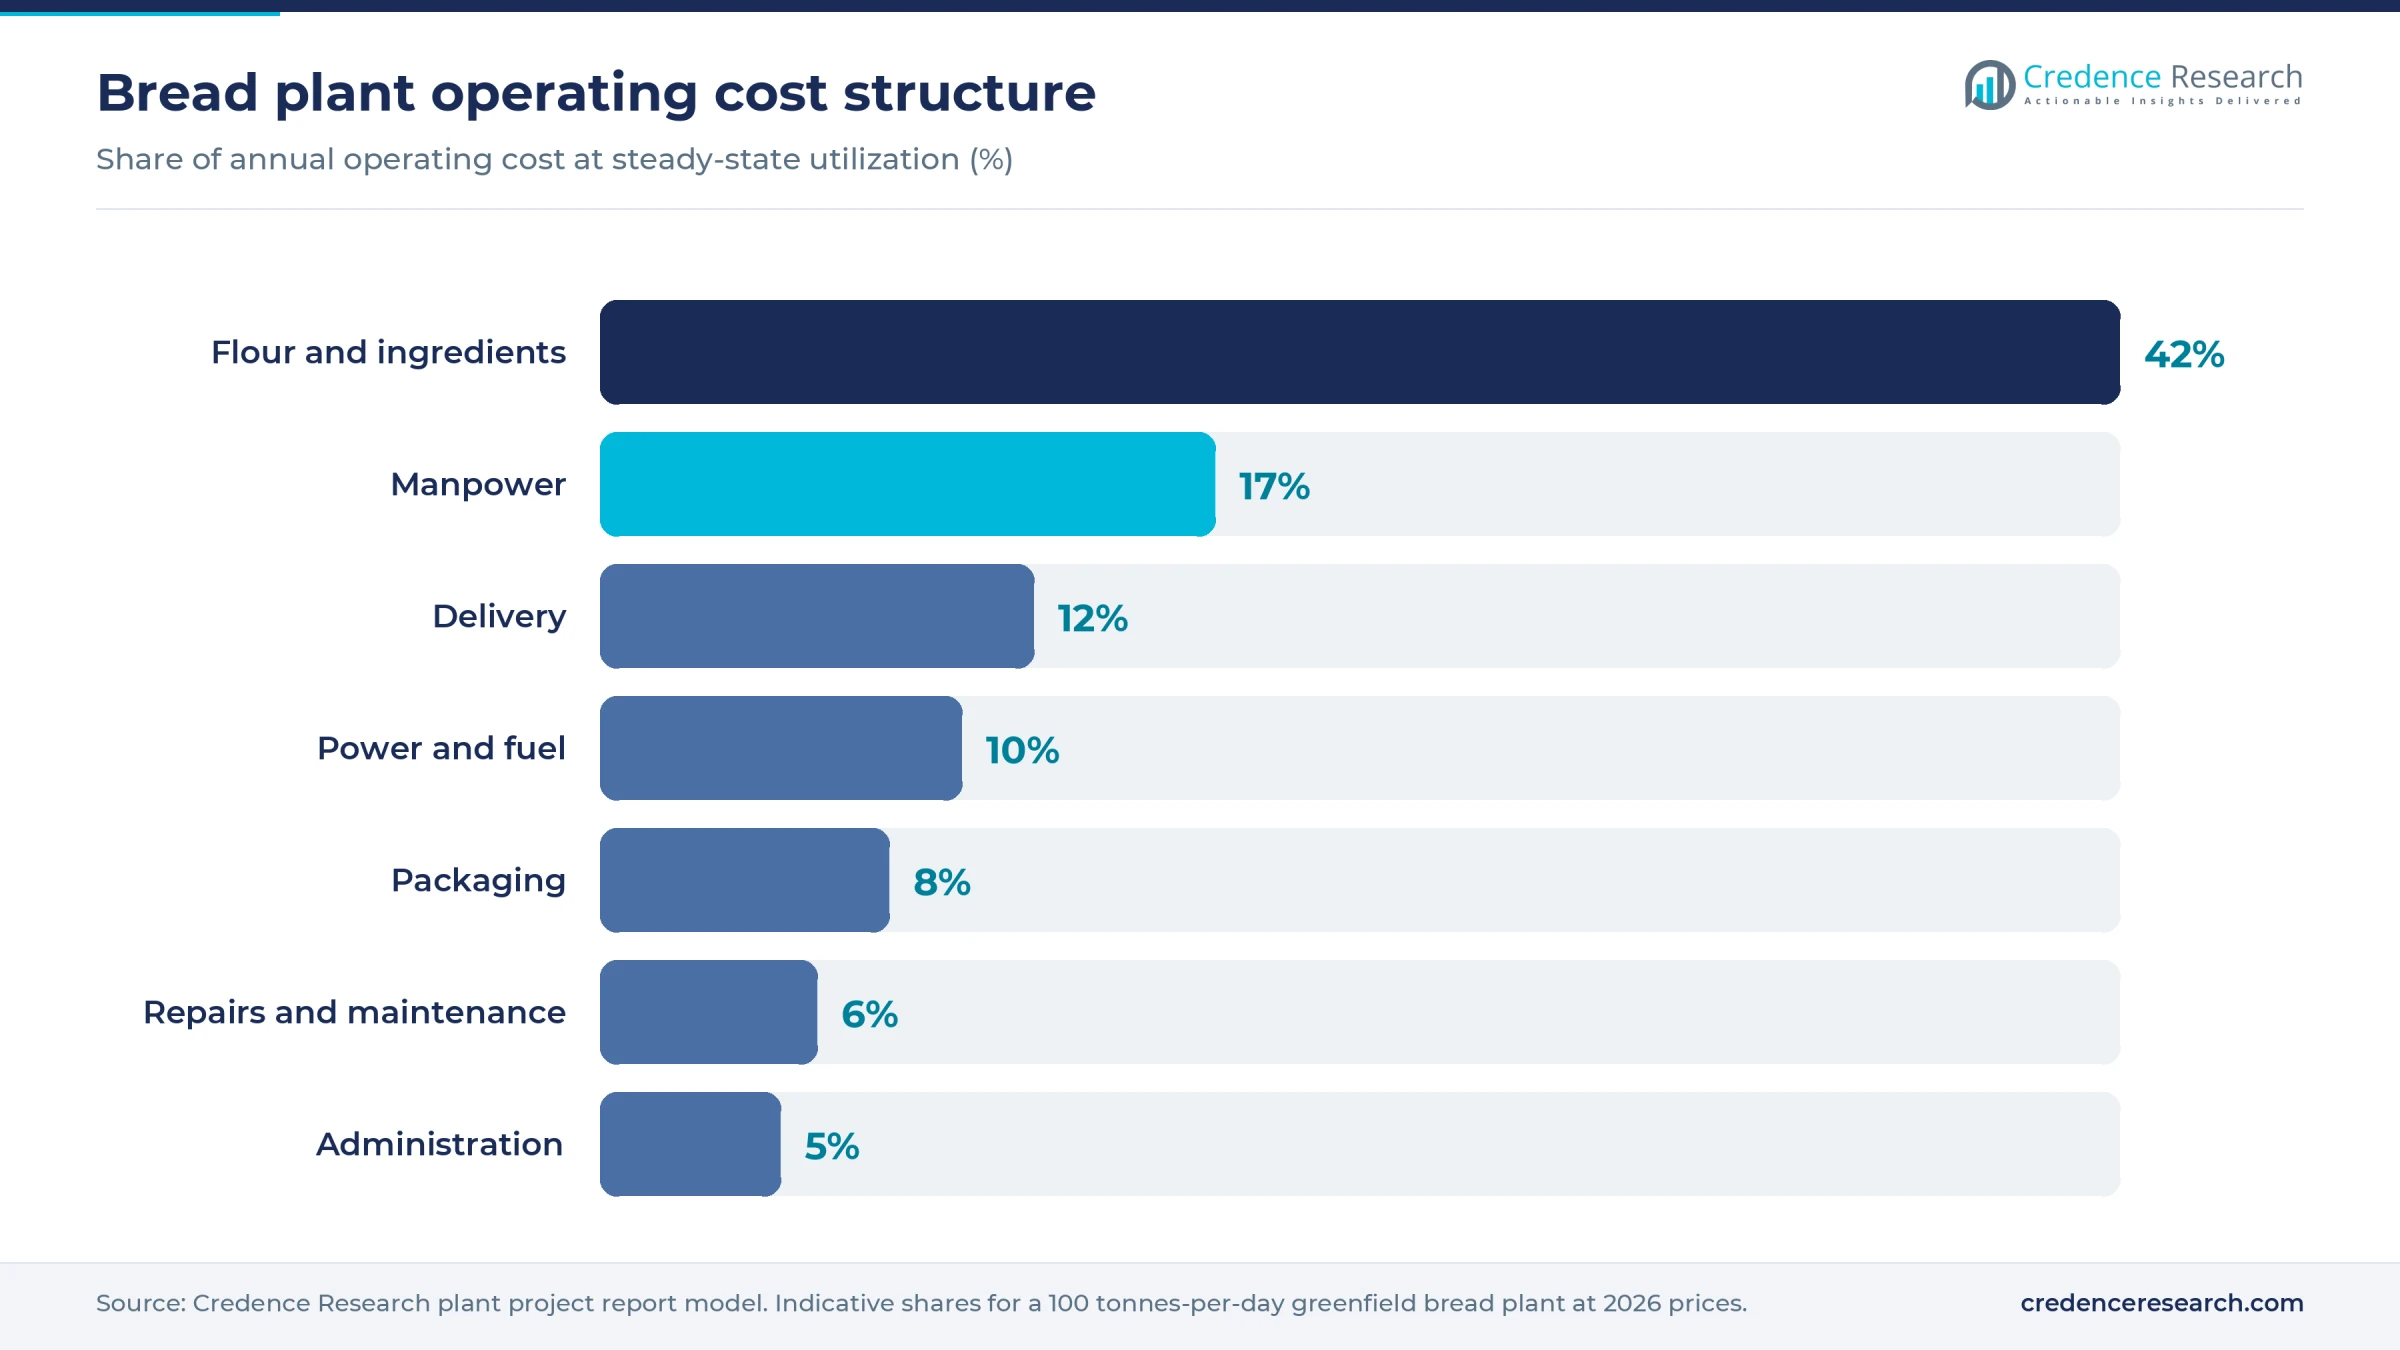
Flour and other ingredients are the largest cost, but labor, oven fuel and delivery together are close behind, which separates bread from most commodity food processing.
Machinery and raw materials for a bread plant
The main machinery groups are listed below; capacities, specifications and quotations are available in the report. Credence Research covers the supply side in its bakery processing equipment analysis.
- Ingredient handling: flour silos, sifters, bulk conveying, liquid and minor-ingredient dosing
- Dough making: spiral or high-speed mixers, bowl hoists, dividers, rounders, intermediate provers and molders
- Baking: pan conveyors, final provers, tunnel ovens, depanners and pan return with cleaning
- Finishing: spiral coolers, slicers, baggers, clip or tie closers, date coders, metal detectors and checkweighers
- Dispatch: crate stackers, crate washers, loading bays and a delivery fleet or depots
- Utilities: gas or thermal oil heating, compressors, chilled water, dust collection and effluent treatment
Flour is the key input, and most bakers buy it from a nearby mill. Bread needs hard, higher-protein wheat, grown in the Canadian Prairies, the U.S. Great Plains, Russia, Ukraine, Kazakhstan, Australia, northern India and China's northern plains, as well as the EU. Wheat prices can move sharply from year to year. World Bank data put U.S. hard red winter wheat at about USD 317 per tonne in October 2026, against about USD 231 a year earlier. Import-dependent regions, including much of Africa and the Middle East, carry added freight and currency risk.
Yeast, fats, sugar, salt, enzymes and bread improvers trade globally and are usually bought from regional suppliers. Polyethylene bags and clips complete the bill of materials.
Bread business profit margin and ROI
Gross margin, after ingredients, packaging and direct conversion, is estimated at 20–32% at an assumed ex-factory price of USD 0.90–1.50 per kg. Modeled direct cost is about USD 0.64–1.02 per kg, using assumed delivered flour at USD 400–600 per tonne. Delivery at an assumed USD 0.08–0.16 per kg and overheads of USD 1–1.8 million come next, leaving much less at the operating level.
Selling 24,000 tonnes at 80% utilization gives revenue of about USD 22–36 million. After an assumed 20% tax, cash profit runs about USD 1.1–4.7 million, with a typical USD 2.5–4.7 million. Including a one-year ramp-up, a USD 20 million build at USD 3.5 million takes about 7 years, and USD 45 million at that profit takes about 14. The weakest pairings fall outside the 7–16 year band. A USD 70 million plant at USD 2.5 million would need about 29 years.
Retail prices give only a loose ceiling. The U.S. city average for white pan bread was USD 1.83 per pound in September 2026, about USD 4 per kg, but that includes retailer margin, branding and store delivery. Private-label supply and emerging-market packaged bread sell far lower.
A USD 50 per tonne rise in flour that cannot be passed through adds about USD 0.03 per kg, cutting gross margin by about 3 percentage points at USD 1.20 per kg. Each lost point of utilization also hurts, because labor, fuel and fixed costs do not fall with volume.
| Metric | Value |
|---|---|
| Project IRR (post-tax) | Available in report |
| NPV | Available in report |
| Return on investment | Available in report |
| DSCR | Available in report |
| Break-even utilization | Available in report |
How to start a bread business, licenses and approvals
A bread plant needs approvals in six areas wherever it is built. These are business and tax registration; land use, zoning and building permits; an environmental permit covering oven exhaust and wash water; occupational safety approvals, including flour dust controls and heated equipment; food business registration or licensing with a documented safety plan; and customs registration if it exports. Grocery chains and restaurant groups commonly also ask for FSSC 22000 or BRCGS certification, and many markets want allergen controls and kosher or halal certificates.
| Market | Food and product | Environment and safety |
|---|---|---|
| United States | FDA food facility registration; preventive controls under 21 CFR 117; bread, rolls and buns standards of identity under 21 CFR 136; state food inspection | State or local air permits, which can cover oven ethanol, as under New York's Part 212 rules for wholesale bakeries; local wastewater pretreatment approval; OSHA workplace rules |
| European Union | Food business registration and HACCP under Regulation (EC) No 852/2004; labeling under Regulation (EU) No 1169/2011; acrylamide measures under Regulation (EU) 2017/2158, with a 50 µg/kg benchmark for wheat-based soft bread | National environmental and building permits; ATEX Directive 1999/92/EC duties for explosive flour dust atmospheres |
| India | FSSAI central license, generally required above 500 million rupees of annual turnover since April 2026, and FSSAI bakery product standards | State pollution control board consents to establish and operate; factory license |
Key bread manufacturers and recent developments
Grupo Bimbo is the largest multinational baker, and its brands span the Americas, Europe and Asia. Flowers Foods is a major U.S. supplier, while Yamazaki Baking leads in Japan and Warburtons in the U.K. Other regional names include Britannia and Modern in India, Tiger Brands' Albany in South Africa, Tip Top in Australia and Lantmännen, which runs a large bun bakery in Sweden. Recent capital has favored new capacity close to existing customers.
- February 2026. Tip Top opened an AUD 130 million bread line at Canning Vale, Western Australia, able to make 8,350 loaves an hour.
- March 2026. Hungarian trade reports said Ceres laid the foundation stone for a 14,000-square-meter bakery in the Tata Industrial Park, designed for 100 tonnes of bread a day.
- April 2026. Trade press reported that Warburtons bought a closed bakery site in Wakefield, England, as part of a program exceeding GBP 100 million, with production to ramp up from about September.
What's inside the Bread project report PDF
The report runs to 21 chapters. Open a chapter to see its sections.
1. Preface
2. Scope and Methodology
- 2.1 Objectives of the Study
- 2.2 Stakeholders
- 2.3 Research Methodology
- 2.4 Data Sources and Key Assumptions
3. Executive Summary
- 3.1 Market Snapshot
- 3.2 Project at a Glance (Capacity, CapEx, OpEx)
- 3.3 Key Financial Indicators (IRR, NPV, Payback, Break-even)
- 3.4 Feasibility Verdict
4. Product Overview
- 4.1 Bread Definition and Properties
- 4.2 Grades and Specifications (BIS / ISO / ASTM)
- 4.3 HS Code and Classification
- 4.4 Key Applications
- 4.5 Substitutes
5. Global Bread Market
- 5.1 Market Overview
- 5.2 Historical and Current Market Performance (Volume and Value)
- 5.3 Market Breakup by Grade / Type
- 5.4 Market Breakup by End-Use Industry
- 5.5 Market Breakup by Region
- 5.6 Market Drivers, Restraints and Trends
- 5.7 Value Chain Analysis
- 5.8 Market Forecast
6. Target Country Bread Market Analysis
- 6.1 Demand and Supply Analysis
- 6.2 Installed Capacity vs Demand Gap
- 6.3 Import Dependence
- 6.4 Demand Forecast by End-Use
7. Trade Analysis
- 7.1 Imports by Volume, Value and Country
- 7.2 Exports by Volume, Value and Country
- 7.3 Trade Balance and Opportunities
8. Price Analysis
- 8.1 Historical Bread Price Trends by Region
- 8.2 Raw Material / Feedstock Price Trends and Linkage
- 8.3 Price Forecast
- 8.4 Margins Across the Value Chain
9. Competitive Landscape
- 9.1 Market Structure
- 9.2 Key Players and Installed Capacities
- 9.3 Profiles of Key Players
- 9.4 Recent Developments (Expansions, M&A, New Plants)
10. Manufacturing Process and Technology
- 10.1 Comparison of Technology Routes
- 10.2 Selected Route and Process Flow Diagram
- 10.3 Unit Operations Involved
- 10.4 Chemical Reactions Involved
- 10.5 Mass Balance and Raw Material Requirements
- 10.6 Energy Balance
- 10.7 Quality Assurance Criteria and Technical Tests
- 10.8 By-products and Waste Handling
- 10.9 Technology Licensors / Providers
11. Project Details, Requirements and Costs
- 11.1 Land, Location and Site Development
- 11.1.1 Site Selection Criteria
- 11.1.2 Location Analysis
- 11.1.3 Land Requirement and Costs
- 11.1.4 Site Development Costs
- 11.2 Plant Layout
- 11.2.1 Layout Principles
- 11.2.2 Proposed Layout
- 11.2.3 Factors Influencing Layout
- 11.3 Civil Works and Buildings
- 11.4 Plant Machinery
- 11.4.1 Machinery Requirements and Specifications
- 11.4.2 Machinery Costs
- 11.4.3 Machinery Suppliers
- 11.5 Raw Materials
- 11.5.1 Requirements per Tonne of Output
- 11.5.2 Procurement and Sourcing
- 11.5.3 Costs
- 11.5.4 Suppliers
- 11.6 Packaging
- 11.6.1 Packaging Requirements
- 11.6.2 Packaging Costs
- 11.6.3 Packaging Suppliers
- 11.7 Storage and Material Handling
- 11.8 Transportation Requirements and Costs
- 11.9 Utilities
- 11.9.1 Power Requirements and Costs
- 11.9.2 Water Requirements and Costs
- 11.9.3 Steam, Fuel and Other Utilities
- 11.10 Manpower Requirements and Wages
12. Environment, Health, Safety and Sustainability
- 12.1 Effluent and Emissions Management
- 12.2 Hazard Classification and Safety Measures
- 12.3 Carbon Footprint
- 12.4 Green / Low-Carbon Process Options
13. Regulatory Procedures, Approvals and Certifications
- 13.1 Licences and Registrations
- 13.2 Environmental Clearances
- 13.3 Product Certifications (BIS, REACH, etc.)
- 13.4 Approval Timeline
14. Project Implementation Schedule
15. Project Economics
- 15.1 Capital Cost of the Project
- 15.2 Techno-Economic Parameters
- 15.3 Capacity Utilization and Ramp-up
- 15.4 Product Pricing and Margins
- 15.5 Income Projections
- 15.6 Expenditure Projections
- 15.7 Working Capital Requirement
- 15.8 Taxation
- 15.9 Depreciation
16. Financial Analysis
- 16.1 Projected Profit and Loss Account
- 16.2 Projected Cash Flow Statement
- 16.3 Projected Balance Sheet
- 16.4 Liquidity Analysis
- 16.5 Profitability Analysis (Payback, NPV, IRR, ROI)
- 16.6 Break-even Analysis
- 16.7 Debt Service Coverage Ratio (DSCR)
- 16.8 Sensitivity Analysis
- 16.9 Scenario and Uncertainty Analysis
17. Funding and Incentives
- 17.1 Means of Finance and Debt-Equity Structure
- 17.2 Loans and Financial Assistance
- 17.3 Government Schemes and Subsidies (PLI, State Policies)
18. Risk Assessment
- 18.1 Key Success Factors
- 18.2 Key Risk Factors
- 18.3 Risk Mitigation
19. Strategic Recommendations
20. Case Study of a Successful Venture
21. Appendix
- 21.1 Detailed Assumptions
- 21.2 Abbreviations
- 21.3 List of Tables and Figures
- 21.4 Sources
This page vs. the full report
| Data point | On this page (free) | In the full report |
|---|---|---|
| Total CapEx | One rounded range at one capacity | Exact figure at three capacities with a line-item breakup |
| CapEx breakup | Category shares (%) only | Cost, quantity and supplier for every machine |
| Operating cost | Share of raw materials, utilities and labor | Per-unit cost sheet with each input price and consumption |
| Profitability | Gross margin range and payback band | Exact IRR, NPV, ROI, break-even and DSCR |
| Financial statements | List of what is included | 10-year P&L, cash flow, balance sheet and Excel model |
| Sensitivity | One directional line | Full sensitivity and scenario tables |
| Process | Simplified flow diagram | Detailed process flow, mass and energy balance, operating conditions |
| Machinery | Names of the main machines | Specifications, capacity, cost and supplier list |
| Market | Headline size, growth and India demand trend | Segment, region, trade and price forecast tables |
| Suppliers and buyers | Supplier types and sourcing hubs | Named suppliers and buyers |
Bread project report: FAQs
How much does it cost to set up a bread plant?
How much flour does a bread plant use?
What profit margin can a bread plant earn?
Why is the payback for a bread plant so long?
Which licenses does a bread plant need?
Can fresh bread be exported from a new plant?
Which bread formats suit a new plant best?

About the analyst
Priyanka Mor, Senior Consultant
Senior Consultant at Credence Research Inc directing strategic market advisory, cross-border commercial due diligence and enterprise intelligence frameworks for global B2B clients. Combines quantitative modeling with executive advisory, translating macroeconomic variables and supply chain data into go-to-market blueprints, M&A screenings and competitive war-gaming strategies.
Related market research
- Frozen Bakery Products Market Size, Growth and Forecast 2032
- US Bakery Items Market Share, Size, Growth and Forecast 2032
- India Bakery Market Size, Share, Growth and Forecast, 2025-2035
- Bakery Processing Equipment Market Size, Growth and Forecast 2032
- Bread Improvers Market Size, Growth, Share and Forecast 2032
- Bakery Ingredients Market Size, Growth and Forecast 2032
More plant project reports
- Chocolate Manufacturing Plant Project Report (DPR) 2026
- Cheese Manufacturing Plant Project Report (DPR) 2026
- Camel Dairy Processing Plant Project Report (DPR) 2026
- Vinegar Manufacturing Plant Project Report (DPR) 2026
- Onion Powder Manufacturing Plant Project Report (DPR) 2026
- Tea Processing Plant Project Report (DPR) 2026