
Quick answer
A corrugated box plant turns purchased containerboard into printed shipping boxes on a corrugator and converting lines. A greenfield plant with about 100 million square meters of annual capacity needs an estimated USD 30–55 million of CapEx in an Asian or emerging-market park, with U.S. and EU sites often far higher. Containerboard dominates operating cost, leaving a gross margin of 13–22% and a payback of about 5–11 years.
Viable where a plant locks in anchor food, beverage or e-commerce accounts within trucking range, but a weak bet as an uncommitted entrant in a mature region with spare capacity.
Corrugated Box plant: key highlights
| Parameter | Indicative value | Note |
|---|---|---|
| Plant capacity | About 100 million square meters per year | One corrugator with converting lines, roughly 50,000 metric tons of board |
| Total CapEx | USD 30–55 million | Greenfield, Asian or emerging-market park; U.S. and EU sites often far higher |
| Raw material share of operating cost | 75–80% | Containerboard net of trim sales, plus starch, ink and glue |
| Gross margin | 13–22% | Price minus board, conversion, delivery and direct labor |
| Payback period | 5–11 years | At 80% utilization and mid-range CapEx, before tax and financing |
| IRR | Available in report | Post-tax, 10-year model |
| Break-even | Available in report | Capacity utilization basis |
Ranges assume a greenfield plant making about 100 million square meters, or 50,000 metric tons, a year with its own corrugator, on purchased containerboard, in an Asian or emerging-market park (U.S./EU costs higher), 2026 prices, 80% utilization, and assumed box prices, trim and conversion costs. Euros converted at about 1.14 and rupees at an assumed 74 per USD (2021 plan). Customizable to any country.
What is a corrugated box?
A corrugated box is a shipping container cut from board made of one or more fluted paper layers glued between flat liners. The arched flute acts like a row of small columns, which gives the box high stacking strength for very little fiber weight.
Board comes in single-wall, double-wall and triple-wall constructions, with flute profiles from coarse A and C grades to fine E and F grades. Regular slotted cartons are the volume product, while die-cut trays, retail-ready displays and printed e-commerce mailers earn more per square meter. Buyers specify by edge crush or burst strength, board grammage, print and size, and they rarely buy on a catalog basis, because nearly every order is made to a customer's dimensions.
Finished boxes trade under Harmonized System subheading 4819.10, which covers cartons, boxes and cases of corrugated paper or paperboard. Folding cartons of non-corrugated board fall separately under 4819.20, and corrugated paper and paperboard in rolls or sheets falls under heading 48.08. Main users are food and beverage producers, consumer goods makers, farm exporters and online retailers.
Corrugated box market overview and global demand
The most useful value marker sits one step upstream. The global containerboard market stands at about USD 119.6 billion in 2025, based on Credence Research's estimate of USD 117.2 billion for 2024 and a 2.12% CAGR through 2032. Most of that board ends up in boxes, which sell at close to twice the price of the paper in them, so the finished box market is considerably larger.
Europe publishes the cleanest physical data. FEFCO's 2023 statistics show about 46.1 billion square meters of output, or 22.8 million metric tons, from 528 plants and 524 corrugators, led by Germany, Italy, Spain, France, the United Kingdom and Poland. Its 2025 activity report cites about 52 billion square meters a year across 590 plants. Only about 8% of that 2023 area was exported, because boxes are bulky and usually delivered by truck, which is why this industry is a local one.
Spain shows who buys. Trade group AFCO counted 5.94 billion square meters in 2025, with food taking 61% of demand and logistics and e-commerce about 9%.
North America is in a capacity reset. Waste Dive reported in November 2025 that U.S. box shipments fell 1.4% in the third quarter and that analysts saw containerboard capacity down about 10% that year. Smurfit Westrock said in October 2025 it would keep closing inefficient plants. New box capacity is still being built, though, often to replace older sites or to follow customers. Growth in South Asia, Southeast Asia and Latin America rests on the shift of food, retail and exports into organized supply chains.
Corrugated box manufacturing process from reel to pallet
A box plant runs two linked stages. The corrugator makes board, and the converting hall turns that board into boxes. Plants without a corrugator, known as sheet plants, buy board and skip the first stage, which cuts CapEx but gives up most of the control over cost and lead time.
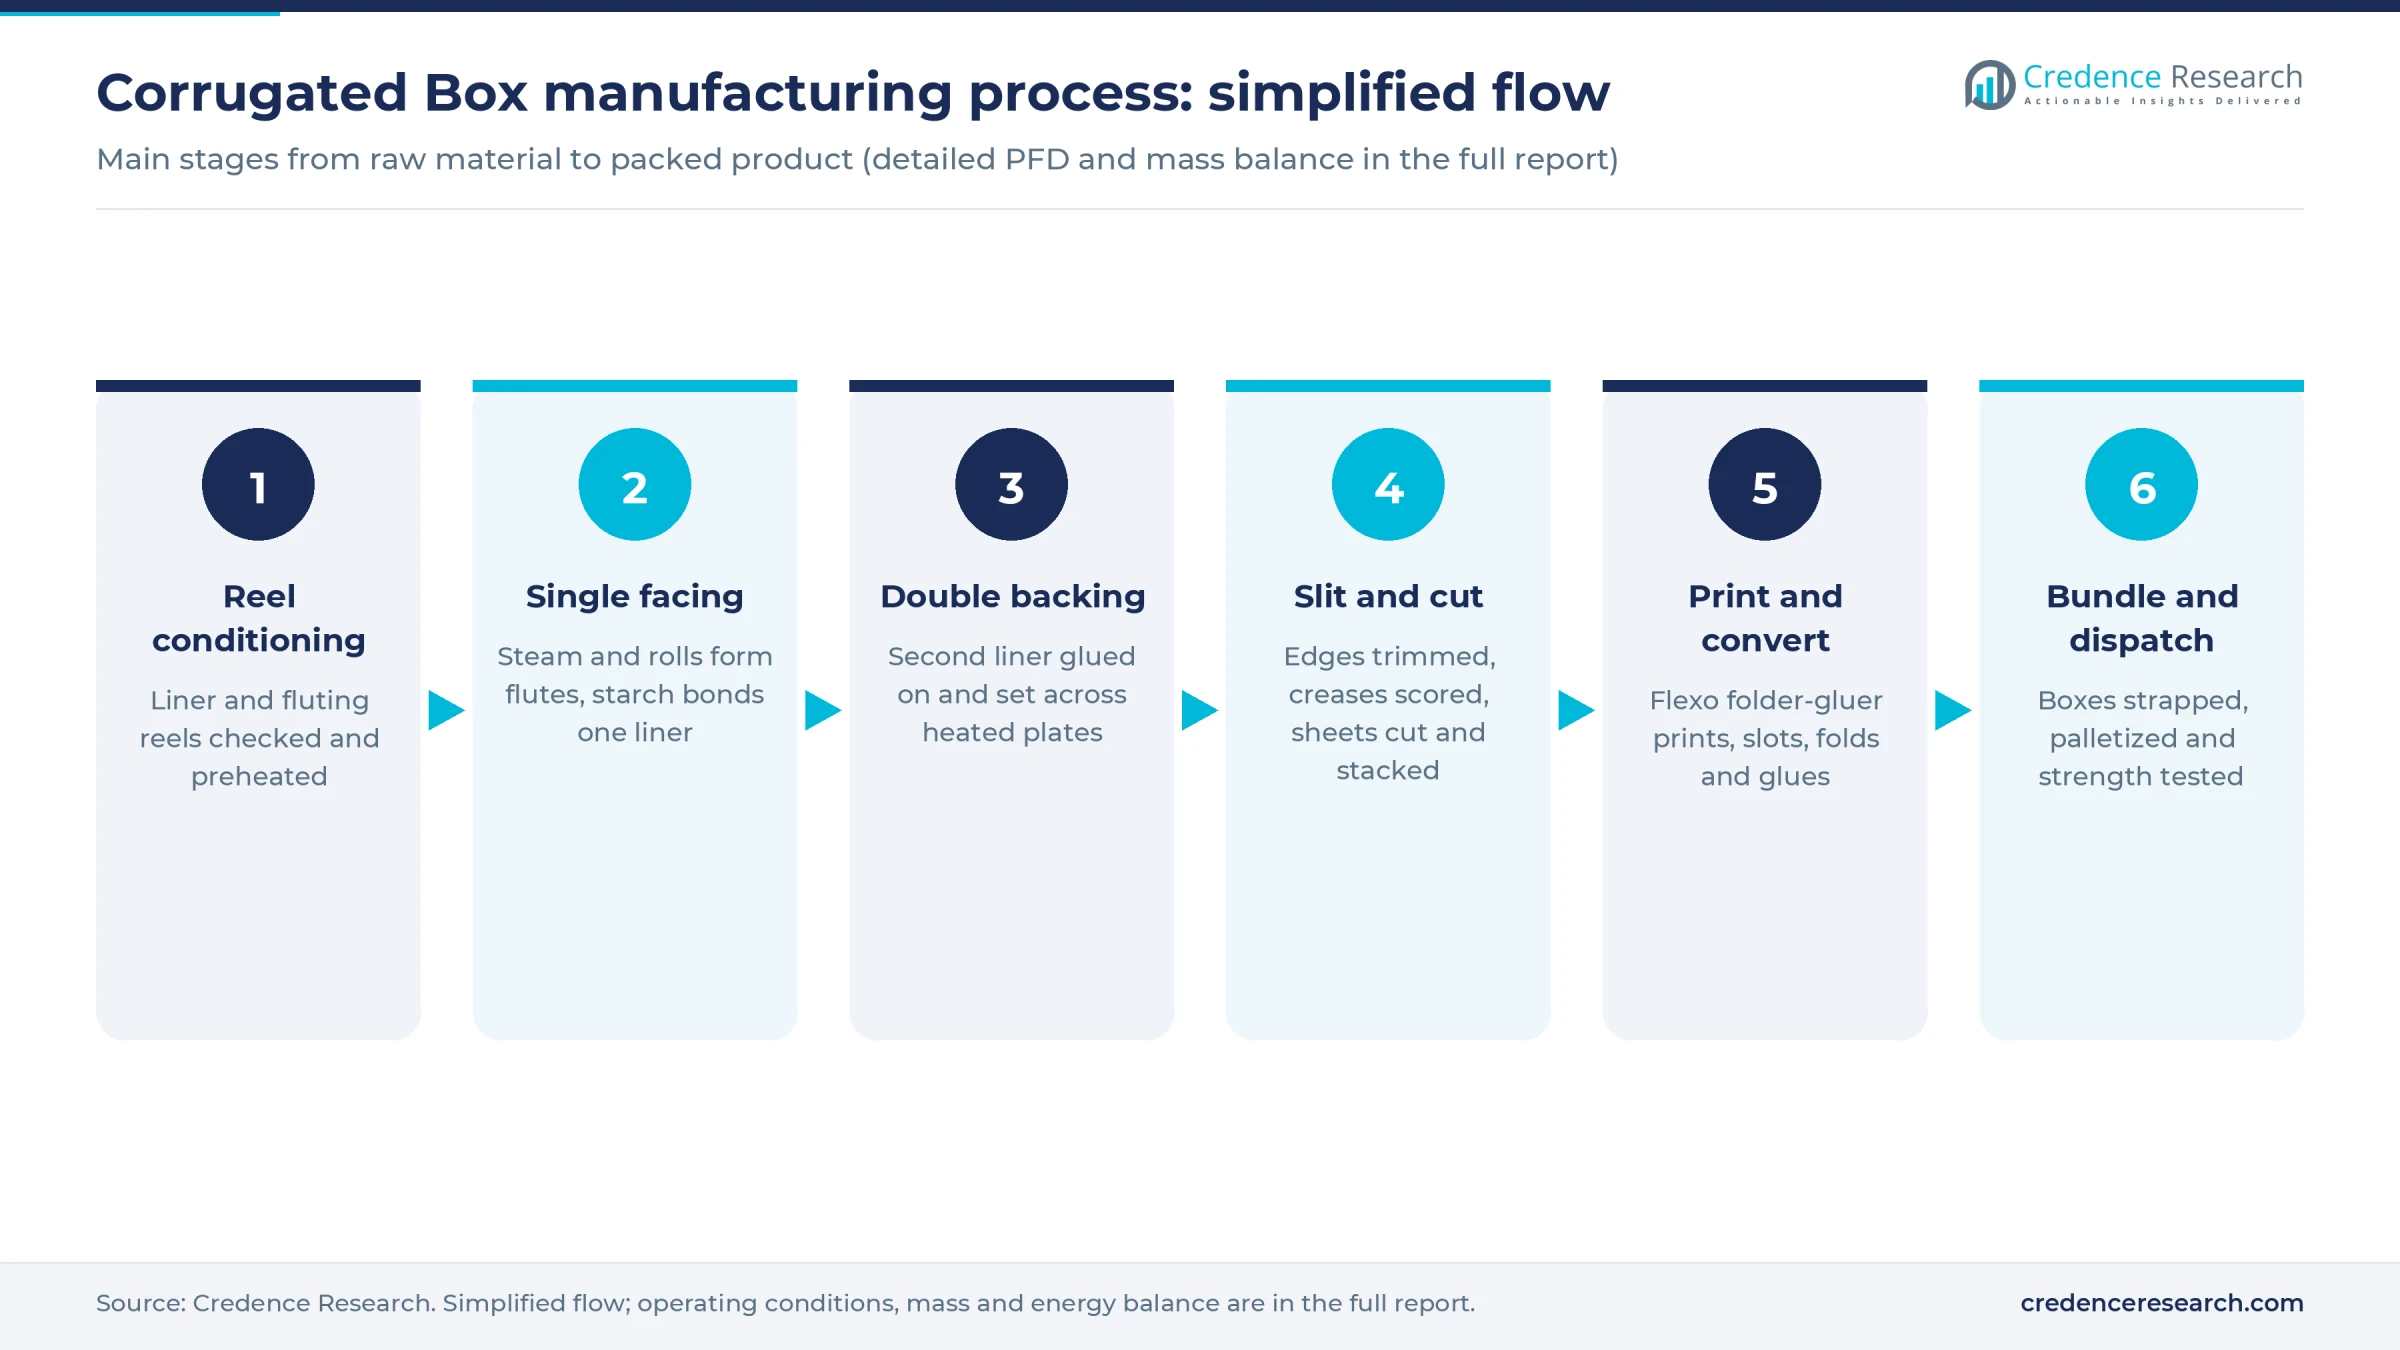
- Reel receipt and conditioning. Liner and fluting reels are checked for grammage, moisture and strength, then brought up to temperature on preheaters. Moisture errors here cause warped board later, so reel handling matters more than it looks.
- Single facing. Steam softens the fluting paper, and heated corrugating rolls press it into flutes. A starch adhesive then bonds one liner to the flute tips, forming single-face web.
- Double backing. A second liner, and extra single-face webs for double-wall grades, are glued on and pulled across heated plates. The starch gels and sets within seconds, so line speed and heat have to stay balanced.
- Slitting and cutting. A slitter-scorer trims edges, cuts widths and creases fold lines, and a cut-off knife cuts sheets to length. Sheets are stacked and rested so moisture evens out. Good order combining on this step is where a plant saves or wastes the most paper.
- Printing and converting. A flexo folder-gluer prints with water-based inks, slots, folds and glues regular cartons in one pass. Die cutters handle trays and displays, and short runs can go through digital presses.
- Bundling and dispatch. Boxes are counted, strapped and palletized, then sampled for crush strength and dimensions. Trim and rejects go to a baler for sale as recovered paper.
The boiler, starch kitchen and trim extraction system run in support, and they account for most of the plant's permit questions.
Corrugated box plant setup cost
The reference plant has one corrugator and converting lines, making about 100 million square meters a year. At FEFCO's average of about 495 grams per square meter, that equals roughly 50,000 metric tons. Total CapEx is estimated at USD 30–55 million in an Asian or emerging-market park, including land, buildings, utilities, preoperative cost and a working capital margin.
Disclosed projects frame the range. Oji's plant in Johor, Malaysia, budgeted about USD 38 million for 84 million square meters a year in 2020, which scales to about USD 45 million before cost inflation. JK Paper's 1.5 billion rupee plan of about 2021, roughly USD 20 million at an assumed 74 rupees, for 50,000 metric tons of box capacity in India marks a low end. In Poland, Grembox is spending more than USD 29 million on 40–50 million square meters with no corrugator, which shows how fast EU costs climb. Saica's Indiana plant, at more than USD 110 million for about 111 million square meters, shows why a U.S. site can run close to double the top of the range.
For the land row, a site of about 4 hectares, or 40,000 square meters, fits the Oji and Grembox footprints. At an assumed USD 40–100 per square meter in an Asian industrial park, land costs about USD 1.6–4 million, close to 7% of CapEx at mid-range. Loading docks and truck turning space take more room than first-time builders expect. The report can be customized to any country or region.
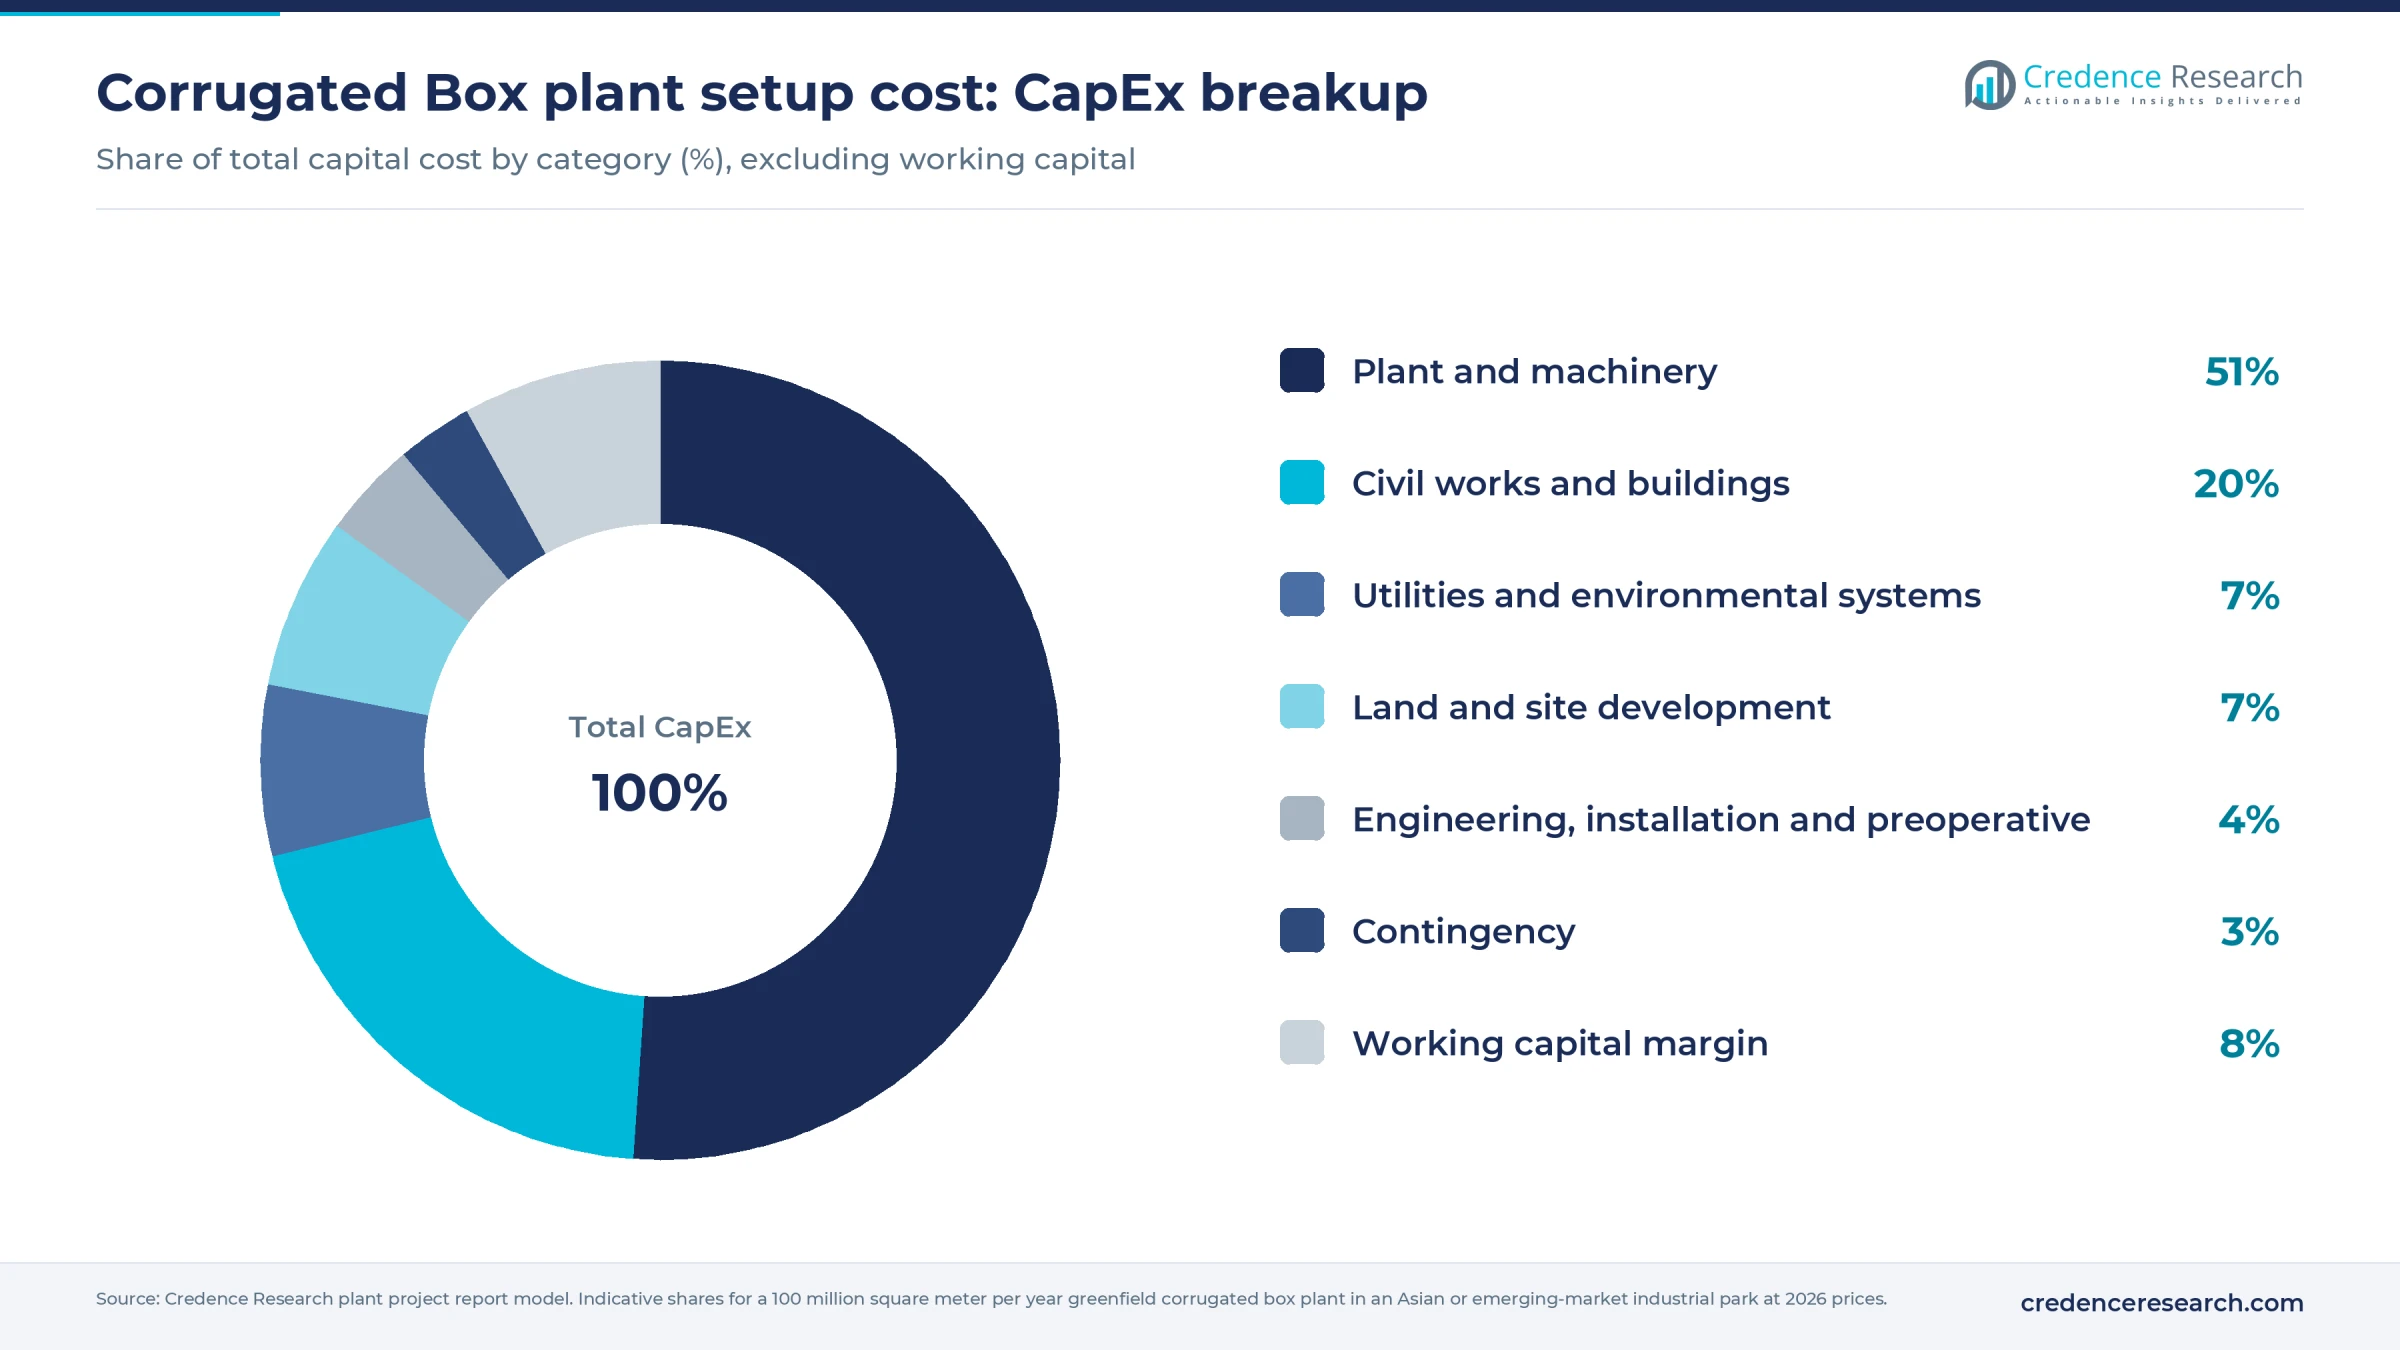
Plant and machinery take about 51% of CapEx, and buying a used or lower-speed corrugator is the largest single lever on the budget. Buildings take a larger share than in many process plants, because finished boxes need dry and covered space.
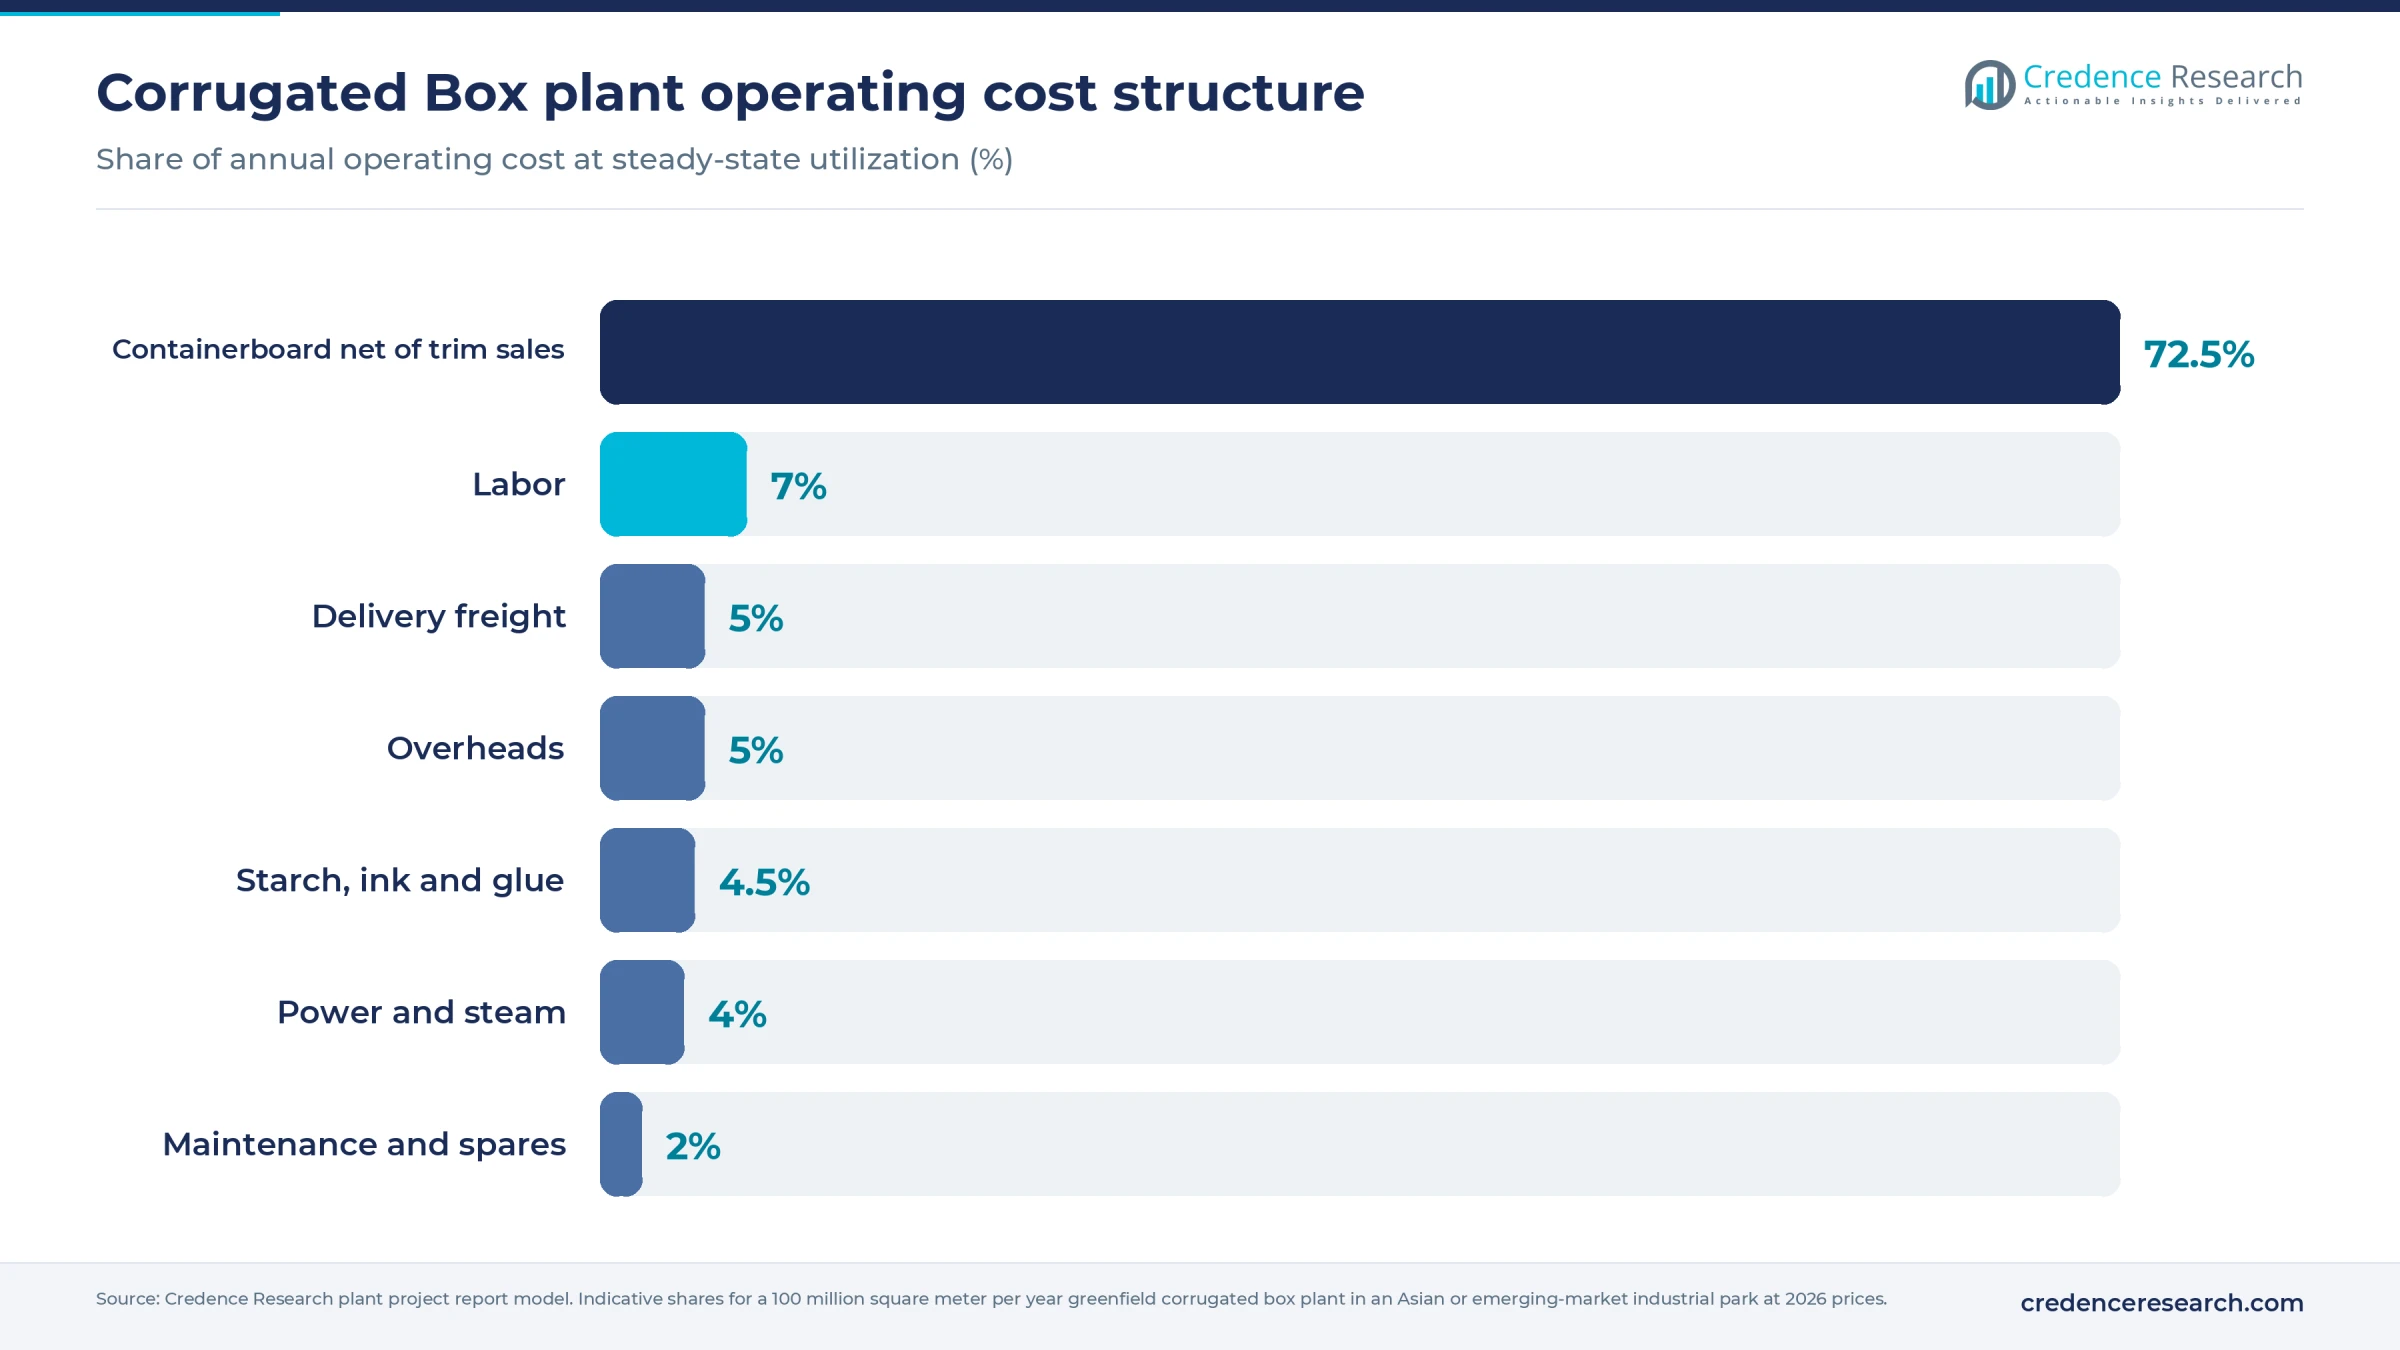
Containerboard makes up about 73% of operating cost. Labor comes next at about 7%, then delivery and overheads, so trim losses matter far more than any utility bill.
Machinery and raw materials for a corrugated box plant
The main equipment groups are listed below. Machine widths, speeds and the full schedule are in the report.
- Corrugator with reel stands, preheaters, single facer, glue unit and double backer
- Slitter-scorer, cut-off knife and automatic stacker
- Flexo folder-gluers, with rotary or flatbed die cutters
- Stitching or taping units and digital presses for short runs
- Automatic bundlers, palletizers and conveyor lines
- Starch kitchen, gas or biomass boiler and condensate return
- Trim extraction system and paper baler
- Wastewater unit for starch and ink wash, plus a strength testing lab
The box-making machinery market spans builders in Europe, Taiwan and China, with a wide price spread.
Containerboard is bought regionally because freight erodes its low value. Recycled testliner and fluting come from mills in Germany, Poland, Spain, the United States, China, India and Southeast Asia. Kraftliner comes mainly from the U.S. Southeast, Sweden, Finland and Brazil. Mill demand for old corrugated containers sets the floor under recycled paper prices. Starch is made from corn, wheat or tapioca, and inks and glues are bought locally. A plant near two or more mills has real bargaining room, while a plant reliant on imported reels has to carry more stock.
Corrugated box business profit margin and ROI
Gross margin for the reference plant is estimated at 13–22%, measured as price minus board, conversion and delivery. The price anchor is FEFCO's 2023 data, where sector turnover of EUR 24.38 billion on 22.79 million metric tons works out to about EUR 1,070 per metric ton, or roughly USD 1,220 at 1.14. A new entrant's price is assumed at USD 1,100–1,220.
Assumed board prices are anchored on delivered Polish trade quotes for June 2026, with testliner near EUR 450–480, fluting at EUR 440–460 and kraftliner at EUR 850–880 per metric ton, and September brought further rises of about EUR 60 on recycled grades and EUR 80 on kraftliner. SCA's EUR 100 per metric ton kraftliner rise from April 2026 shows the same direction. Board net of trim, plus assumed conversion and delivery, puts direct cost at an estimated USD 900–1,000 per metric ton.
At 80% utilization, or 40,000 metric tons, cash profit after assumed overheads is roughly USD 4–9 million a year, so mid-range CapEx of USD 42.5 million pays back in about 5–11 years. Each unrecovered USD 50 of board cost moves annual profit by about USD 2.3 million, so the lag between paper rises and box price resets is the main risk. Asian paper and box prices run below this European anchor, so local quotes are needed.
| Metric | Value |
|---|---|
| Gross margin | 13–22% |
| Payback period | 5–11 years |
| IRR (post-tax) | Available in report |
| NPV | Available in report |
| Return on investment | Available in report |
| DSCR | Available in report |
| Break-even utilization | Available in report |
How to start a corrugated box business, licenses and approvals
The sequence is similar across countries: company and tax registration, land use and building permits, an environmental permit covering the boiler, wastewater and dust, occupational safety and fire approvals, and import-export registration where reels or boxes cross borders. Paper dust and large stocks of combustible material put fire protection high on the inspection list. Boxes for food or hazardous goods bring product-specific rules on top.
Examples by market
| Market | Key approvals for a corrugated box plant |
|---|---|
| United States | State air permit where boiler or ink emissions reach program thresholds; local wastewater discharge permit; FDA rules at 21 CFR 176.170 for paperboard contacting food; DOT standards at 49 CFR 178.516 for fiberboard boxes carrying hazardous materials |
| European Union | National environmental and building permits; Packaging and Packaging Waste Regulation (EU) 2025/40, including conformity documentation and heavy metal limits; Regulation (EC) 1935/2004 for food-contact packaging |
| India | Consent to establish and operate from the state pollution control board; state factory registration; IS 2771 is the Bureau of Indian Standards specification for corrugated fiberboard boxes; FSSAI packaging regulations for food-contact use |
The EU rule matters most right now. It has applied generally since August 12, 2026, so EU buyers increasingly ask for supplier documentation by box type. Large customers also audit plants against hygiene and fiber-sourcing schemes before awarding volume.
Key corrugated box manufacturers and recent developments
The global tier includes Smurfit Westrock, International Paper, which now owns DS Smith, Mondi and Packaging Corporation of America. Saica in Spain and Oji and Rengo in Japan are large regional groups with growing overseas networks. Smaller independent box makers also serve local customers in every region, often on purchased board. Demand for heavy-duty corrugated packaging is one area where larger plants hold a technical edge.
- January 2026: Smurfit Westrock began work on a USD 65 million plant in Ciudad Obregón, Mexico, adding a corrugated board line to serve beer, food and beverage customers in the northwest.
- May 2026: International Paper broke ground on a USD 225 million, 468,000-square-foot corrugated plant in Brandon, Mississippi, with about 150 jobs and operations due in the fourth quarter of 2027.
- June 2026: Grembox started building a converting plant in Bytom, Poland, budgeted above PLN 110 million for 40–50 million square meters a year, with no corrugator of its own.
The pattern favors modern, automated sites near big customers, replacing older plants instead of adding net supply.
What's inside the Corrugated Box project report PDF
The report runs to 21 chapters. Open a chapter to see its sections.
1. Preface
2. Scope and Methodology
- 2.1 Objectives of the Study
- 2.2 Stakeholders
- 2.3 Research Methodology
- 2.4 Data Sources and Key Assumptions
3. Executive Summary
- 3.1 Market Snapshot
- 3.2 Project at a Glance (Capacity, CapEx, OpEx)
- 3.3 Key Financial Indicators (IRR, NPV, Payback, Break-even)
- 3.4 Feasibility Verdict
4. Product Overview
- 4.1 Corrugated Box Definition and Properties
- 4.2 Grades and Specifications (BIS / ISO / ASTM)
- 4.3 HS Code and Classification
- 4.4 Key Applications
- 4.5 Substitutes
5. Global Corrugated Box Market
- 5.1 Market Overview
- 5.2 Historical and Current Market Performance (Volume and Value)
- 5.3 Market Breakup by Grade / Type
- 5.4 Market Breakup by End-Use Industry
- 5.5 Market Breakup by Region
- 5.6 Market Drivers, Restraints and Trends
- 5.7 Value Chain Analysis
- 5.8 Market Forecast
6. Target Country Corrugated Box Market Analysis
- 6.1 Demand and Supply Analysis
- 6.2 Installed Capacity vs Demand Gap
- 6.3 Import Dependence
- 6.4 Demand Forecast by End-Use
7. Trade Analysis
- 7.1 Imports by Volume, Value and Country
- 7.2 Exports by Volume, Value and Country
- 7.3 Trade Balance and Opportunities
8. Price Analysis
- 8.1 Historical Corrugated Box Price Trends by Region
- 8.2 Raw Material / Feedstock Price Trends and Linkage
- 8.3 Price Forecast
- 8.4 Margins Across the Value Chain
9. Competitive Landscape
- 9.1 Market Structure
- 9.2 Key Players and Installed Capacities
- 9.3 Profiles of Key Players
- 9.4 Recent Developments (Expansions, M&A, New Plants)
10. Manufacturing Process and Technology
- 10.1 Comparison of Technology Routes
- 10.2 Selected Route and Process Flow Diagram
- 10.3 Unit Operations Involved
- 10.4 Chemical Reactions Involved
- 10.5 Mass Balance and Raw Material Requirements
- 10.6 Energy Balance
- 10.7 Quality Assurance Criteria and Technical Tests
- 10.8 By-products and Waste Handling
- 10.9 Technology Licensors / Providers
11. Project Details, Requirements and Costs
- 11.1 Land, Location and Site Development
- 11.1.1 Site Selection Criteria
- 11.1.2 Location Analysis
- 11.1.3 Land Requirement and Costs
- 11.1.4 Site Development Costs
- 11.2 Plant Layout
- 11.2.1 Layout Principles
- 11.2.2 Proposed Layout
- 11.2.3 Factors Influencing Layout
- 11.3 Civil Works and Buildings
- 11.4 Plant Machinery
- 11.4.1 Machinery Requirements and Specifications
- 11.4.2 Machinery Costs
- 11.4.3 Machinery Suppliers
- 11.5 Raw Materials
- 11.5.1 Requirements per Tonne of Output
- 11.5.2 Procurement and Sourcing
- 11.5.3 Costs
- 11.5.4 Suppliers
- 11.6 Packaging
- 11.6.1 Packaging Requirements
- 11.6.2 Packaging Costs
- 11.6.3 Packaging Suppliers
- 11.7 Storage and Material Handling
- 11.8 Transportation Requirements and Costs
- 11.9 Utilities
- 11.9.1 Power Requirements and Costs
- 11.9.2 Water Requirements and Costs
- 11.9.3 Steam, Fuel and Other Utilities
- 11.10 Manpower Requirements and Wages
12. Environment, Health, Safety and Sustainability
- 12.1 Effluent and Emissions Management
- 12.2 Hazard Classification and Safety Measures
- 12.3 Carbon Footprint
- 12.4 Green / Low-Carbon Process Options
13. Regulatory Procedures, Approvals and Certifications
- 13.1 Licences and Registrations
- 13.2 Environmental Clearances
- 13.3 Product Certifications (BIS, REACH, etc.)
- 13.4 Approval Timeline
14. Project Implementation Schedule
15. Project Economics
- 15.1 Capital Cost of the Project
- 15.2 Techno-Economic Parameters
- 15.3 Capacity Utilization and Ramp-up
- 15.4 Product Pricing and Margins
- 15.5 Income Projections
- 15.6 Expenditure Projections
- 15.7 Working Capital Requirement
- 15.8 Taxation
- 15.9 Depreciation
16. Financial Analysis
- 16.1 Projected Profit and Loss Account
- 16.2 Projected Cash Flow Statement
- 16.3 Projected Balance Sheet
- 16.4 Liquidity Analysis
- 16.5 Profitability Analysis (Payback, NPV, IRR, ROI)
- 16.6 Break-even Analysis
- 16.7 Debt Service Coverage Ratio (DSCR)
- 16.8 Sensitivity Analysis
- 16.9 Scenario and Uncertainty Analysis
17. Funding and Incentives
- 17.1 Means of Finance and Debt-Equity Structure
- 17.2 Loans and Financial Assistance
- 17.3 Government Schemes and Subsidies (PLI, State Policies)
18. Risk Assessment
- 18.1 Key Success Factors
- 18.2 Key Risk Factors
- 18.3 Risk Mitigation
19. Strategic Recommendations
20. Case Study of a Successful Venture
21. Appendix
- 21.1 Detailed Assumptions
- 21.2 Abbreviations
- 21.3 List of Tables and Figures
- 21.4 Sources
This page vs. the full report
| Data point | On this page (free) | In the full report |
|---|---|---|
| Total CapEx | One rounded range at one capacity | Exact figure at three capacities with a line-item breakup |
| CapEx breakup | Category shares (%) only | Cost, quantity and supplier for every machine |
| Operating cost | Share of raw materials, utilities and labor | Per-unit cost sheet with each input price and consumption |
| Profitability | Gross margin range and payback band | Exact IRR, NPV, ROI, break-even and DSCR |
| Financial statements | List of what is included | 10-year P&L, cash flow, balance sheet and Excel model |
| Sensitivity | One directional line | Full sensitivity and scenario tables |
| Process | Simplified flow diagram | Detailed process flow, mass and energy balance, operating conditions |
| Machinery | Names of the main machines | Specifications, capacity, cost and supplier list |
| Market | Headline size, growth and global demand | Segment, region, trade and price forecast tables |
| Suppliers and buyers | Supplier types and sourcing hubs | Named suppliers and buyers |
Corrugated Box project report: FAQs
How much does it cost to set up a corrugated box manufacturing plant?
Should a new box plant install its own corrugator?
What is the profit margin in corrugated box manufacturing?
What is the payback period for a corrugated box plant?
Which approvals does a corrugated box plant need?
Where do box makers source containerboard?
Why are corrugated boxes rarely shipped long distances?

About the analyst
Satyabrat Rajawat, Senior Research Analyst – Strategic Advisory
Satyabrat Rajawat is a Senior Research Analyst in the Strategic Advisory practice at Credence Research Inc. He works across domains, with the deepest coverage in packaging, automotive parts and machinery, and sits at the point where a client question becomes a research plan: he works with sales and business development teams to scope RFP and RFI responses, set the project methodology, and then build the quantitative databases and econometric forecasts that answer it.
Related market research
- Containerboard Market Size, Trends, Share and Forecast 2032
- Corrugated Box Making Machine Market Size, Share and Forecast 2032
- Old Corrugated Containers Market Size, Growth and Forecast 2032
- Heavy Duty Corrugated Packaging Market Size, Share and Forecast 2032
- Corrugated Fanfold Packaging Market Size, Trends, Share & Forecast 2032
More plant project reports
- Egg Tray Manufacturing Plant Project Report (DPR) 2026
- Aluminum Foil Manufacturing Plant Project Report (DPR) 2026
- PET Bottle Manufacturing Plant Project Report (DPR) 2026
- Recycled Copper Manufacturing Plant Project Report (DPR) 2026
- Condom Manufacturing Plant Project Report (DPR) 2026
- Medical Oxygen Manufacturing Plant Project Report (DPR) 2026