
Quick answer
An egg tray plant turns recovered paper into molded pulp trays, usually for 30 eggs. A representative line making about 30 million trays a year needs roughly USD 1.2–2.5 million in CapEx at an Asian or emerging-market site. Gross margin runs about 25–40% and payback about 4–10 years, depending mainly on tray prices, drying fuel and how far the trays must travel to egg farms.
Viable as a regional business close to layer farms with cheap drying fuel and steady waste paper, but thin once trays must be hauled long distances or sold against an established low-cost local maker.
Egg Tray plant: key highlights
| Parameter | Indicative value | Note |
|---|---|---|
| Plant capacity | About 30 million trays per year | One forming line of about 5,000 trays an hour, 80% utilization assumed |
| Total CapEx | USD 1.2–2.5 million | Greenfield, Asian or emerging-market park; a European-class machine lifts it to USD 4 million or more |
| Raw material share of operating cost | 25–35% | Recovered paper and additives; drying fuel is nearly as large |
| Gross margin | 25–40% | Assumed ex-works price less paper, energy, labor, upkeep and delivery |
| Payback period | 4–10 years | At mid-range CapEx and 80% utilization, before tax and financing |
| IRR | Available in report | Post-tax, 10-year model |
| Break-even | Available in report | Capacity utilization basis |
Ranges assume about 30 million trays a year of nameplate output, 24 million sold at 80% utilization, one forming line, an Asian or emerging-market greenfield site, 2026 prices, and assumed tray prices, land, building, fuel and power rates. Pounds converted at an assumed 1.33, dirhams at an assumed 9.2 and rupees at an assumed 88 per USD. U.S. and EU sites cost more. Customizable to any country.
What is an egg tray?
An egg tray is a molded fiber flat, most often with 30 cavities, that holds eggs in stacks on the farm, in grading rooms, on trucks and in wholesale markets. It is formed wet from pulped waste paper on a mesh mold, then dried. Typical trays weigh about 70–100 grams, and the pocket geometry, more than the weight, decides how many eggs survive a rough road.
The main grades are standard gray farm trays, stronger long-haul trays with better moisture resistance, and larger trays for jumbo or duck eggs. Smaller retail cartons with lids use the same fiber but tighter tolerances, printing and higher-end tooling, so most small plants leave them to specialists.
In international trade, molded pulp trays are classified under HS code 482370, moulded or pressed articles of paper pulp. The buyers are layer farms, egg traders, graders and packing stations, while the same HS code also covers fruit trays and protective inserts. Fiber trays compete mainly with reusable plastic trays and foam, and they gain ground wherever retailers or regulators push against plastic.
Egg tray market overview and global demand
Credence Research values the global disposable tray segment for eggs at USD 2,133 million in 2024, growing at a 4.1% CAGR to USD 2,941 million by 2032. That implies about USD 2.2 billion in 2025, derived from the 2024 figure and the CAGR rather than separately reported. The wider molded fiber packaging category is larger and faster growing, at USD 5,245 million in 2024 and a 7.6% CAGR, because it also includes food-service and protective uses.
Physical demand follows hens. FAO data reported in 2025 put China at about 30.6 million metric tons of eggs in 2023, or 33.6% of the world total, with the United States and Indonesia near 6.5 million each and the top 10 countries at 71.9%. Those shares imply a world output near 91 million metric tons. At an assumed 60 grams an egg, that is about 50 billion 30-egg tray loads a year, although many trays are reused and many eggs move in cartons or plastic.
Three things shape where new plants make sense. Trays are bulky and low in value, so most supply stays regional and long-distance trade is limited, and customs totals for HS 482370 also mix in non-egg articles. New capacity tends to suit places where egg output is expanding and bulk trade in flats is common, such as parts of South and Southeast Asia, Africa and Latin America. In North America and Europe the driver is the shift from foam and plastic to fiber, which favors retail cartons more than farm flats. The China tray packaging market alone stood at USD 242.94 million in 2024, showing how much value sits in a single large producing country.
Egg tray manufacturing process
Tray making is a simple chemistry-free process with one expensive step. Roughly speaking, the plant is a machine for removing water, and most of the engineering and operating cost goes into doing that cheaply.
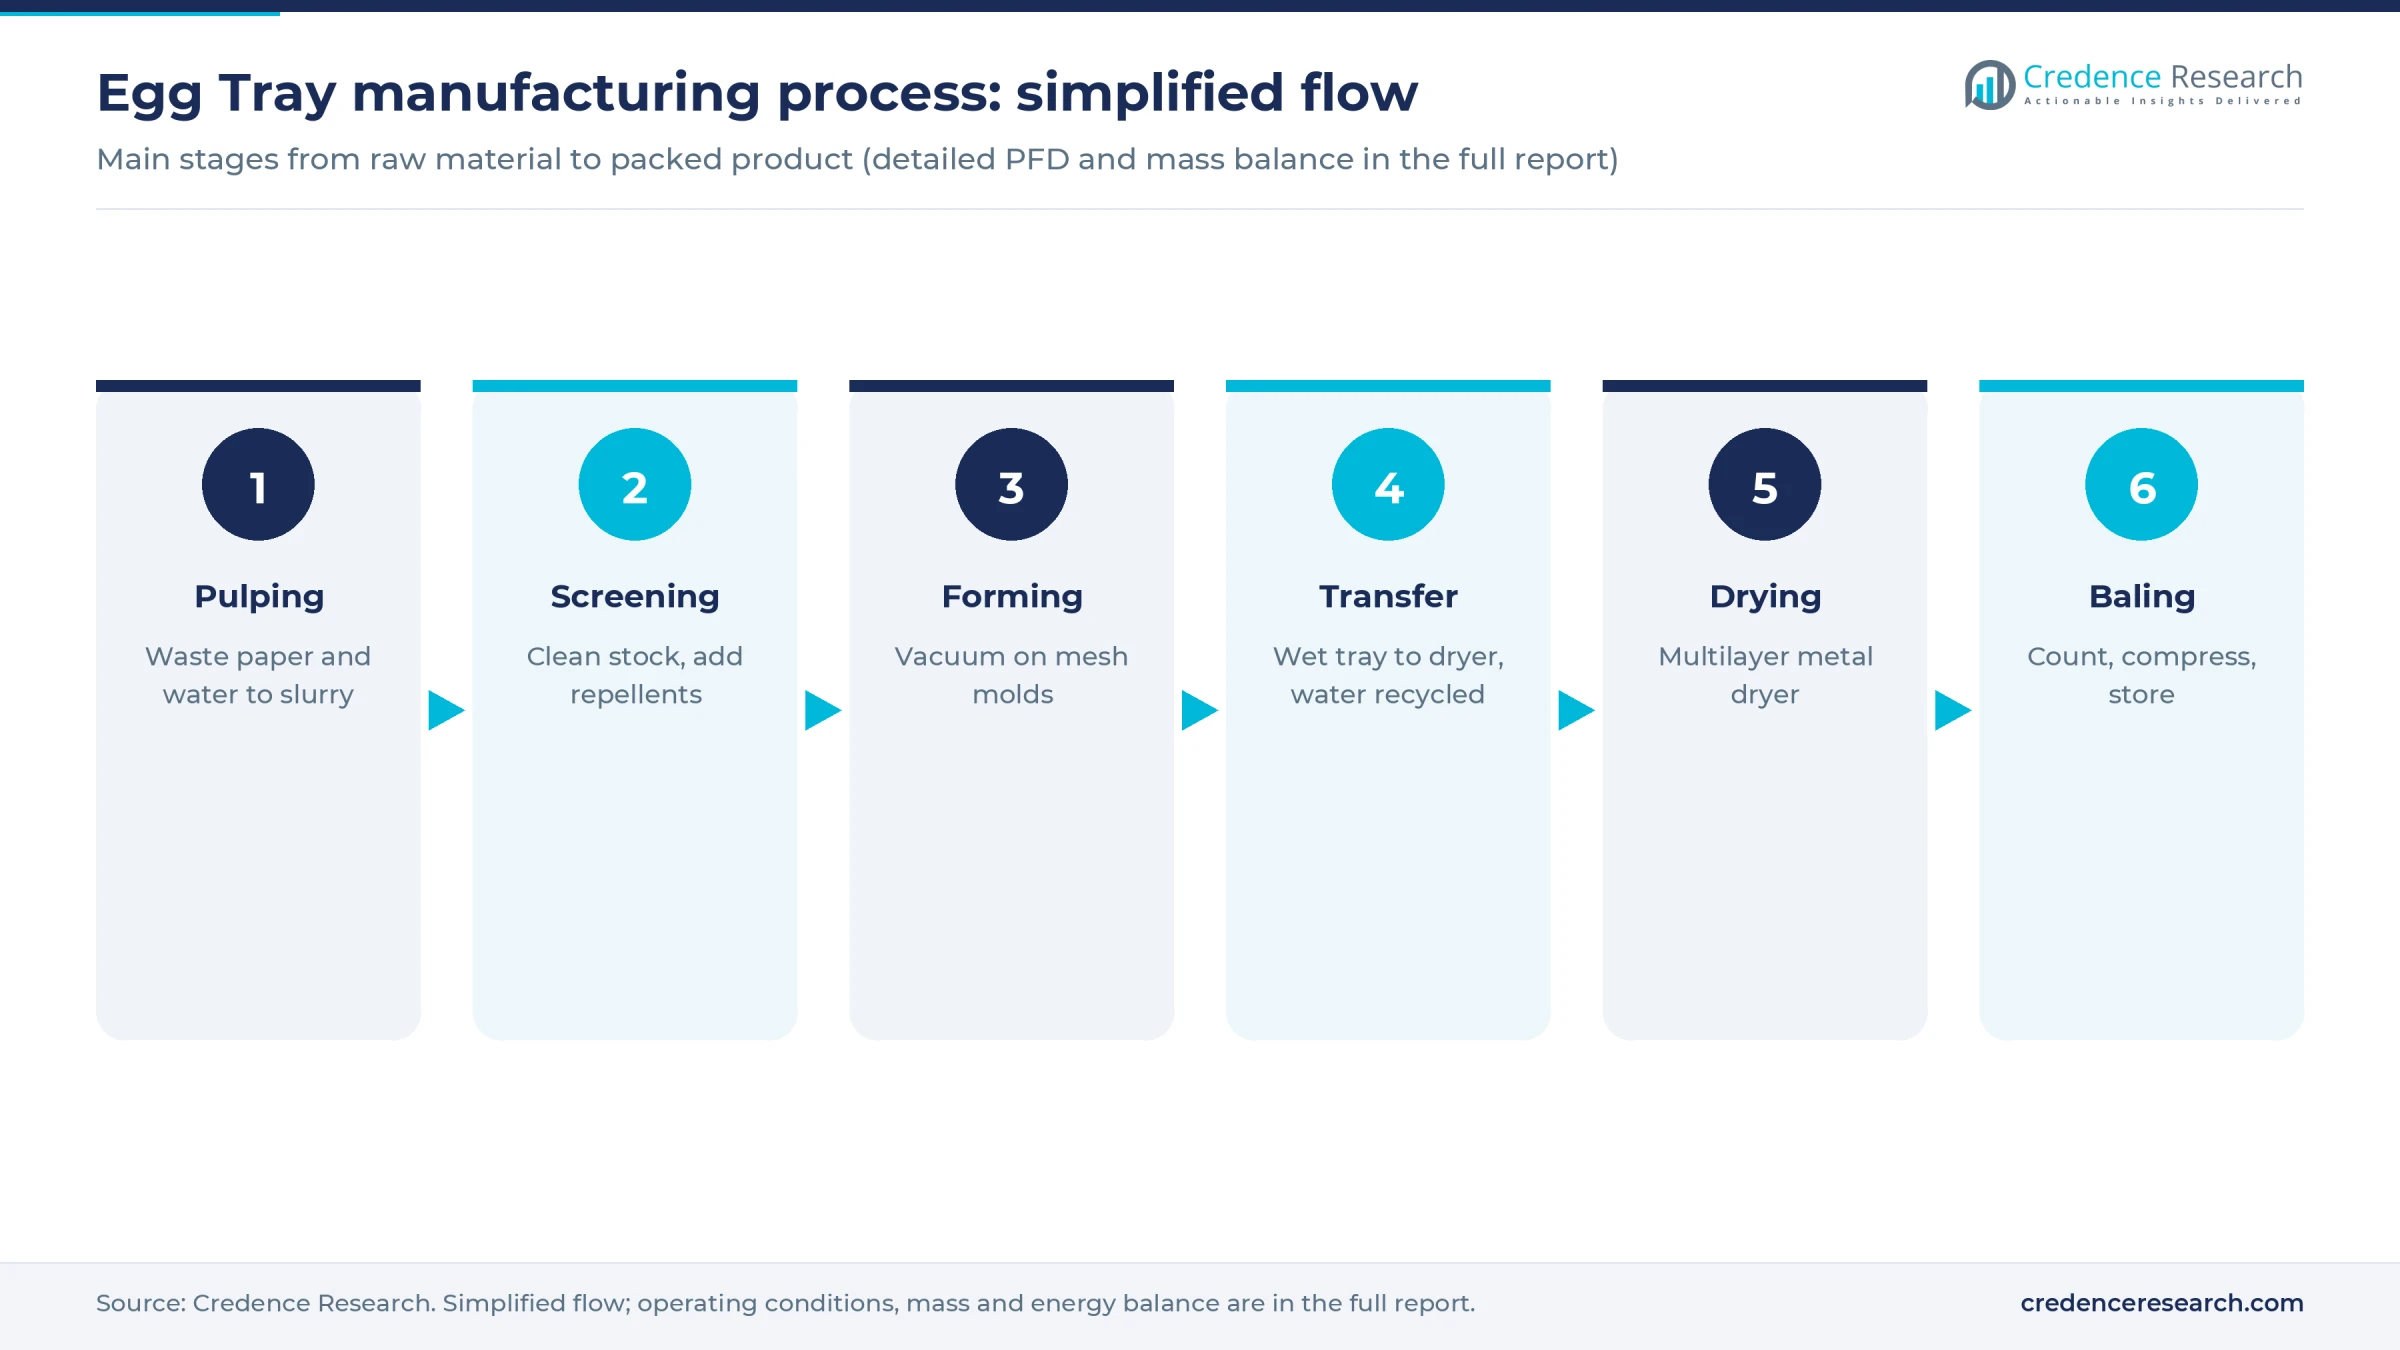
- Paper sorting and pulping. Waste paper is fed to a hydrapulper with water. Workers remove plastic, tape and metal first, because contaminants damage molds and leave weak spots in the tray.
- Refining and stock preparation. Screens clean the slurry, and a tank holds it at a controlled low consistency. Water-repellent additives may be dosed here for long-haul or humid-climate grades.
- Vacuum forming. A rotary or reciprocating former dips mesh molds into the slurry and pulls water through, leaving a wet fiber shape. Mold design is the main quality lever.
- Transfer. Pressure or a matched transfer die moves the wet tray to a conveyor. Water removed in forming goes straight back to the pulping tank, which keeps fresh water use low.
- Drying. A multilayer metal dryer fired by natural gas, LPG, diesel or biomass takes about 15–20 minutes. Small plants in hot, dry regions sometimes sun-dry, but that ties up land and fails in the rainy season.
- Stacking and baling. Dried trays are counted, compressed into bales and stored. Hot pressing can be added for smooth premium trays, at the price of more equipment and energy.
The main yield losses come from breakage at transfer and from over-drying, which makes trays brittle. Scrap goes back into the pulper, so waste is low. The critical control points are stock consistency, vacuum level and dryer temperature profile, since a tray that looks fine can still crack under a stack of full flats. Good plants test cavity strength and moisture on every shift, and they rehearse mold changes, because a farm customer rarely tolerates a tray that jams its grader.
Egg tray plant setup cost
A representative greenfield plant making about 30 million trays a year costs roughly USD 1.2–2.5 million at an Asian or emerging-market site, at 2026 prices. The basis is a published equipment-maker model for a comparable 5,000-tray line, which totals about USD 640,000 including building but before land, utilities and working capital. It reflects China conditions, so the range adds an assumed larger building, land, utilities, contingency and working capital.
Two public markers show the spread above that. A 2014 South African molded fiber investment suggests a higher-specification European-class line could take a similar plant to USD 4 million or more. Hartmann's Missouri carton plant, announced at about USD 30 million in 2016 for 334,000 square feet, is a far larger multi-line operation and is not scaled here. At the small end, a Moroccan regional investment profile lists 1–2 million dirhams, about USD 110,000–220,000 at an assumed 9.2, for a very small unit.
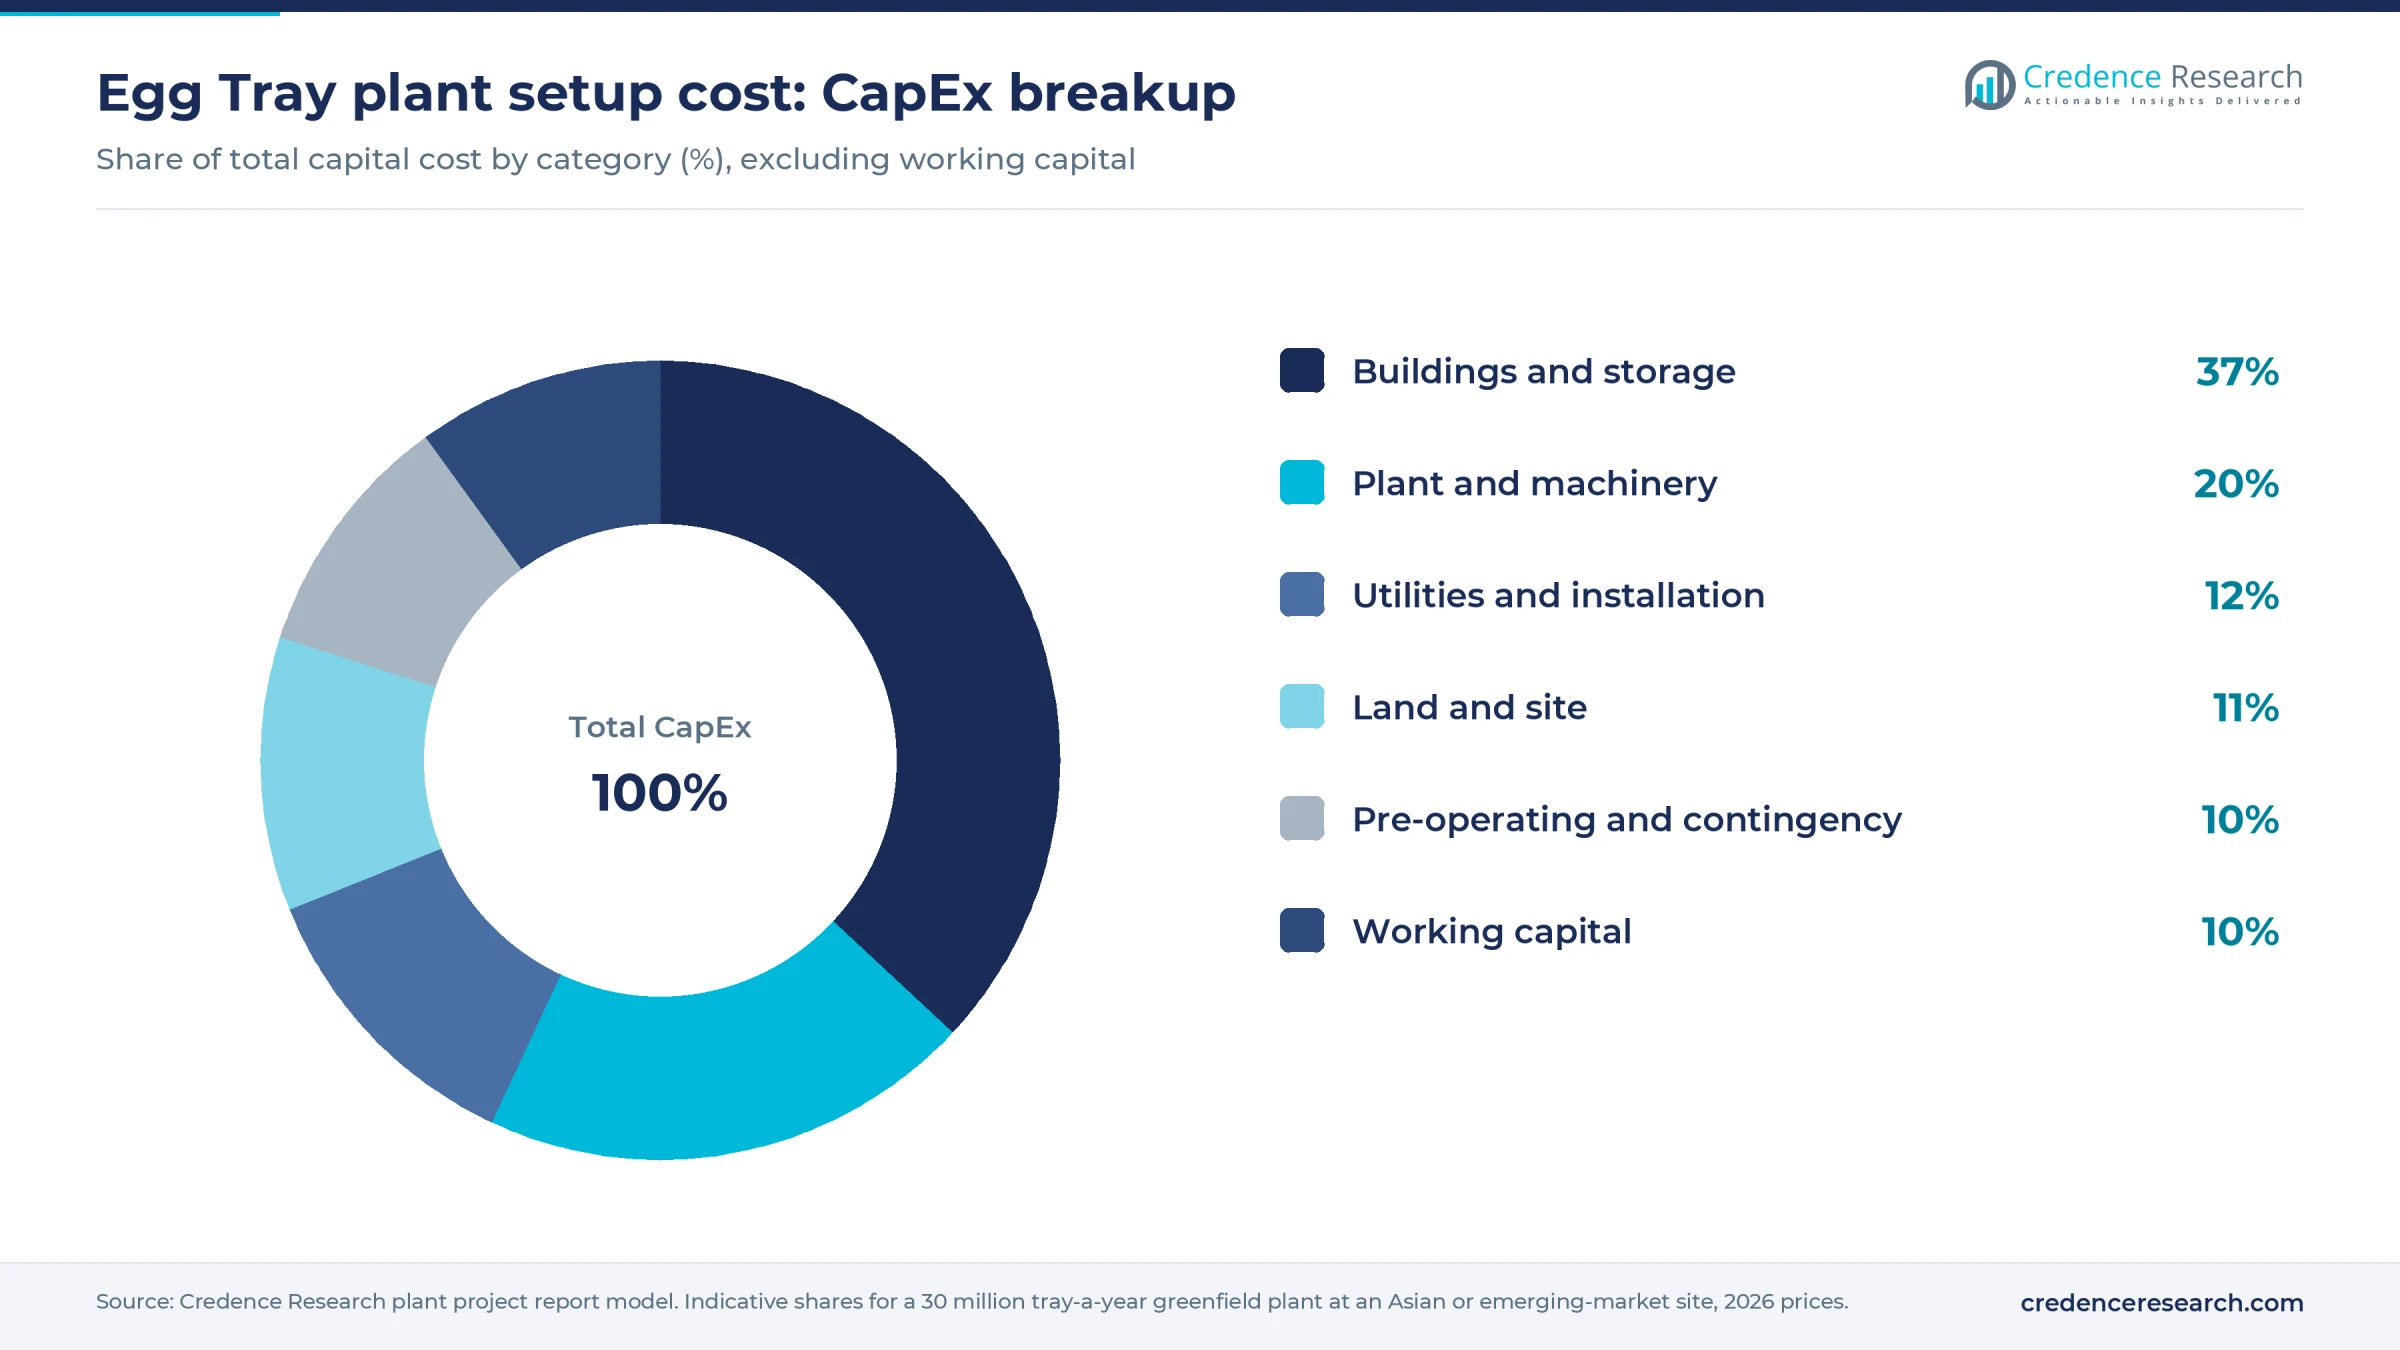
Buildings take the largest share, which surprises many first-time investors. Finished trays are light but bulky, so storage space drives the footprint. As a worked example, land for the plant needs about 4,000–5,000 square meters. At an assumed USD 30–60 per square meter in an Asian or emerging-market industrial park, that is about USD 120,000–300,000, or roughly 10–12% of mid-range CapEx. Many U.S. and EU sites would cost several times more, so the same plant can look very different by country. The full report can be customized to any country or region.
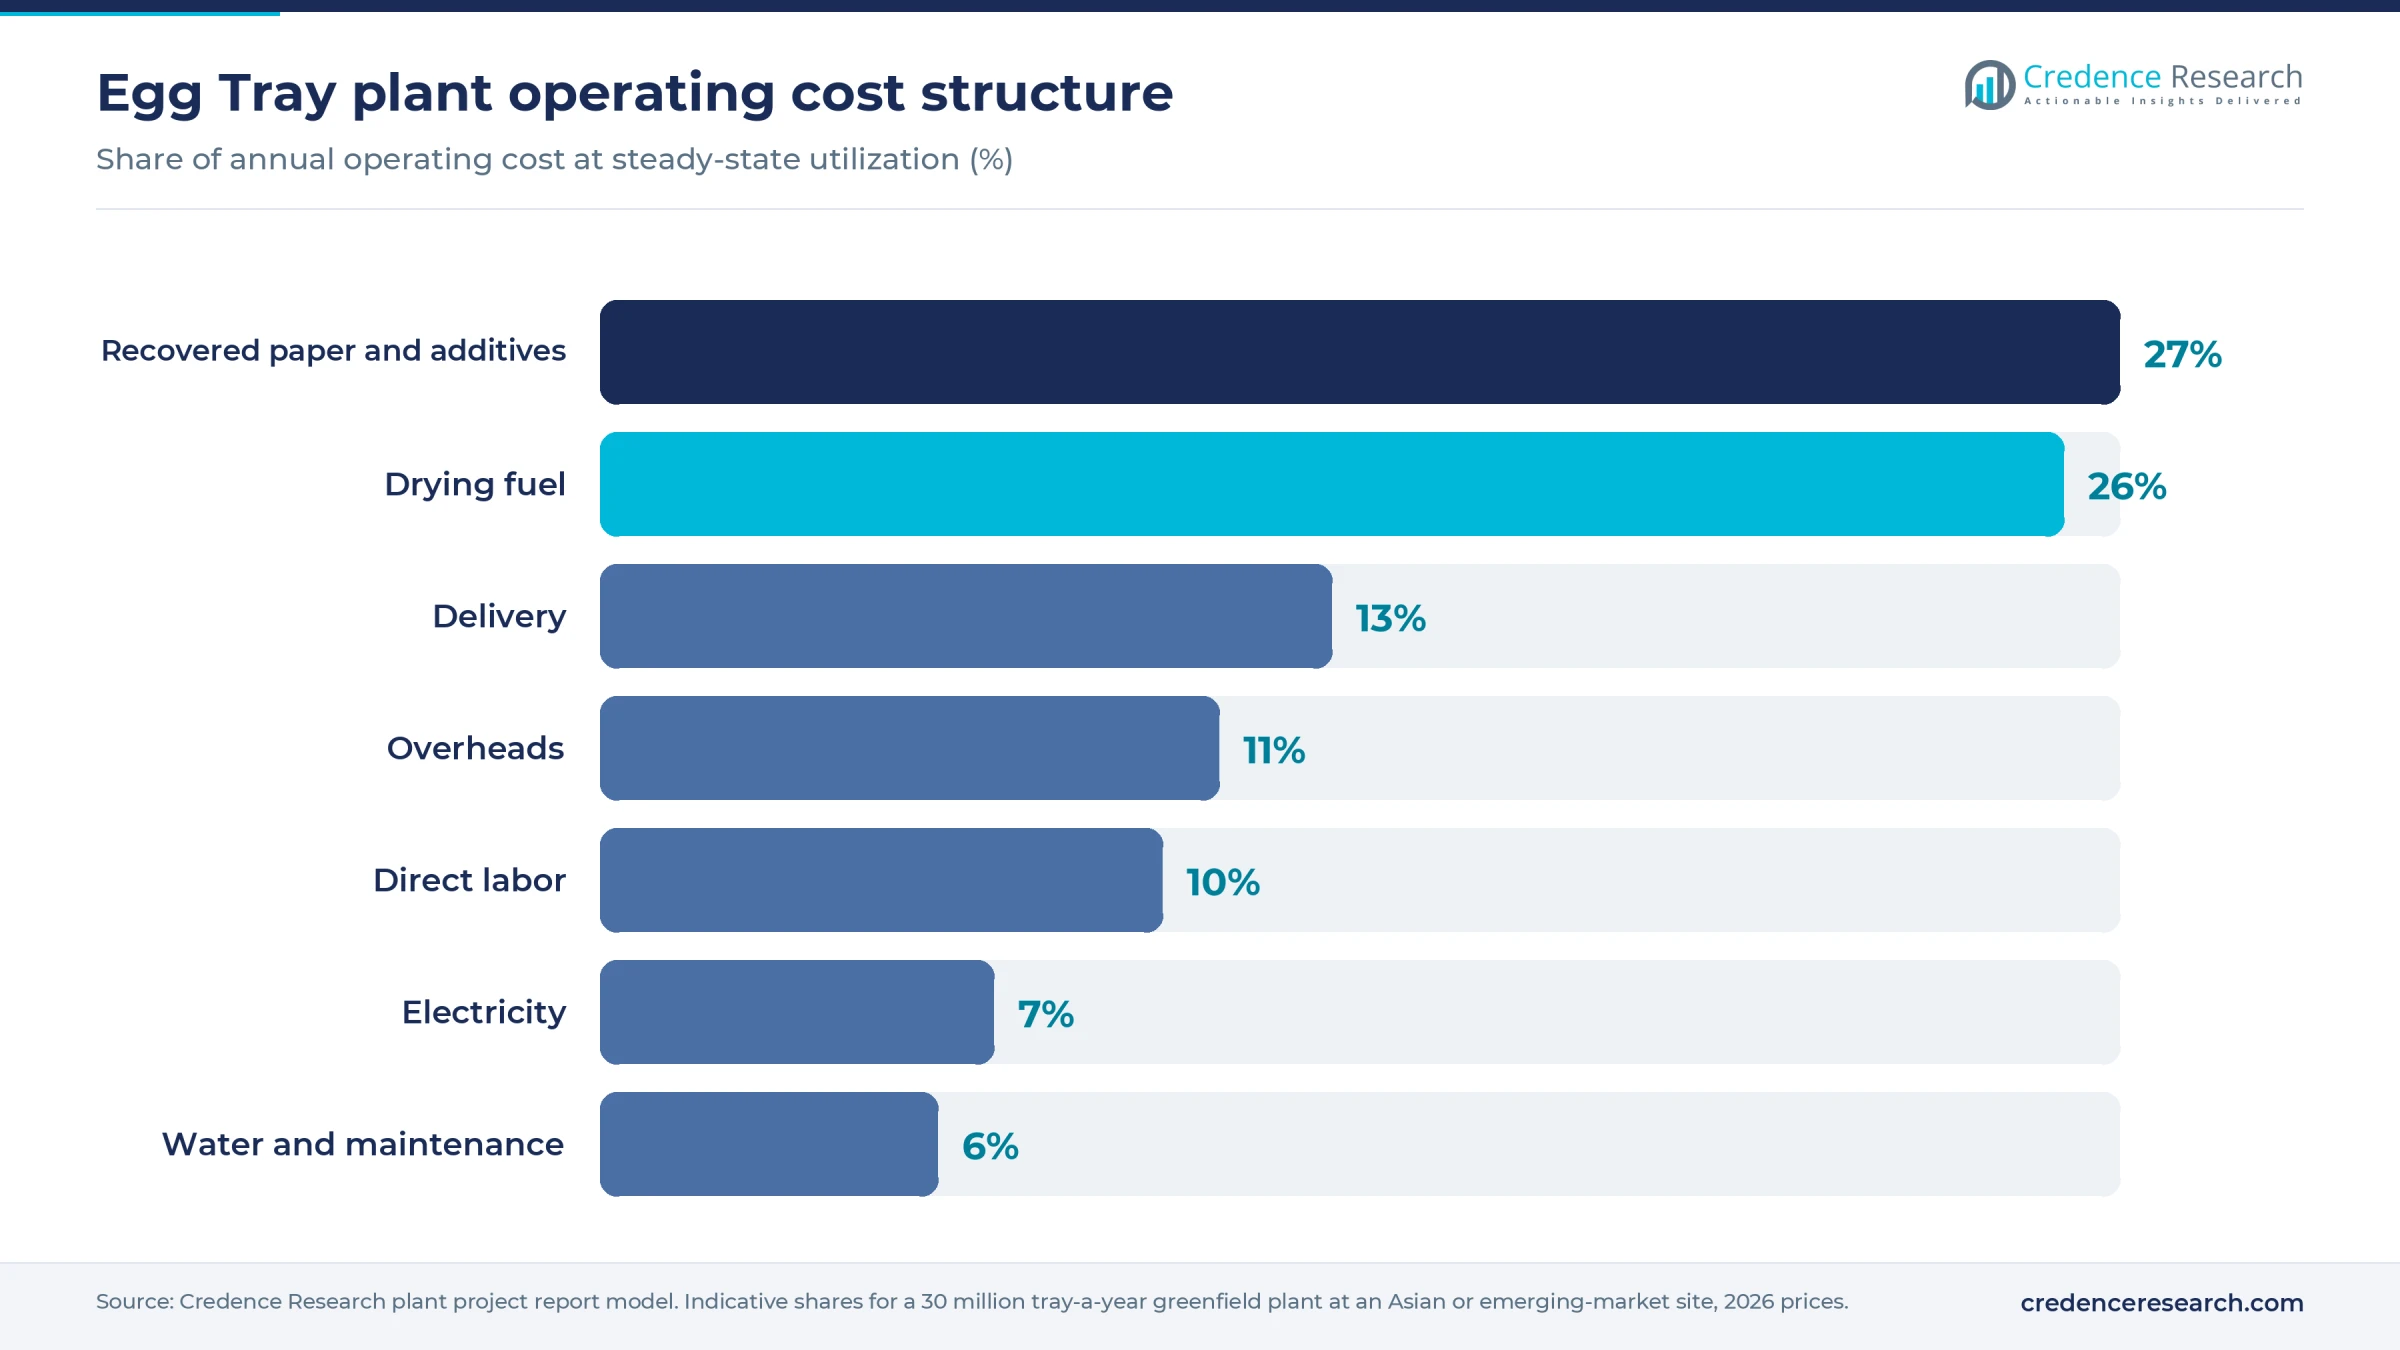
On the operating side, recovered paper and drying fuel are close in size, which is unusual for a packaging product. Delivery is the next large line because of the bulk. Exact line items and unit costs are available in the report.
Machinery and raw materials for an egg tray plant
Core machinery includes a hydrapulper, pulp screens and refiners, stock tanks and pumps, a vacuum forming machine with mold sets, a vacuum pump and air compressor, a multilayer metal dryer with burner, a counter and stacker, and a baling press. Support items include a water recirculation loop, a forklift, a transformer and fire protection. Hot press units are optional. Budget lines commonly come from China and India, while higher-speed automated machines cost far more and mainly suit retail cartons.
Fiber is mixed recovered paper: old newspapers, office waste, cardboard and carton scrap. It is a local purchase almost everywhere because low-value paper does not justify long hauls, and the best-collected supplies are in North America, Europe, Japan and big Asian cities. UK indicators for October 2026 show mixed papers at GBP 40–60 per metric ton and news and pams at GBP 75–92, ex works, which works out to about USD 53–122 at an assumed 1.33. Prices in regions with poor collection can be higher despite lower incomes.
Drying fuel depends on geography: pipeline gas across North America, the Middle East and much of Asia, LPG or diesel in places without a grid, and biomass in agricultural regions. A plant that can burn cheap biomass legally gains a real edge, provided its air permit allows it. Water use is modest because the loop is closed.
Egg tray business profit margin and ROI
Gross margin for the representative plant runs about 25–40%. The range comes from assumed ex-works prices of USD 0.046–0.057 per tray, set against listed trade prices of about USD 0.04–0.06 in India, a South African distributor price near USD 0.10 at an assumed 17.5 rand, and a published equipment-maker price of USD 0.05. Costs combine that maker's paper and energy consumption with assumed fuel, power, wage and freight rates. As a cross-check, the Moroccan investment profile cites a 20–30% gross margin for a smaller unit, below most of this range, which is a fair warning about small scale.
Payback is about 4–10 years at mid-range CapEx and 80% utilization, before tax and financing. Equipment sellers often advertise far quicker returns, but those models typically cost waste paper at nothing and ignore delivery. The honest driver list is short: price, fuel, distance and how full the line runs.
One directional sensitivity shows why fuel matters: a rise of USD 0.10 per cubic meter in natural gas takes roughly USD 50,000 a year off cash profit at this volume, a large bite from a plant of this size. The biggest risks are price pressure from an established regional maker and losing a single large farm account.
| Metric | Value |
|---|---|
| IRR | Available in report |
| NPV | Available in report |
| ROI | Available in report |
| DSCR | Available in report |
How to start an egg tray business, licenses and approvals
The steps are similar across countries: company and tax registration, land use and building permits, an environmental permit covering dryer emissions and process water, factory and occupational safety registration, and fire approval, which matters because a plant stores large volumes of dry paper. Trays that touch eggs fall under food-contact packaging rules in many markets, and recycled fiber draws particular attention. Import or export registration applies where trays or waste paper cross borders, and recovered paper shipments can face their own waste-shipment controls.
Examples by market
| Market | Key approvals for an egg tray plant |
|---|---|
| United States | State air permit where dryer burner emissions reach program thresholds; local wastewater discharge approval; FDA food-contact rules, including 21 CFR 176.260 on pulp from reclaimed fiber |
| European Union | National environmental and building permits; Regulation (EC) 1935/2004 for food-contact materials; Packaging and Packaging Waste Regulation (EU) 2025/40 conformity documentation |
| India | Consent to Establish and Consent to Operate from the state pollution control board; state factory registration; Food Safety and Standards (Packaging) Regulations, 2018, from FSSAI, for food-contact use |
Because the shell sits between the tray and the contents, much of the practical pressure comes from buyers, who may ask for evidence on contaminants in recycled fiber. Local counsel should confirm the requirements for the chosen site.
Key egg tray manufacturers and recent developments
Hartmann of Denmark is the best-known global specialist, with plants across Europe, the Americas and India. Huhtamaki of Finland makes fiber egg packaging in several regions, including South Africa and the U.S. CKF supplies pulp cartons and filler flats across the U.S. and Canada. Beyond those names, farm trays are largely a business of small regional makers, often privately held, and that is where a new entrant mostly competes. A related view of competing materials appears in the plastic egg packaging market report.
- January 2026. Hartmann North America announced another expansion for 2027, part of more than USD 100 million invested in U.S. and Canadian operations from 2024 through 2027.
- September 2026. Hartmann said it had closed its purchase of molded fiber maker SC Dentaş Romania after regulatory approval.
- November 2026. Hartmann said a 50% U.S. tariff on its Canadian-made egg cartons, in force from August, was removed on Oct. 30, a reminder of the trade risk in cross-border supply.
What's inside the Egg Tray project report PDF
The report runs to 21 chapters. Open a chapter to see its sections.
1. Preface
2. Scope and Methodology
- 2.1 Objectives of the Study
- 2.2 Stakeholders
- 2.3 Research Methodology
- 2.4 Data Sources and Key Assumptions
3. Executive Summary
- 3.1 Market Snapshot
- 3.2 Project at a Glance (Capacity, CapEx, OpEx)
- 3.3 Key Financial Indicators (IRR, NPV, Payback, Break-even)
- 3.4 Feasibility Verdict
4. Product Overview
- 4.1 Egg Tray Definition and Properties
- 4.2 Grades and Specifications (BIS / ISO / ASTM)
- 4.3 HS Code and Classification
- 4.4 Key Applications
- 4.5 Substitutes
5. Global Egg Tray Market
- 5.1 Market Overview
- 5.2 Historical and Current Market Performance (Volume and Value)
- 5.3 Market Breakup by Grade / Type
- 5.4 Market Breakup by End-Use Industry
- 5.5 Market Breakup by Region
- 5.6 Market Drivers, Restraints and Trends
- 5.7 Value Chain Analysis
- 5.8 Market Forecast
6. Target Country Egg Tray Market Analysis
- 6.1 Demand and Supply Analysis
- 6.2 Installed Capacity vs Demand Gap
- 6.3 Import Dependence
- 6.4 Demand Forecast by End-Use
7. Trade Analysis
- 7.1 Imports by Volume, Value and Country
- 7.2 Exports by Volume, Value and Country
- 7.3 Trade Balance and Opportunities
8. Price Analysis
- 8.1 Historical Egg Tray Price Trends by Region
- 8.2 Raw Material / Feedstock Price Trends and Linkage
- 8.3 Price Forecast
- 8.4 Margins Across the Value Chain
9. Competitive Landscape
- 9.1 Market Structure
- 9.2 Key Players and Installed Capacities
- 9.3 Profiles of Key Players
- 9.4 Recent Developments (Expansions, M&A, New Plants)
10. Manufacturing Process and Technology
- 10.1 Comparison of Technology Routes
- 10.2 Selected Route and Process Flow Diagram
- 10.3 Unit Operations Involved
- 10.4 Chemical Reactions Involved
- 10.5 Mass Balance and Raw Material Requirements
- 10.6 Energy Balance
- 10.7 Quality Assurance Criteria and Technical Tests
- 10.8 By-products and Waste Handling
- 10.9 Technology Licensors / Providers
11. Project Details, Requirements and Costs
- 11.1 Land, Location and Site Development
- 11.1.1 Site Selection Criteria
- 11.1.2 Location Analysis
- 11.1.3 Land Requirement and Costs
- 11.1.4 Site Development Costs
- 11.2 Plant Layout
- 11.2.1 Layout Principles
- 11.2.2 Proposed Layout
- 11.2.3 Factors Influencing Layout
- 11.3 Civil Works and Buildings
- 11.4 Plant Machinery
- 11.4.1 Machinery Requirements and Specifications
- 11.4.2 Machinery Costs
- 11.4.3 Machinery Suppliers
- 11.5 Raw Materials
- 11.5.1 Requirements per Tonne of Output
- 11.5.2 Procurement and Sourcing
- 11.5.3 Costs
- 11.5.4 Suppliers
- 11.6 Packaging
- 11.6.1 Packaging Requirements
- 11.6.2 Packaging Costs
- 11.6.3 Packaging Suppliers
- 11.7 Storage and Material Handling
- 11.8 Transportation Requirements and Costs
- 11.9 Utilities
- 11.9.1 Power Requirements and Costs
- 11.9.2 Water Requirements and Costs
- 11.9.3 Steam, Fuel and Other Utilities
- 11.10 Manpower Requirements and Wages
12. Environment, Health, Safety and Sustainability
- 12.1 Effluent and Emissions Management
- 12.2 Hazard Classification and Safety Measures
- 12.3 Carbon Footprint
- 12.4 Green / Low-Carbon Process Options
13. Regulatory Procedures, Approvals and Certifications
- 13.1 Licences and Registrations
- 13.2 Environmental Clearances
- 13.3 Product Certifications (BIS, REACH, etc.)
- 13.4 Approval Timeline
14. Project Implementation Schedule
15. Project Economics
- 15.1 Capital Cost of the Project
- 15.2 Techno-Economic Parameters
- 15.3 Capacity Utilization and Ramp-up
- 15.4 Product Pricing and Margins
- 15.5 Income Projections
- 15.6 Expenditure Projections
- 15.7 Working Capital Requirement
- 15.8 Taxation
- 15.9 Depreciation
16. Financial Analysis
- 16.1 Projected Profit and Loss Account
- 16.2 Projected Cash Flow Statement
- 16.3 Projected Balance Sheet
- 16.4 Liquidity Analysis
- 16.5 Profitability Analysis (Payback, NPV, IRR, ROI)
- 16.6 Break-even Analysis
- 16.7 Debt Service Coverage Ratio (DSCR)
- 16.8 Sensitivity Analysis
- 16.9 Scenario and Uncertainty Analysis
17. Funding and Incentives
- 17.1 Means of Finance and Debt-Equity Structure
- 17.2 Loans and Financial Assistance
- 17.3 Government Schemes and Subsidies (PLI, State Policies)
18. Risk Assessment
- 18.1 Key Success Factors
- 18.2 Key Risk Factors
- 18.3 Risk Mitigation
19. Strategic Recommendations
20. Case Study of a Successful Venture
21. Appendix
- 21.1 Detailed Assumptions
- 21.2 Abbreviations
- 21.3 List of Tables and Figures
- 21.4 Sources
This page vs. the full report
| Data point | On this page (free) | In the full report |
|---|---|---|
| Total CapEx | One rounded range at one capacity | Exact figure at three capacities with a line-item breakup |
| CapEx breakup | Category shares (%) only | Cost, quantity and supplier for every machine |
| Operating cost | Share of raw materials, utilities and labor | Per-unit cost sheet with each input price and consumption |
| Profitability | Gross margin range and payback band | Exact IRR, NPV, ROI, break-even and DSCR |
| Financial statements | List of what is included | 10-year P&L, cash flow, balance sheet and Excel model |
| Sensitivity | One directional line | Full sensitivity and scenario tables |
| Process | Simplified flow diagram | Detailed process flow, mass and energy balance, operating conditions |
| Machinery | Names of the main machines | Specifications, capacity, cost and supplier list |
| Market | Headline size, growth and global demand | Segment, region, trade and price forecast tables |
| Suppliers and buyers | Supplier types and sourcing hubs | Named suppliers and buyers |
Egg Tray project report: FAQs
How much does it cost to set up an egg tray plant?
What is the profit margin in egg tray manufacturing?
How long does an egg tray plant take to pay back?
Which raw materials does an egg tray plant need?
What is the HS code for egg trays?
Why are egg tray plants usually regional?

About the analyst
Satyabrat Rajawat, Senior Research Analyst – Strategic Advisory
Satyabrat Rajawat is a Senior Research Analyst in the Strategic Advisory practice at Credence Research Inc. He works across domains, with the deepest coverage in packaging, automotive parts and machinery, and sits at the point where a client question becomes a research plan: he works with sales and business development teams to scope RFP and RFI responses, set the project methodology, and then build the quantitative databases and econometric forecasts that answer it.
Related market research
- Disposable Egg Trays Market Size, Share and Growth Report 2032
- Molded Pulp Packaging Market Size, Growth and Forecast 2032
- China Egg Tray Packaging Market Size, Trends, Share & Forecast 2032
- Plastic-Based Egg Packaging Market Size, Growth and Forecast 2032
- Recycled Paper Packaging Market Size, Share, Growth and Forecast 2032
More plant project reports
- Corrugated Box Manufacturing Plant Project Report (DPR) 2026
- Aluminum Foil Manufacturing Plant Project Report (DPR) 2026
- PET Bottle Manufacturing Plant Project Report (DPR) 2026
- Recycled Copper Manufacturing Plant Project Report (DPR) 2026
- Condom Manufacturing Plant Project Report (DPR) 2026
- Medical Oxygen Manufacturing Plant Project Report (DPR) 2026