
Quick answer
A PET bottle manufacturing plant injection molds resin into preforms, then stretch blow molds them into bottles. A two-stage greenfield unit rated at about 200 million 500 ml-equivalent bottles a year needs an estimated USD 8–16 million of CapEx. Resin is about two-thirds of operating cost and usually passes through to buyers, leaving a gross margin of 18–30%. Payback is about 6–12 years at mid-range CapEx, faster with anchor filler contracts.
Viable as a regional converter or an in-plant supplier with anchor filler contracts, but thin on a merchant basis because freight limits reach and resin passes through.
PET Bottle plant: key highlights
| Parameter | Indicative value | Note |
|---|---|---|
| Plant capacity | About 200 million bottles per year | Two-stage unit, 500 ml equivalent, blended 22 g bottle weight |
| Total CapEx | USD 8–16 million | Greenfield; low end reflects Asian parks, top end U.S. or EU sites |
| Raw material share of operating cost | 62–72% | Bottle-grade PET resin, virgin or recycled |
| Gross margin | 18–30% | Price minus resin and direct conversion cost |
| Payback period | 6–12 years | 85% utilization, mid-range CapEx; shorter with low-cost sites and contracted volume |
| IRR | Available in report | Post-tax, 10-year model |
| Break-even | Available in report | Capacity utilization basis |
Ranges assume a two-stage greenfield plant of about 200 million 500 ml-equivalent bottles a year at a blended 22 g, Asian to U.S. or EU industrial sites, 2026 prices, 85% utilization, resin at an assumed USD 0.90–1.15 per kg and a bottle price at an assumed USD 0.038–0.047; CapEx scaled from disclosed investments at GBP 1 = USD 1.65 and 83 rupees per USD. Customizable to any country.
What is a PET bottle?
PET bottles are rigid containers molded from polyethylene terephthalate, a clear, strong and lightweight polyester. Most are made in two stages: resin is injection molded into a test-tube-shaped preform, which is later reheated and stretch blow molded into the finished container. Water, carbonated soft drinks, juice, edible oil, sauces, household liquids and personal care products are the main end uses.
Buyers specify bottles by volume, gram weight, neck finish and the pressure they must hold. A 500 ml still-water bottle can weigh well under 20 grams, while a carbonated soft drink bottle of the same size needs a heavier base and wall. Hot-fill, barrier and recycled-content grades add cost and qualification time.
Under the Harmonized System, plastic carboys, bottles and flasks fall under subheading 3923.30, which covers every plastic and not only PET, so trade data for the code overstate PET-specific flows. Bottle-grade resin trades separately under subheading 3907.61. Empty bottles are mostly air and rarely travel far, which is why many converters ship compact preforms to a blower near the filler or run blowing inside the filling plant.
PET bottle market overview and global demand
The global PET packaging market stands at about USD 89.3 billion in 2025, based on Credence Research's estimate of USD 85.8 billion for 2024 and a 4.1% CAGR through 2032. That figure spans bottles, jars, trays and film, so it frames the wider category rather than bottles alone. The recycled-content bottle segment is far smaller, at about USD 2.6 billion in 2025 based on USD 2.4 billion for 2024 and a 9.54% CAGR, but it is growing more than twice as fast.
Trade data show how regional the finished product is. UN Comtrade data for HS 392330 show 2024 exports of about USD 11.7 billion among reporting countries, led by China at USD 2.4 billion, France at USD 1.0 billion, Germany at USD 0.9 billion and the United States at USD 0.7 billion, across all plastics. Resin is far more global: reporting countries exported about 11.2 million metric tons under HS 390761 in 2025, and China alone shipped about 6.5 million at roughly USD 0.79 per kg.
Resin supply is long worldwide. Commodity trader Czarnikow put world bottle-grade capacity near 34.7 million metric tons in 2022, with about 38% in China. Long supply helps converters but does not widen their spread, because contracts pass resin through. Volume growth comes from bottled water and beverage packaging in Asia, the Middle East, Africa and Latin America, while mature markets focus on lightweighting and recycled content. In the United States, 2024 data from trade group NAPCOR showed a 30.2% bottle collection rate and 15.9% average recycled content, which shows how tight food-grade recycled supply remains against coming mandates. Buyers are beverage bottlers, regional water brands and edible oil and home care companies.
PET bottle manufacturing process
A two-stage plant separates preform making from bottle blowing, so each step can run at its own rate and preforms can be stored or shipped. Single-stage machines combine both steps and suit smaller runs of jars, pharmaceutical and cosmetic containers, but high-volume beverage formats normally use the two-stage route described here.
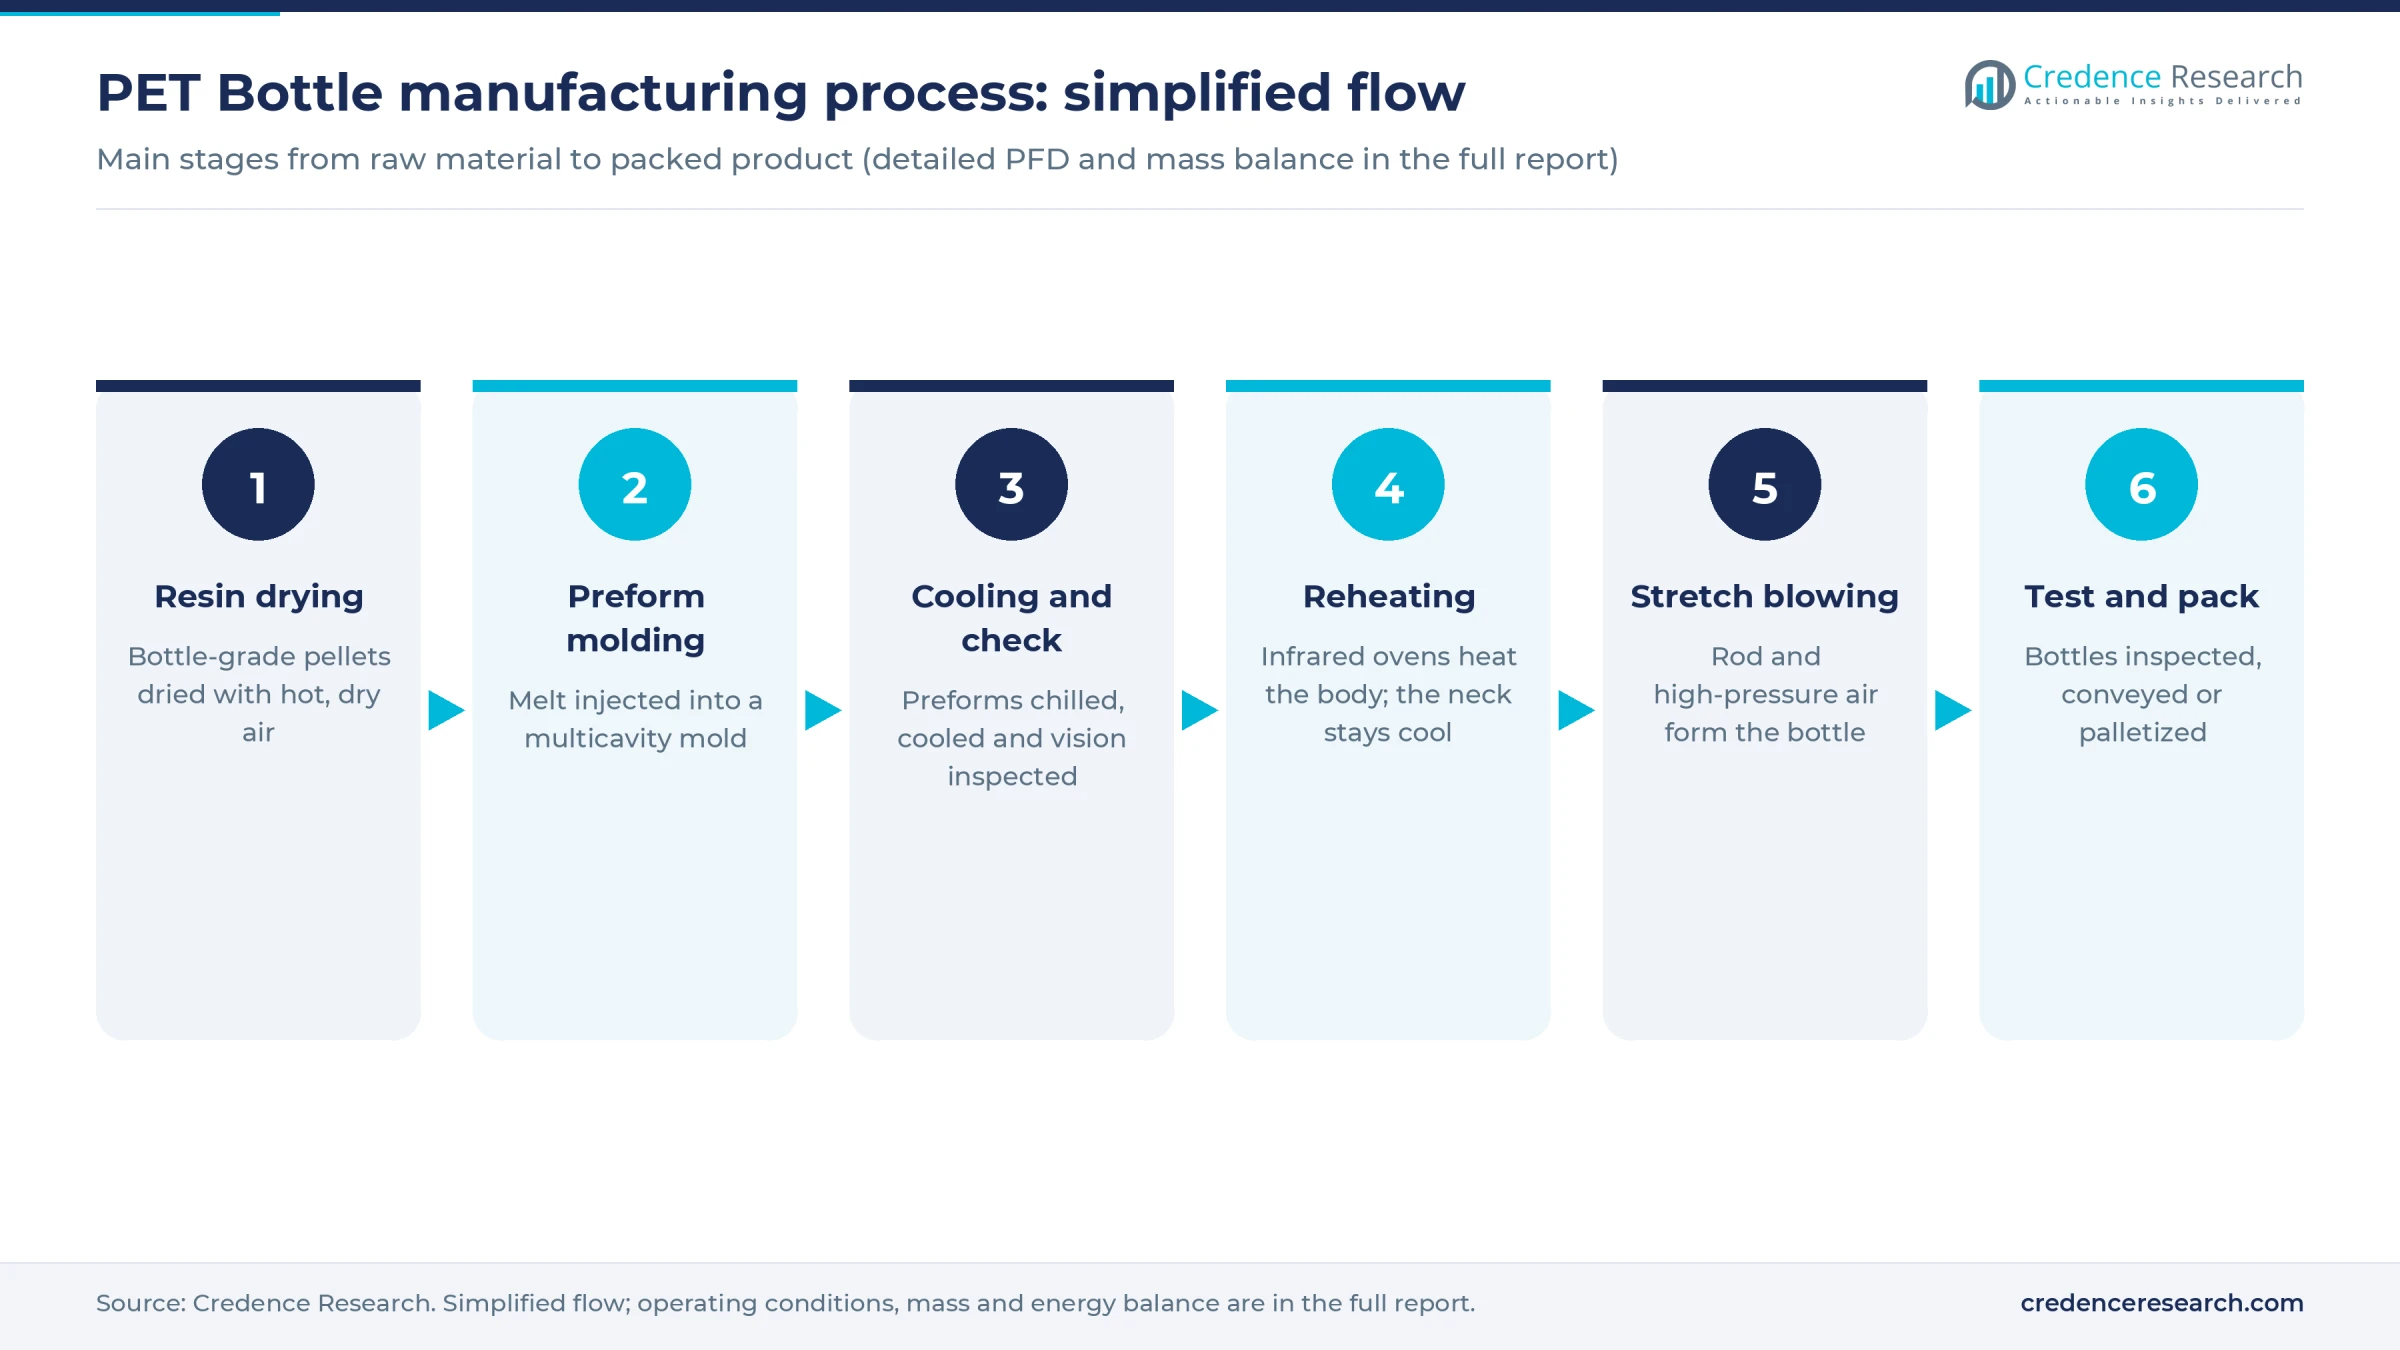
- Resin handling and drying. Bottle-grade pellets arrive in bulk or big bags and move to silos. PET absorbs moisture, and wet resin loses viscosity in the melt, so hot dry air brings pellets down to a very low moisture level over several hours before molding.
- Preform injection molding. A screw melts the dried resin at about 270–290 degrees Celsius and injects it into a multicavity mold through a hot runner. High-output beverage systems commonly run 96 cavities or more, with cycle times of a few seconds to about 10 seconds depending on wall thickness.
- Cooling and inspection. Chilled water sets the preform fast enough to keep it clear, because slow cooling crystallizes PET and turns it hazy. Robots transfer preforms to post-mold cooling, then cameras check for gate defects, haze and neck damage.
- Conditioning and reheating. Preforms are stored for a short time to reach stable temperature, then infrared ovens heat the body to about 95–115 degrees Celsius while the neck stays cool and keeps its exact dimensions.
- Stretch blow molding. A rod stretches the hot preform along its length while low-pressure and then high-pressure air, up to about 40 bar, expands it against a chilled mold. This biaxial stretching gives PET its strength and gas barrier.
- Testing and packing. Vision systems check base, wall and finish, while the lab samples burst pressure, top load and wall distribution. Bottles go to air conveyors at an in-plant filler or to pallets in hygienic bags.
Clean in-plant regrind is often reused within limits set by the food-contact rules and the customer's specification; contaminated scrap goes to non-food uses. Compressed air is the largest energy load in blowing, so air recovery and lighter preform designs decide unit cost almost as much as machine speed.
PET bottle plant setup cost
The reference plant is a two-stage greenfield unit rated at about 200 million 500 ml-equivalent bottles a year, at a blended 22 grams. That output needs about 31,000 bottles an hour over 6,500 effective hours, which fits one high-cavitation preform system and one or two rotary blowers. Total CapEx is estimated at USD 8–16 million, including land, building, utilities, preoperative costs and a working capital margin.
The range is scaled from disclosed investments. APPE's Gresford plant in the United Kingdom spent GBP 10 million, about USD 16.5 million at the time, around 2014 on five preform systems and ancillaries for 1.5 billion units a year. Petainer budgeted USD 10 million in December 2024 for its Tennessee expansion in large-format bottles and preforms. Plastipak's USD 53.8 million Pineville expansion allows up to five added lines, about USD 11 million a line including a 200,000-square-foot building. Manjushree's multiproduct greenfield plant on 20 acres in India was announced at about USD 18 million in 2023. U.S. and EU sites sit toward the top of the range because construction and installation cost more.
For the land row, the plant needs about 10,000 square meters for the building, silos, pallet storage and trucks. At an assumed USD 20–120 per square meter, land costs USD 200,000 to USD 1.2 million, close to 6% of CapEx at the midpoint; Asian parks sit low and U.S. or EU sites high.
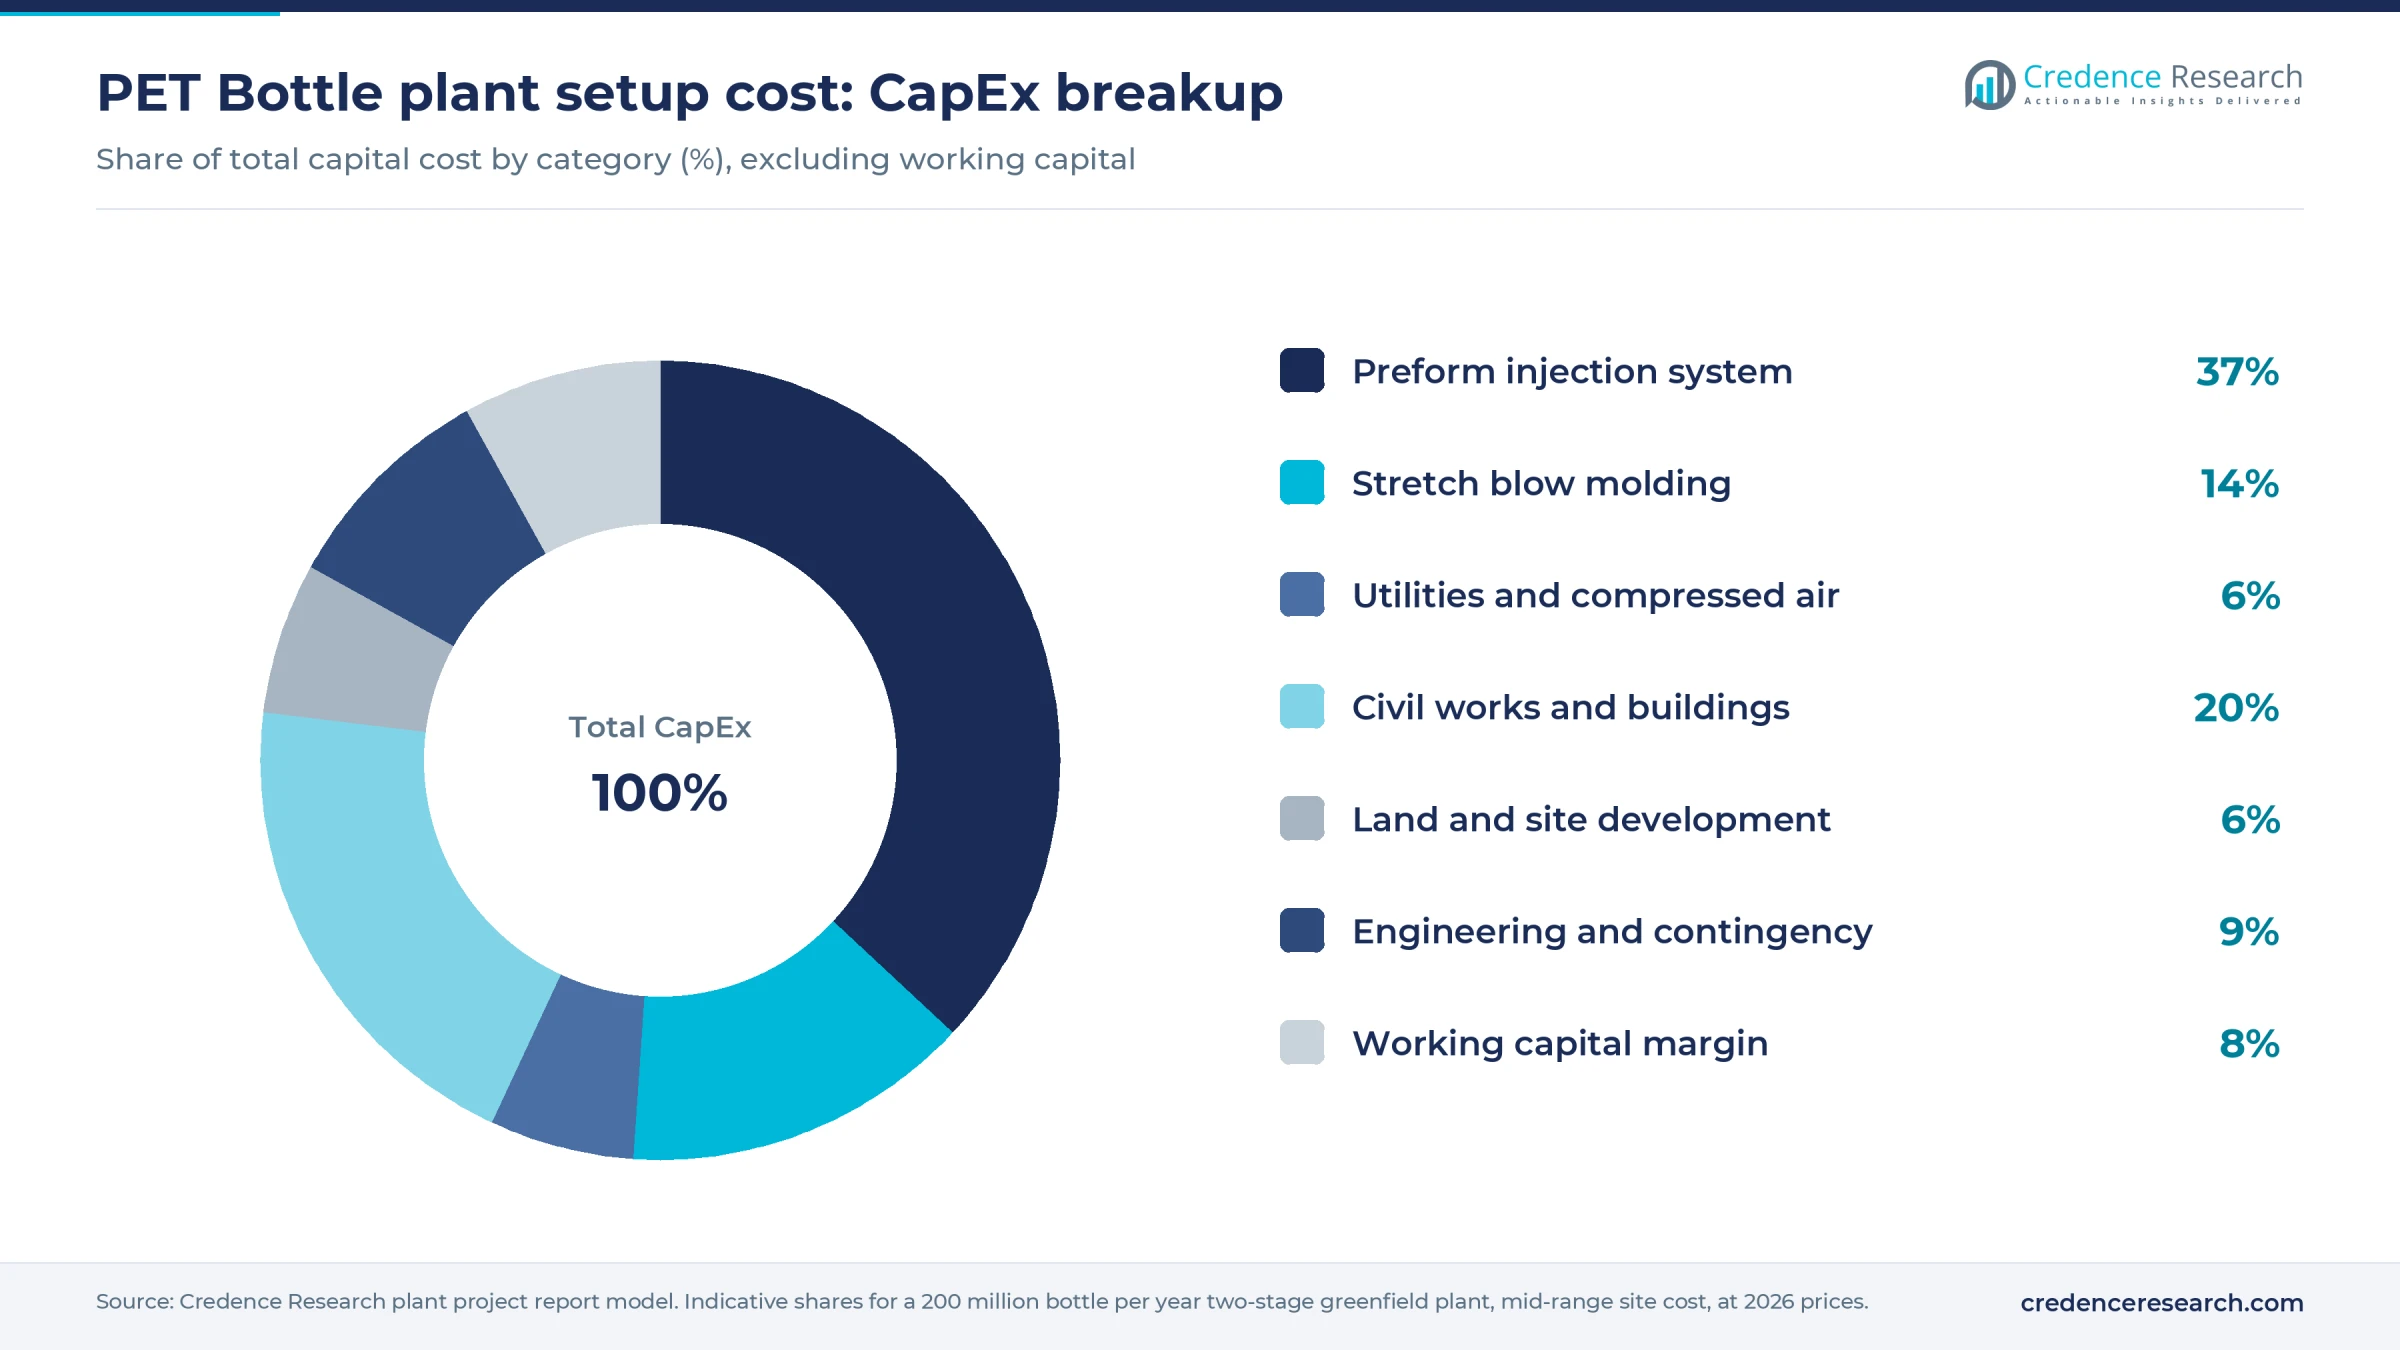
Plant and machinery, including utilities, make up about 57% of CapEx, and much of it is imported in most countries, so currency moves at the order stage matter. Operating cost is a different story: resin makes up about 68% of running cost, followed by power, packaging and freight.
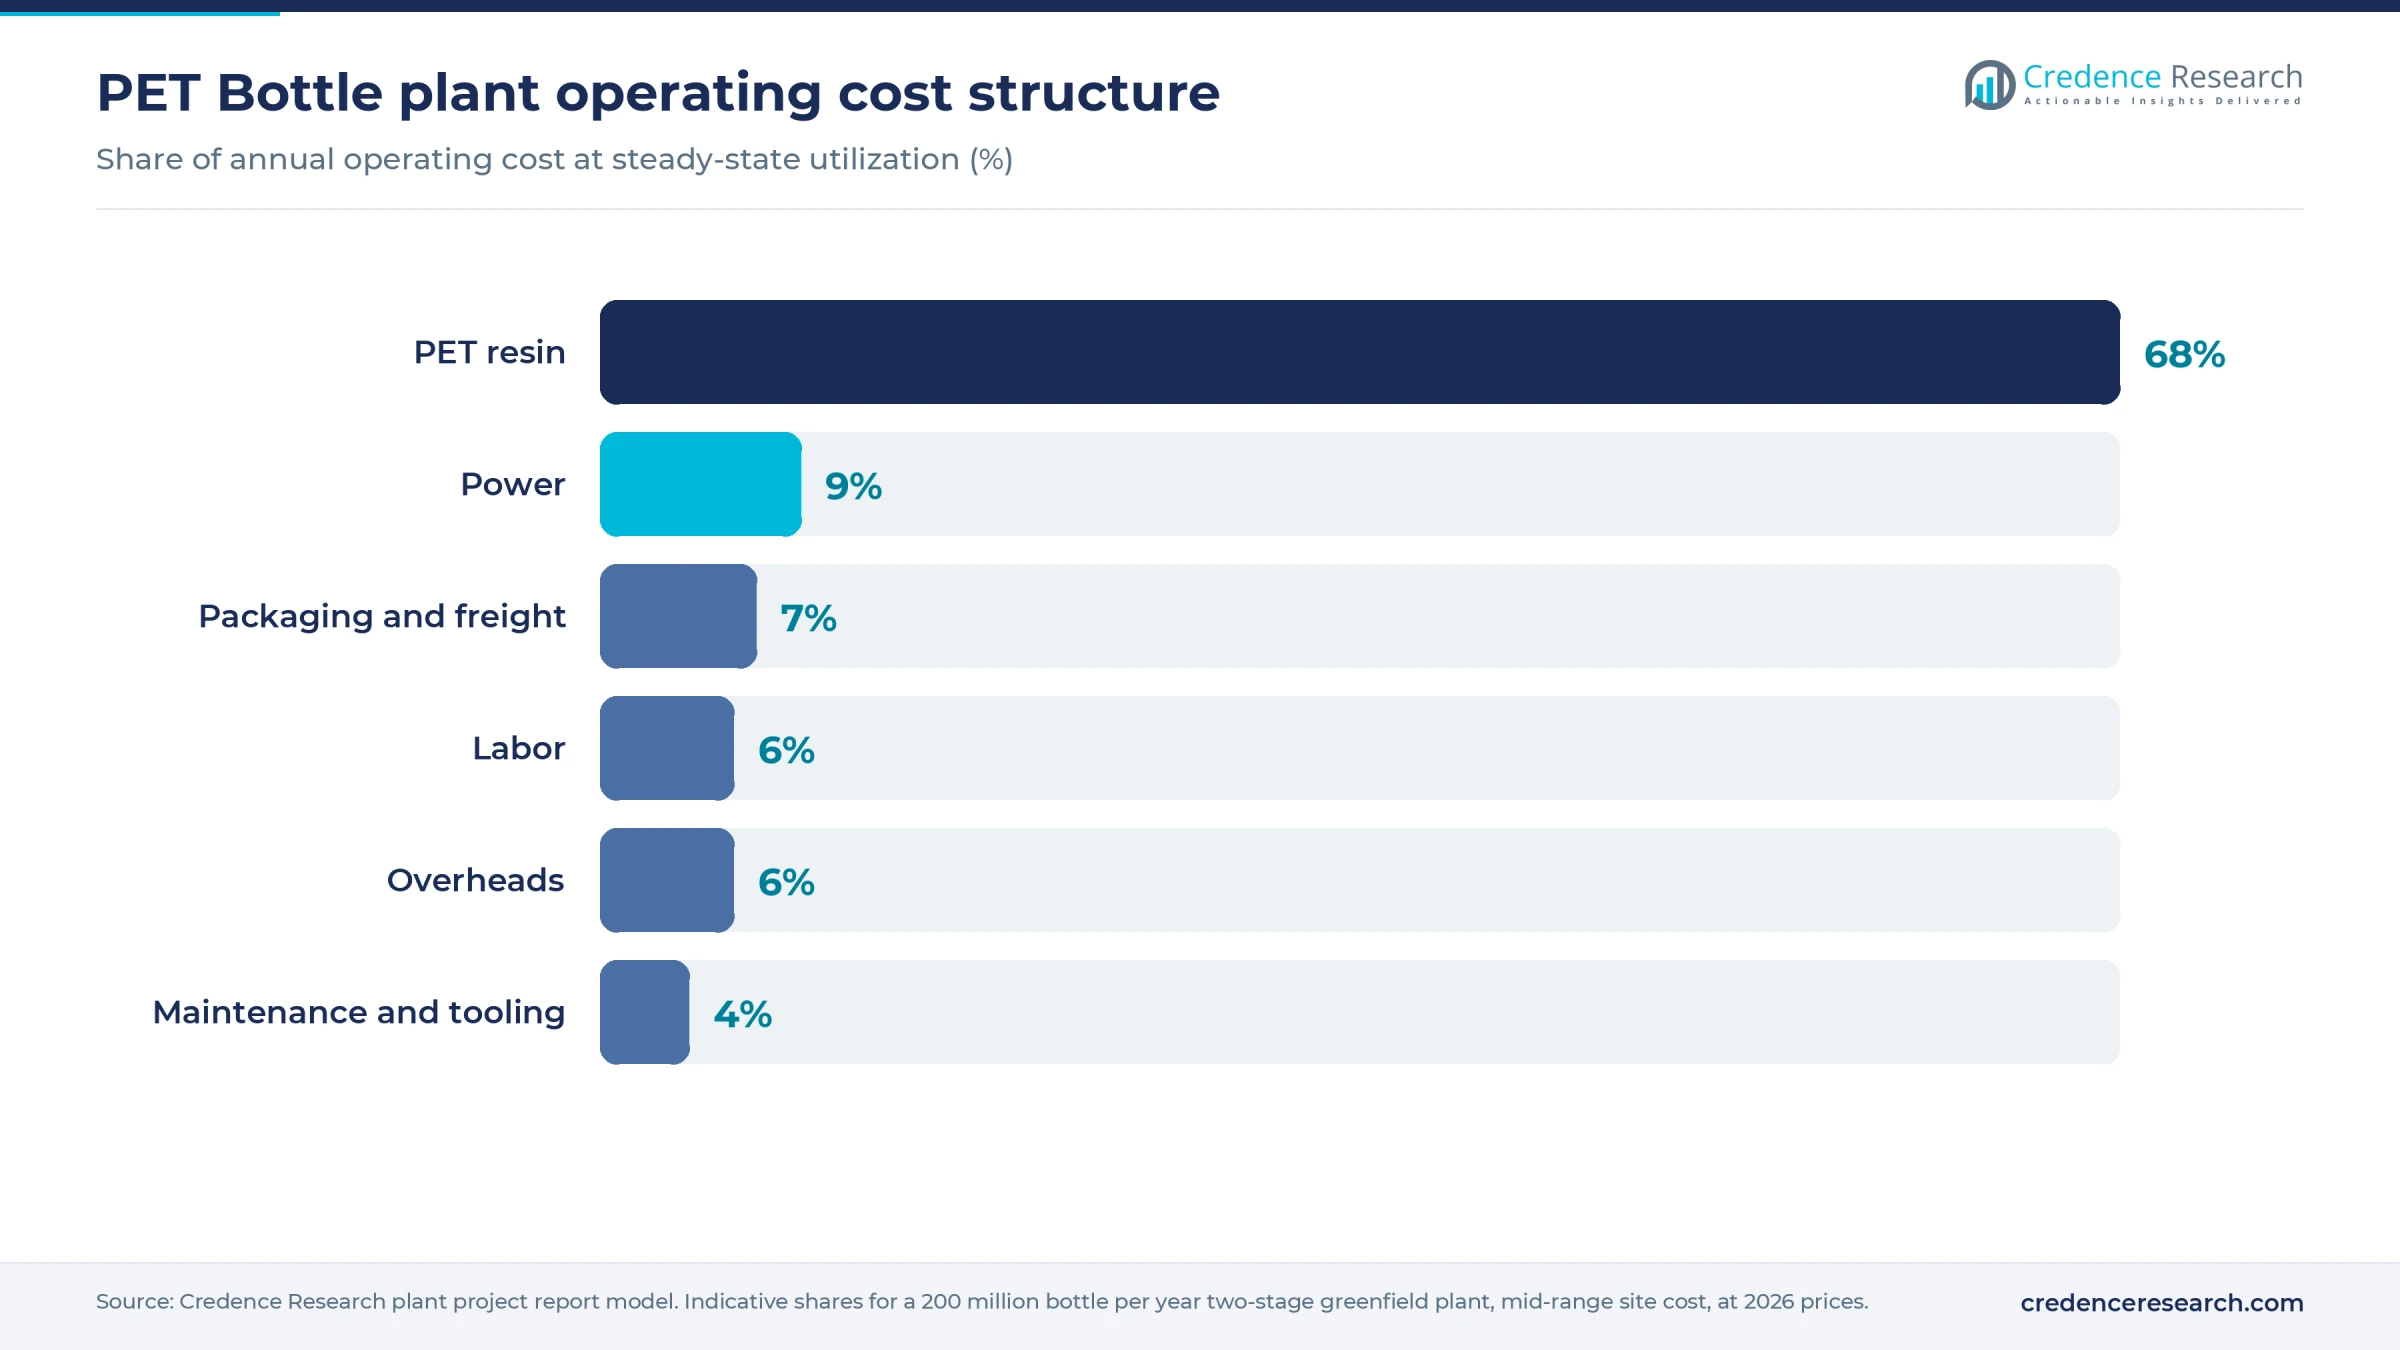
Resin is usually priced off a published index, so converters earn on conversion efficiency, bottle weight and uptime rather than on resin. The full report can be customized to any country or region.
Machinery and raw materials for a PET bottle plant
The main equipment groups are listed below; makes, outputs and the full equipment schedule are in the report.
- Resin silos, conveying system and desiccant dryers
- Preform injection molding system with multicavity mold and hot runner
- Post-mold cooling, preform vision inspection and storage bins
- Rotary stretch blow molders with bottle molds for each format
- High-pressure air compressors with air recovery, plus low-pressure compressors
- Water chillers and cooling towers
- Leak and vision testers, air conveyors, palletizers and bagging
- Quality lab for burst, top-load, wall-thickness and intrinsic viscosity testing
Bottle-grade resin is a global commodity. China is by far the largest exporter, and Thailand, India, Turkey, Oman, Egypt, South Korea, Lithuania and the Netherlands also ship significant volumes. Comtrade export unit values for 2025 ranged from about USD 0.79 per kg from China to USD 1.64 per kg from Germany, which shows how much logistics and origin rules matter to delivered cost. Anti-dumping duties can close the cheapest origin in some markets, so a new plant should price resin on a landed basis.
Food-grade recycled resin comes from bottle-to-bottle recyclers in Europe, North America, India and Southeast Asia. It costs more where mandates tighten supply and needs the right approval for food contact. At about 3,800 metric tons of resin a year, the reference plant is small enough to buy from traders, but it gains from a regional supply contract and dry storage to ride out shipping delays.
PET bottle business profit margin and ROI
Gross margin for the reference plant is estimated at 18–30%, measured as selling price minus resin and direct conversion cost. The build uses an assumed ex-works price of USD 0.038–0.047 per 22-gram bottle, or USD 1.75–2.15 per kg. That sits under the lowest leading export unit value for HS 392330 in 2024, the Netherlands at USD 2.30 per kg, and above online preform list prices near USD 1.30–1.40 per kg in India, the difference being blowing and format costs. Resin at an assumed USD 0.90–1.15 per kg costs USD 0.020–0.026 per bottle, and direct conversion adds about USD 0.007–0.011.
At 85% utilization, about 170 million bottles a year, revenue is near USD 7.3 million and annual cash profit after overheads is about USD 1.0–1.9 million, which puts payback at about 6–12 years at mid-range CapEx of USD 12 million. A low-cost build with a contracted filler can approach four to five years, while a high-cost site on merchant prices can run past the range.
A USD 0.10 per kg resin move shifts cost by about USD 0.002 per bottle, or about USD 380,000 a year if it is not passed through, so contract terms matter more than spot timing. Utilization is the other lever, because most fixed costs stay when a filler changes supplier.
| Metric | Value |
|---|---|
| Gross margin | 18–30% |
| Payback period | 6–12 years |
| IRR (post-tax) | Available in report |
| NPV | Available in report |
| Return on investment | Available in report |
| DSCR | Available in report |
| Break-even utilization | Available in report |
How to start a PET bottle business, licenses and approvals
Approval steps are similar in most countries: company and tax registration, industrial land use and building permits, an environmental permit or consent for air emissions, wastewater and plastic waste, occupational safety and fire approvals, food-contact compliance for the resin and finished bottle, producer or packaging waste registration, and import registration for machinery and resin. Recycled content adds a separate layer, because the recycling process rather than the bottle itself is usually what regulators assess.
| Market | Key approvals for a PET bottle plant |
|---|---|
| United States | State air and local building permits, OSHA workplace rules; FDA food-contact conditions for PET in 21 CFR 177.1630, with an FDA no-objection letter commonly sought for a post-consumer recycling process |
| European Union | National environmental permit; food-contact Regulations (EC) 1935/2004 and (EU) 10/2011, recycled plastics Regulation (EU) 2022/1616; 25% recycled content for PET beverage bottles from 2025 under Directive (EU) 2019/904, and 30% from 2030 at the earliest under Regulation (EU) 2025/40 |
| India | Consent to establish and operate from the state pollution control board; FSSAI packaging regulations and its May 2025 guidelines for food-contact recycled PET; extended producer responsibility registration under the Plastic Waste Management Rules |
Beverage customers also audit suppliers against packaging hygiene standards before approving a plant, and that audit often takes longer than the permits do.
Key PET bottle manufacturers and recent developments
Global converters include ALPLA, Amcor, Plastipak and Graham Packaging. Regional specialists include Retal and Resilux, with sites in Europe and the United States, Manjushree Technopack in India and Esterpet in the United Kingdom. Large bottlers also blow bottles in-house, which limits the merchant market in high-volume water and soft drink formats.
- November 2025: Plastipak announced a USD 53.8 million expansion in Pineville, Louisiana, with space for up to five production lines and upgrades for more recycled plastic, due by late 2026.
- September 2026: ALPLA opened plants in Izmir and Adana, Turkey, a combined investment of about EUR 30 million, including PET preforms and bottles.
- October 2026: Plastipak opened a PET Material Center in Verbania, Italy, a more than EUR 25 million site making a single-pellet resin with 30% recycled content.
Leaders compete on lightweight design, recycled-content supply and sites close to fillers, which leaves room for regional entrants with an anchor customer.
What's inside the PET Bottle project report PDF
The report runs to 21 chapters. Open a chapter to see its sections.
1. Preface
2. Scope and Methodology
- 2.1 Objectives of the Study
- 2.2 Stakeholders
- 2.3 Research Methodology
- 2.4 Data Sources and Key Assumptions
3. Executive Summary
- 3.1 Market Snapshot
- 3.2 Project at a Glance (Capacity, CapEx, OpEx)
- 3.3 Key Financial Indicators (IRR, NPV, Payback, Break-even)
- 3.4 Feasibility Verdict
4. Product Overview
- 4.1 PET Bottle Definition and Properties
- 4.2 Grades and Specifications (BIS / ISO / ASTM)
- 4.3 HS Code and Classification
- 4.4 Key Applications
- 4.5 Substitutes
5. Global PET Bottle Market
- 5.1 Market Overview
- 5.2 Historical and Current Market Performance (Volume and Value)
- 5.3 Market Breakup by Grade / Type
- 5.4 Market Breakup by End-Use Industry
- 5.5 Market Breakup by Region
- 5.6 Market Drivers, Restraints and Trends
- 5.7 Value Chain Analysis
- 5.8 Market Forecast
6. Target Country PET Bottle Market Analysis
- 6.1 Demand and Supply Analysis
- 6.2 Installed Capacity vs Demand Gap
- 6.3 Import Dependence
- 6.4 Demand Forecast by End-Use
7. Trade Analysis
- 7.1 Imports by Volume, Value and Country
- 7.2 Exports by Volume, Value and Country
- 7.3 Trade Balance and Opportunities
8. Price Analysis
- 8.1 Historical PET Bottle Price Trends by Region
- 8.2 Raw Material / Feedstock Price Trends and Linkage
- 8.3 Price Forecast
- 8.4 Margins Across the Value Chain
9. Competitive Landscape
- 9.1 Market Structure
- 9.2 Key Players and Installed Capacities
- 9.3 Profiles of Key Players
- 9.4 Recent Developments (Expansions, M&A, New Plants)
10. Manufacturing Process and Technology
- 10.1 Comparison of Technology Routes
- 10.2 Selected Route and Process Flow Diagram
- 10.3 Unit Operations Involved
- 10.4 Chemical Reactions Involved
- 10.5 Mass Balance and Raw Material Requirements
- 10.6 Energy Balance
- 10.7 Quality Assurance Criteria and Technical Tests
- 10.8 By-products and Waste Handling
- 10.9 Technology Licensors / Providers
11. Project Details, Requirements and Costs
- 11.1 Land, Location and Site Development
- 11.1.1 Site Selection Criteria
- 11.1.2 Location Analysis
- 11.1.3 Land Requirement and Costs
- 11.1.4 Site Development Costs
- 11.2 Plant Layout
- 11.2.1 Layout Principles
- 11.2.2 Proposed Layout
- 11.2.3 Factors Influencing Layout
- 11.3 Civil Works and Buildings
- 11.4 Plant Machinery
- 11.4.1 Machinery Requirements and Specifications
- 11.4.2 Machinery Costs
- 11.4.3 Machinery Suppliers
- 11.5 Raw Materials
- 11.5.1 Requirements per Tonne of Output
- 11.5.2 Procurement and Sourcing
- 11.5.3 Costs
- 11.5.4 Suppliers
- 11.6 Packaging
- 11.6.1 Packaging Requirements
- 11.6.2 Packaging Costs
- 11.6.3 Packaging Suppliers
- 11.7 Storage and Material Handling
- 11.8 Transportation Requirements and Costs
- 11.9 Utilities
- 11.9.1 Power Requirements and Costs
- 11.9.2 Water Requirements and Costs
- 11.9.3 Steam, Fuel and Other Utilities
- 11.10 Manpower Requirements and Wages
12. Environment, Health, Safety and Sustainability
- 12.1 Effluent and Emissions Management
- 12.2 Hazard Classification and Safety Measures
- 12.3 Carbon Footprint
- 12.4 Green / Low-Carbon Process Options
13. Regulatory Procedures, Approvals and Certifications
- 13.1 Licences and Registrations
- 13.2 Environmental Clearances
- 13.3 Product Certifications (BIS, REACH, etc.)
- 13.4 Approval Timeline
14. Project Implementation Schedule
15. Project Economics
- 15.1 Capital Cost of the Project
- 15.2 Techno-Economic Parameters
- 15.3 Capacity Utilization and Ramp-up
- 15.4 Product Pricing and Margins
- 15.5 Income Projections
- 15.6 Expenditure Projections
- 15.7 Working Capital Requirement
- 15.8 Taxation
- 15.9 Depreciation
16. Financial Analysis
- 16.1 Projected Profit and Loss Account
- 16.2 Projected Cash Flow Statement
- 16.3 Projected Balance Sheet
- 16.4 Liquidity Analysis
- 16.5 Profitability Analysis (Payback, NPV, IRR, ROI)
- 16.6 Break-even Analysis
- 16.7 Debt Service Coverage Ratio (DSCR)
- 16.8 Sensitivity Analysis
- 16.9 Scenario and Uncertainty Analysis
17. Funding and Incentives
- 17.1 Means of Finance and Debt-Equity Structure
- 17.2 Loans and Financial Assistance
- 17.3 Government Schemes and Subsidies (PLI, State Policies)
18. Risk Assessment
- 18.1 Key Success Factors
- 18.2 Key Risk Factors
- 18.3 Risk Mitigation
19. Strategic Recommendations
20. Case Study of a Successful Venture
21. Appendix
- 21.1 Detailed Assumptions
- 21.2 Abbreviations
- 21.3 List of Tables and Figures
- 21.4 Sources
This page vs. the full report
| Data point | On this page (free) | In the full report |
|---|---|---|
| Total CapEx | One rounded range at one capacity | Exact figure at three capacities with a line-item breakup |
| CapEx breakup | Category shares (%) only | Cost, quantity and supplier for every machine |
| Operating cost | Share of raw materials, utilities and labor | Per-unit cost sheet with each input price and consumption |
| Profitability | Gross margin range and payback band | Exact IRR, NPV, ROI, break-even and DSCR |
| Financial statements | List of what is included | 10-year P&L, cash flow, balance sheet and Excel model |
| Sensitivity | One directional line | Full sensitivity and scenario tables |
| Process | Simplified flow diagram | Detailed process flow, mass and energy balance, operating conditions |
| Machinery | Names of the main machines | Specifications, capacity, cost and supplier list |
| Market | Headline size, growth and India demand trend | Segment, region, trade and price forecast tables |
| Suppliers and buyers | Supplier types and sourcing hubs | Named suppliers and buyers |
PET Bottle project report: FAQs
How much does it cost to set up a PET bottle manufacturing plant?
What capacity is realistic for a new PET bottle plant?
What is the profit margin in PET bottle manufacturing?
Which approvals does a PET bottle plant need?
Where do PET bottle makers source resin?
What is the payback period for a PET bottle plant?
Who buys PET bottles and preforms?

About the analyst
Satyabrat Rajawat, Senior Research Analyst – Strategic Advisory
Satyabrat Rajawat is a Senior Research Analyst in the Strategic Advisory practice at Credence Research Inc. He works across domains, with the deepest coverage in packaging, automotive parts and machinery, and sits at the point where a client question becomes a research plan: he works with sales and business development teams to scope RFP and RFI responses, set the project methodology, and then build the quantitative databases and econometric forecasts that answer it.
Related market research
- PET Packaging Market Size, Share, Growth and Forecast 2032
- Recycled PET Bottles Market Size, Growth, Share and Forecast 2032
- Bottled Water Packaging Market Size, Share & Growth Report 2032
- Bottle Capping Machine Market Size, Share and Forecast 2032
- Juice Bottle Market Size, Share, Growth and Forecast 2032
- Pharmaceutical Plastic Bottles Market Size & Forecast 2032
More plant project reports
- Shrimp Processing Plant Project Report (DPR) 2026
- Instant Coffee Manufacturing Plant Project Report (DPR) 2026
- LED Light Manufacturing Plant Project Report (DPR) 2026
- Rare Earth Magnet Manufacturing Plant Project Report (DPR) 2026
- Pectin Manufacturing Plant Project Report (DPR) 2026
- Paper Cups Manufacturing Plant Project Report (DPR) 2026