
Quick answer
Medical oxygen is a regulated drug gas made mainly by cryogenic air separation and sold as bulk liquid or in cylinders. A greenfield plant producing 100 metric tons of liquid gases a day, with cylinder filling, needs an estimated USD 25–55 million of CapEx. Gross margin is about 44–59% before fixed costs, and simple payback is about 6–25 years, so long-term hospital and industrial contracts usually decide viability.
Viable where anchor hospital and industrial contracts fill the plant and power is affordable, but weak as a purely speculative merchant build because bulk prices are low and distance limits the sales radius.
Medical Oxygen plant: key highlights
| Parameter | Indicative value | Note |
|---|---|---|
| Plant capacity | 100 metric tons of liquid gases per day | 75 tons oxygen, 22 tons nitrogen, 3 tons argon, plus cylinder filling |
| Total CapEx | USD 25–55 million | Low end an Asian industrial park, top end a U.S., EU or Australian site |
| Raw material share of operating cost | Under 2% | Assumed: air is free; power, at about 22–54% of cost, plays the feedstock role |
| Gross margin | 44–59% | After power, distribution and cylinder handling, before fixed costs; prices partly assumed |
| Payback period | 6–25 years | 80% of capacity sold, simple pre-tax basis, region-matched CapEx; 8–12 years at base prices |
| IRR | Available in report | Post-tax, 10-year model |
| Break-even | Available in report | Capacity utilization basis |
Ranges assume 100 metric tons of liquid gases a day, 80% sold over 340 days, Asian to U.S., EU or Australian sites and 2026 prices. Bulk oxygen prices rest on a 2025 U.S. county contract of unstated grade and a 2024 Indian hospital study; other prices, power and fixed costs are assumed. CapEx is scaled from disclosed plants, with rupees at an assumed 73 (2021) and 83.5 (2024) per USD. Customizable to any country or region.
What is medical oxygen?
Medical oxygen is oxygen made, tested, labeled and distributed as a drug for treating patients. Hospitals use it for pneumonia, surgery and anesthesia, intensive care, newborn care and long-term therapy for chronic lung disease. Chemically it is the same molecule that steel mills buy, so the difference lies in documented quality and traceability rather than in the separation equipment.
Grades are set by pharmacopoeias. Oxygen USP calls for at least 99.0% and the European Pharmacopoeia monograph for at least 99.5%. One Indian hospital tender asks for at least 99.6% under the Indian Pharmacopoeia, with limits on carbon monoxide and carbon dioxide. A separate 93% grade, made by pressure swing adsorption, serves on-site hospital systems.
The product falls under Harmonized System subheading 2804.40, oxygen, which does not separate medical from industrial material. Forms of sale include bulk cryogenic liquid delivered to hospital tanks, high-pressure cylinders and small home-care containers. For transport, compressed oxygen is UN1072 and refrigerated liquid oxygen is UN1073.
Medical oxygen market overview and global demand
The global market is worth about USD 11.6 billion in 2025, based on Credence Research's global medical oxygen study of USD 10.79 billion for 2024 and a 7.67% CAGR, which points to USD 19.33 billion by 2032. It forms part of the broader medical gases category, which also covers nitrous oxide and medical air.
Clinical need is far larger than current supply in poorer countries. The Lancet Global Health Commission reported in 2025 that about 374 million people need medical oxygen each year, and 82% of them live in low- and middle-income countries. Acute medical and surgical care alone needs at least 1.2 billion normal cubic meters a year, or roughly 1.7 million metric tons. Only about 30% of people needing acute oxygen in those countries receive adequate therapy, and closing that gap would cost an estimated USD 6.8 billion a year.
Demand can also spike. COVID-19 added about 1.9 billion cubic meters in 2021, and India's government reported liquid medical oxygen output rising from about 5,700 metric tons a day in August 2020 to 9,690 tons by May 2021, partly by diverting industrial capacity.
Trade is thin because oxygen is costly to move. World exports under HS 2804.40 were about USD 215 million in 2023, led by France, Belgium, the Czech Republic, Germany and the Netherlands, a pattern consistent with short cross-border hauls. Germany and the Netherlands also rank among the leading importers. Supply is therefore regional, and a plant competes within a delivery radius rather than against world prices.
Buyers are hospitals and hospital groups, public health systems, home-care providers, cylinder distributors and, for the rest of the output, industrial users.
Medical oxygen manufacturing process
Two routes exist. Pressure swing adsorption passes air over zeolite to give about 93% oxygen, and it suits a hospital's own small unit. A commercial producer selling pharmacopoeial liquid and cylinder oxygen uses cryogenic air separation, which is the route assumed here. It also yields nitrogen and argon, which matter because a plant cannot sell medical oxygen alone at full load.
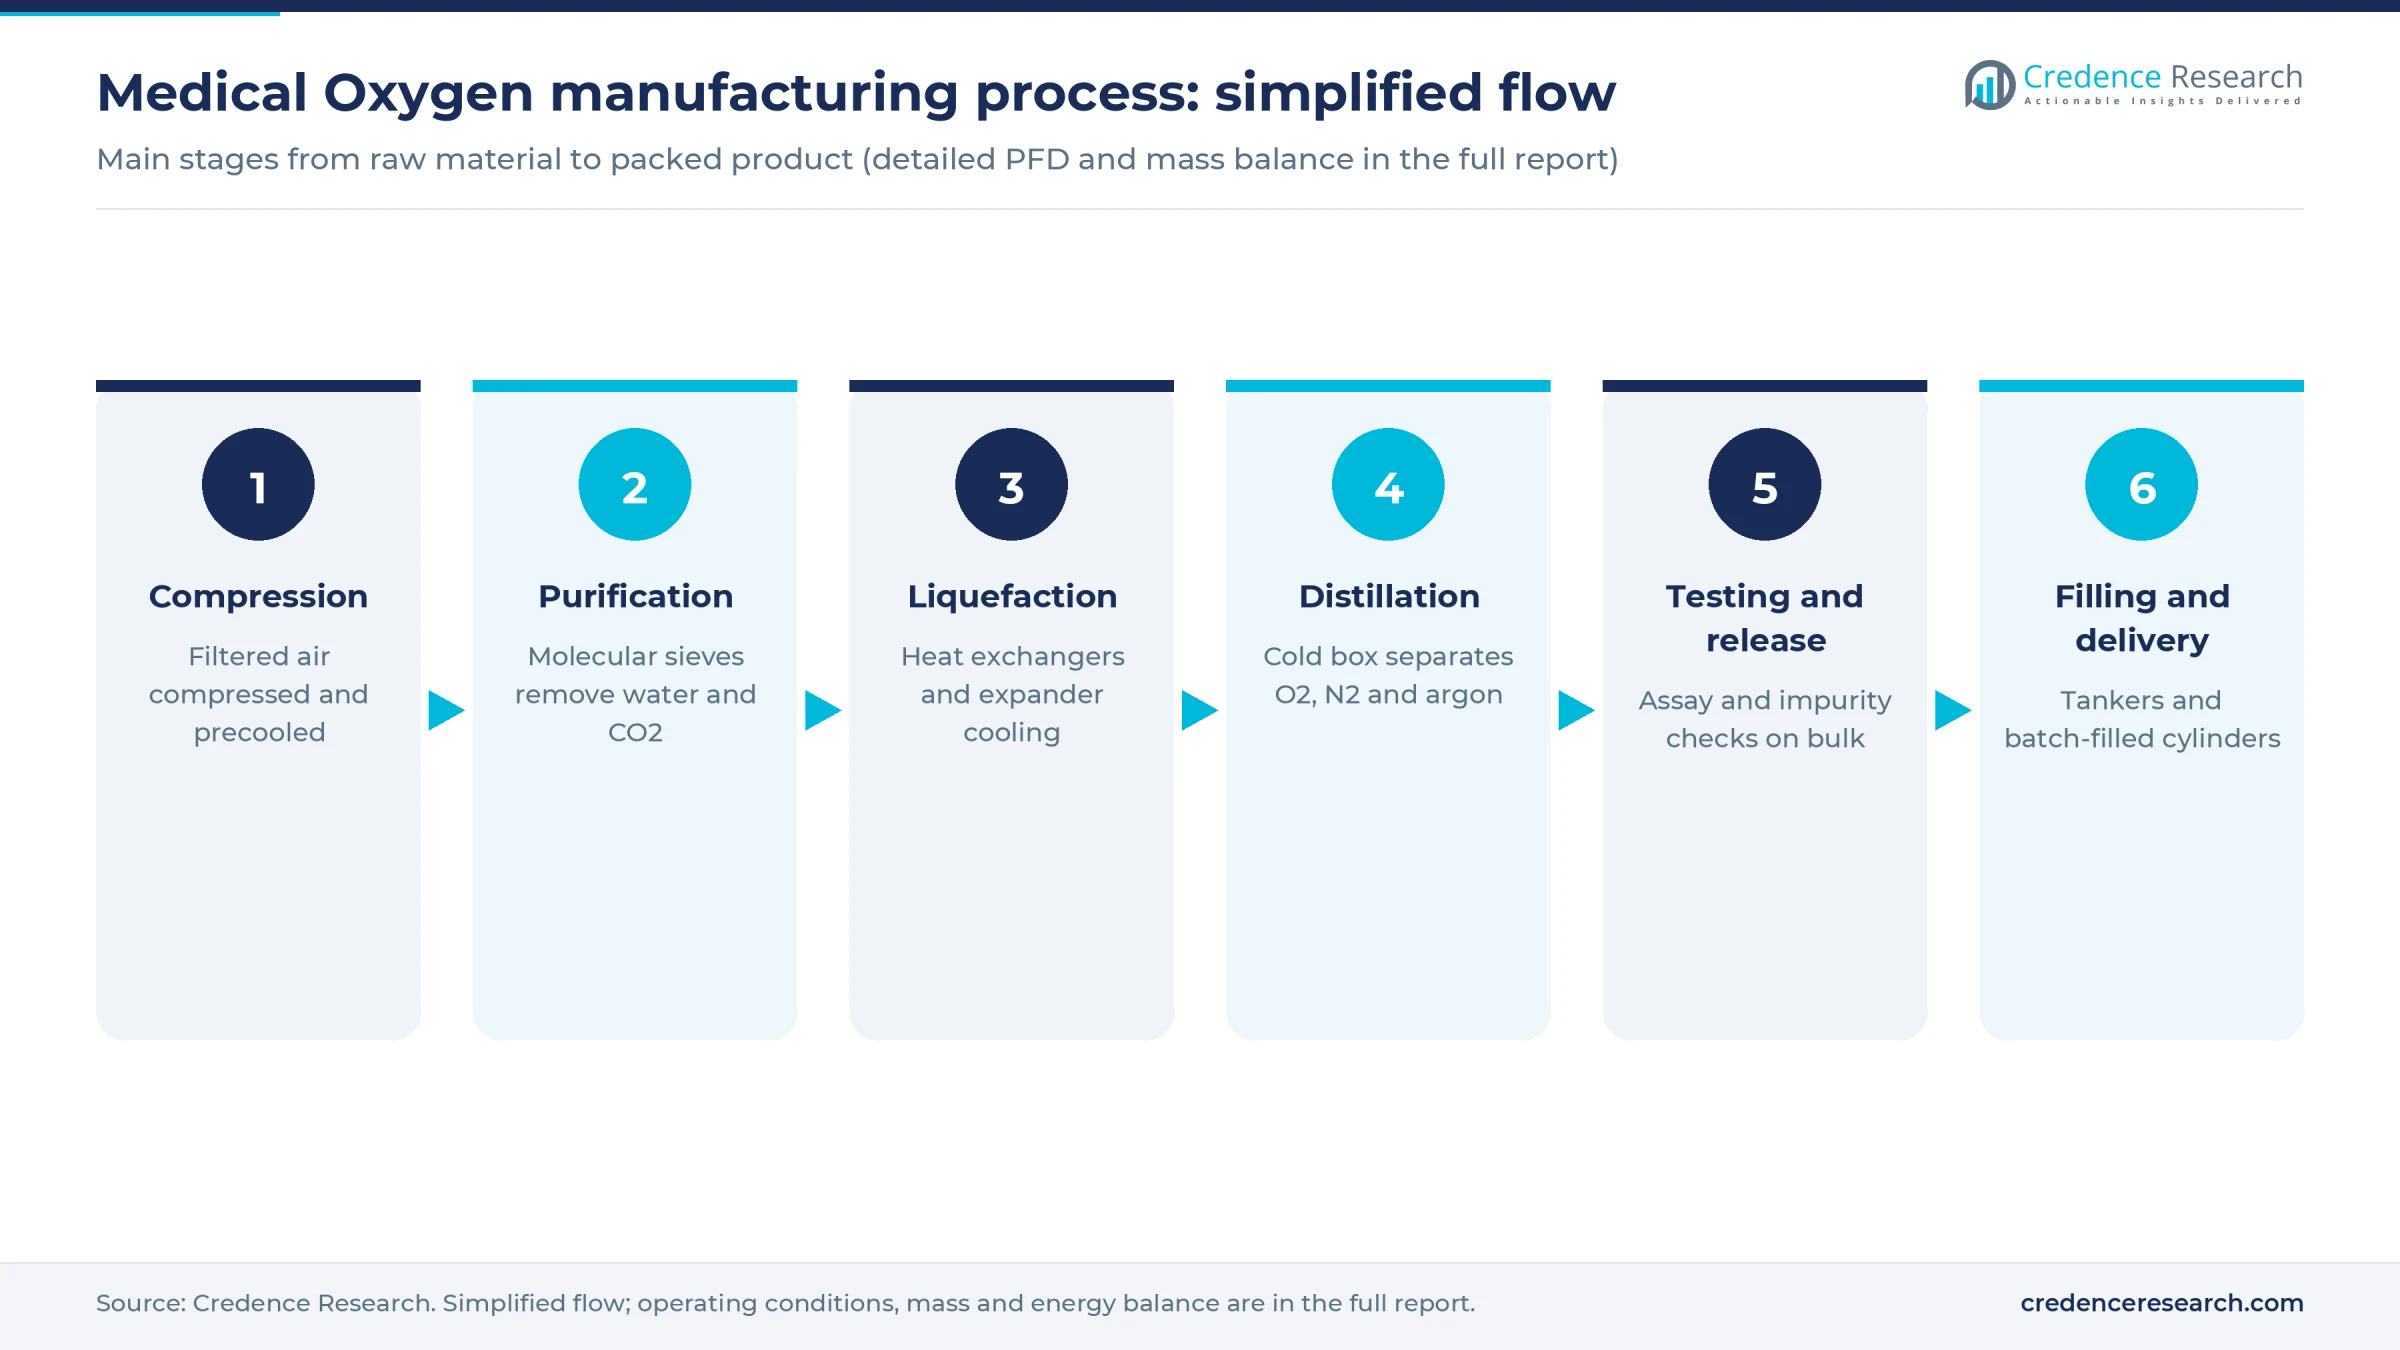
- Air compression and precooling. Filtered ambient air is compressed in stages and chilled to about 5–12 degrees Celsius. Site air quality checks matter because air is the starting material.
- Purification. Molecular sieve adsorbers strip out moisture, carbon dioxide and hydrocarbons, which would otherwise freeze in the cold box or concentrate dangerously in liquid oxygen.
- Cooling and liquefaction. A main heat exchanger and turbo-expander bring the air close to its liquefaction point. A nitrogen liquefier adds the refrigeration needed to draw product as liquid rather than gas, and that step drives the power bill.
- Distillation. Columns in the cold box separate components by boiling point. Oxygen collects as liquid, nitrogen goes overhead and a side column recovers argon.
- Testing and release. Bulk tanks dedicated to medical quality are sampled for assay and impurities such as carbon monoxide and carbon dioxide. Continuous analyzers feed trend records that regulators expect to see.
- Filling and distribution. Liquid goes by cryogenic tanker to hospital tanks. For cylinders, a pump and vaporizer feed a filling manifold, where each returned cylinder is inspected, evacuated or purged, filled, leak-tested, sealed and labeled by batch.
Cylinder handling causes more regulatory attention than distillation does. Returned containers can bring in contamination, and mix-ups between gases have caused patient harm, so rules focus on dedicated connections, residual pressure checks and batch records. Much of the medical compliance cost therefore sits at the filling station.
Medical oxygen plant setup cost
The reference plant produces 100 metric tons of liquid gases a day, split about 75 tons oxygen, 22 tons nitrogen and 3 tons argon, close to the mix at disclosed plants. It adds a filling station for about 800–1,000 cylinders a day. Total CapEx is estimated at USD 25–55 million, covering land, the separation unit, storage, filling, a tanker and cylinder pool, utilities, preoperative costs and working capital.
Three disclosed projects anchor the range. Air Liquide's plant at Kosi, India, cost about USD 42 million, converted from rupees at an assumed rate, for more than 365 tons a day. INOX Air Products announced about USD 274 million, also converted at an assumed rate, for eight units totaling more than 1,500 tons a day in 2021, or about USD 34 million each. Air Liquide's Sydney expansion was reported at USD 32.3 million for a unit processing 15,000 normal cubic meters of air an hour, roughly this plant's scale by estimate.
Scaled by the six-tenths rule, with assumed escalation, the Indian projects give about USD 21–30 million for the separation unit. The Sydney figure, with an assumed 1.1x greenfield factor, gives about USD 36 million. An assumed 15–20% for filling and fleets leads to USD 25–35 million in Asia. A high-cost site is USD 40–55 million, with the top end reflecting an assumed larger fleet and site premium.
For the land row, the plant needs about 40,000 square meters, an assumed figure well below the 18 acres in use at one U.S. project. At an assumed USD 15–60 per square meter, land costs USD 600,000 to USD 2.4 million, or about 4% of mid-range CapEx. U.S. and EU sites can exceed that range.
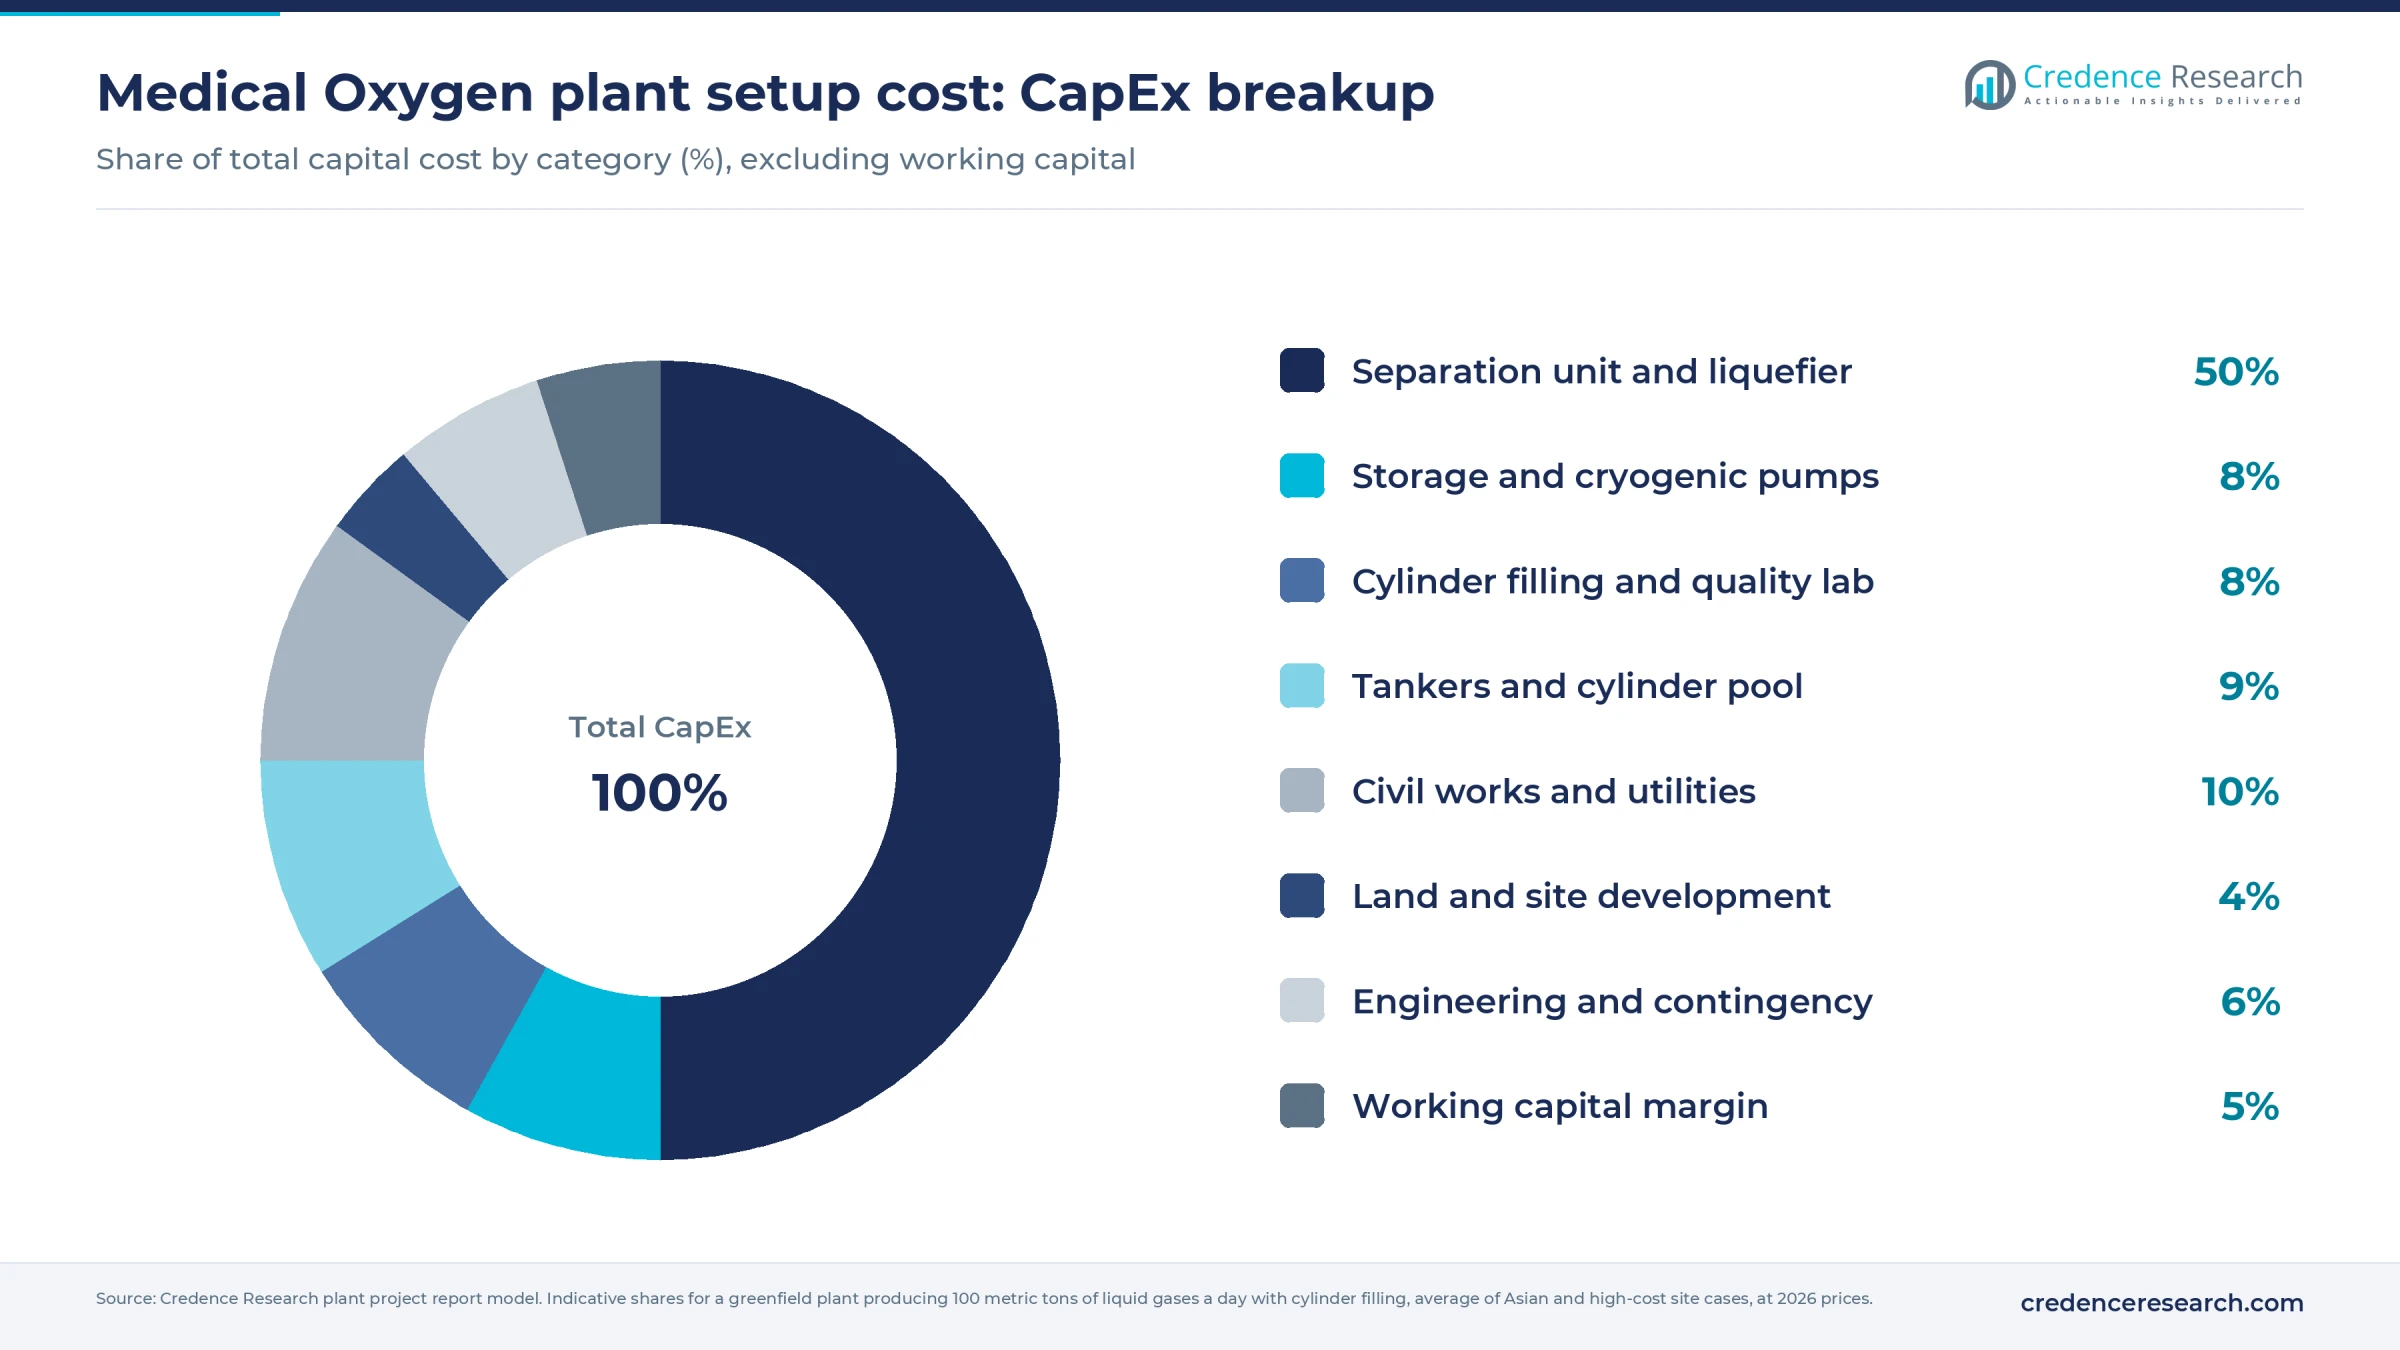
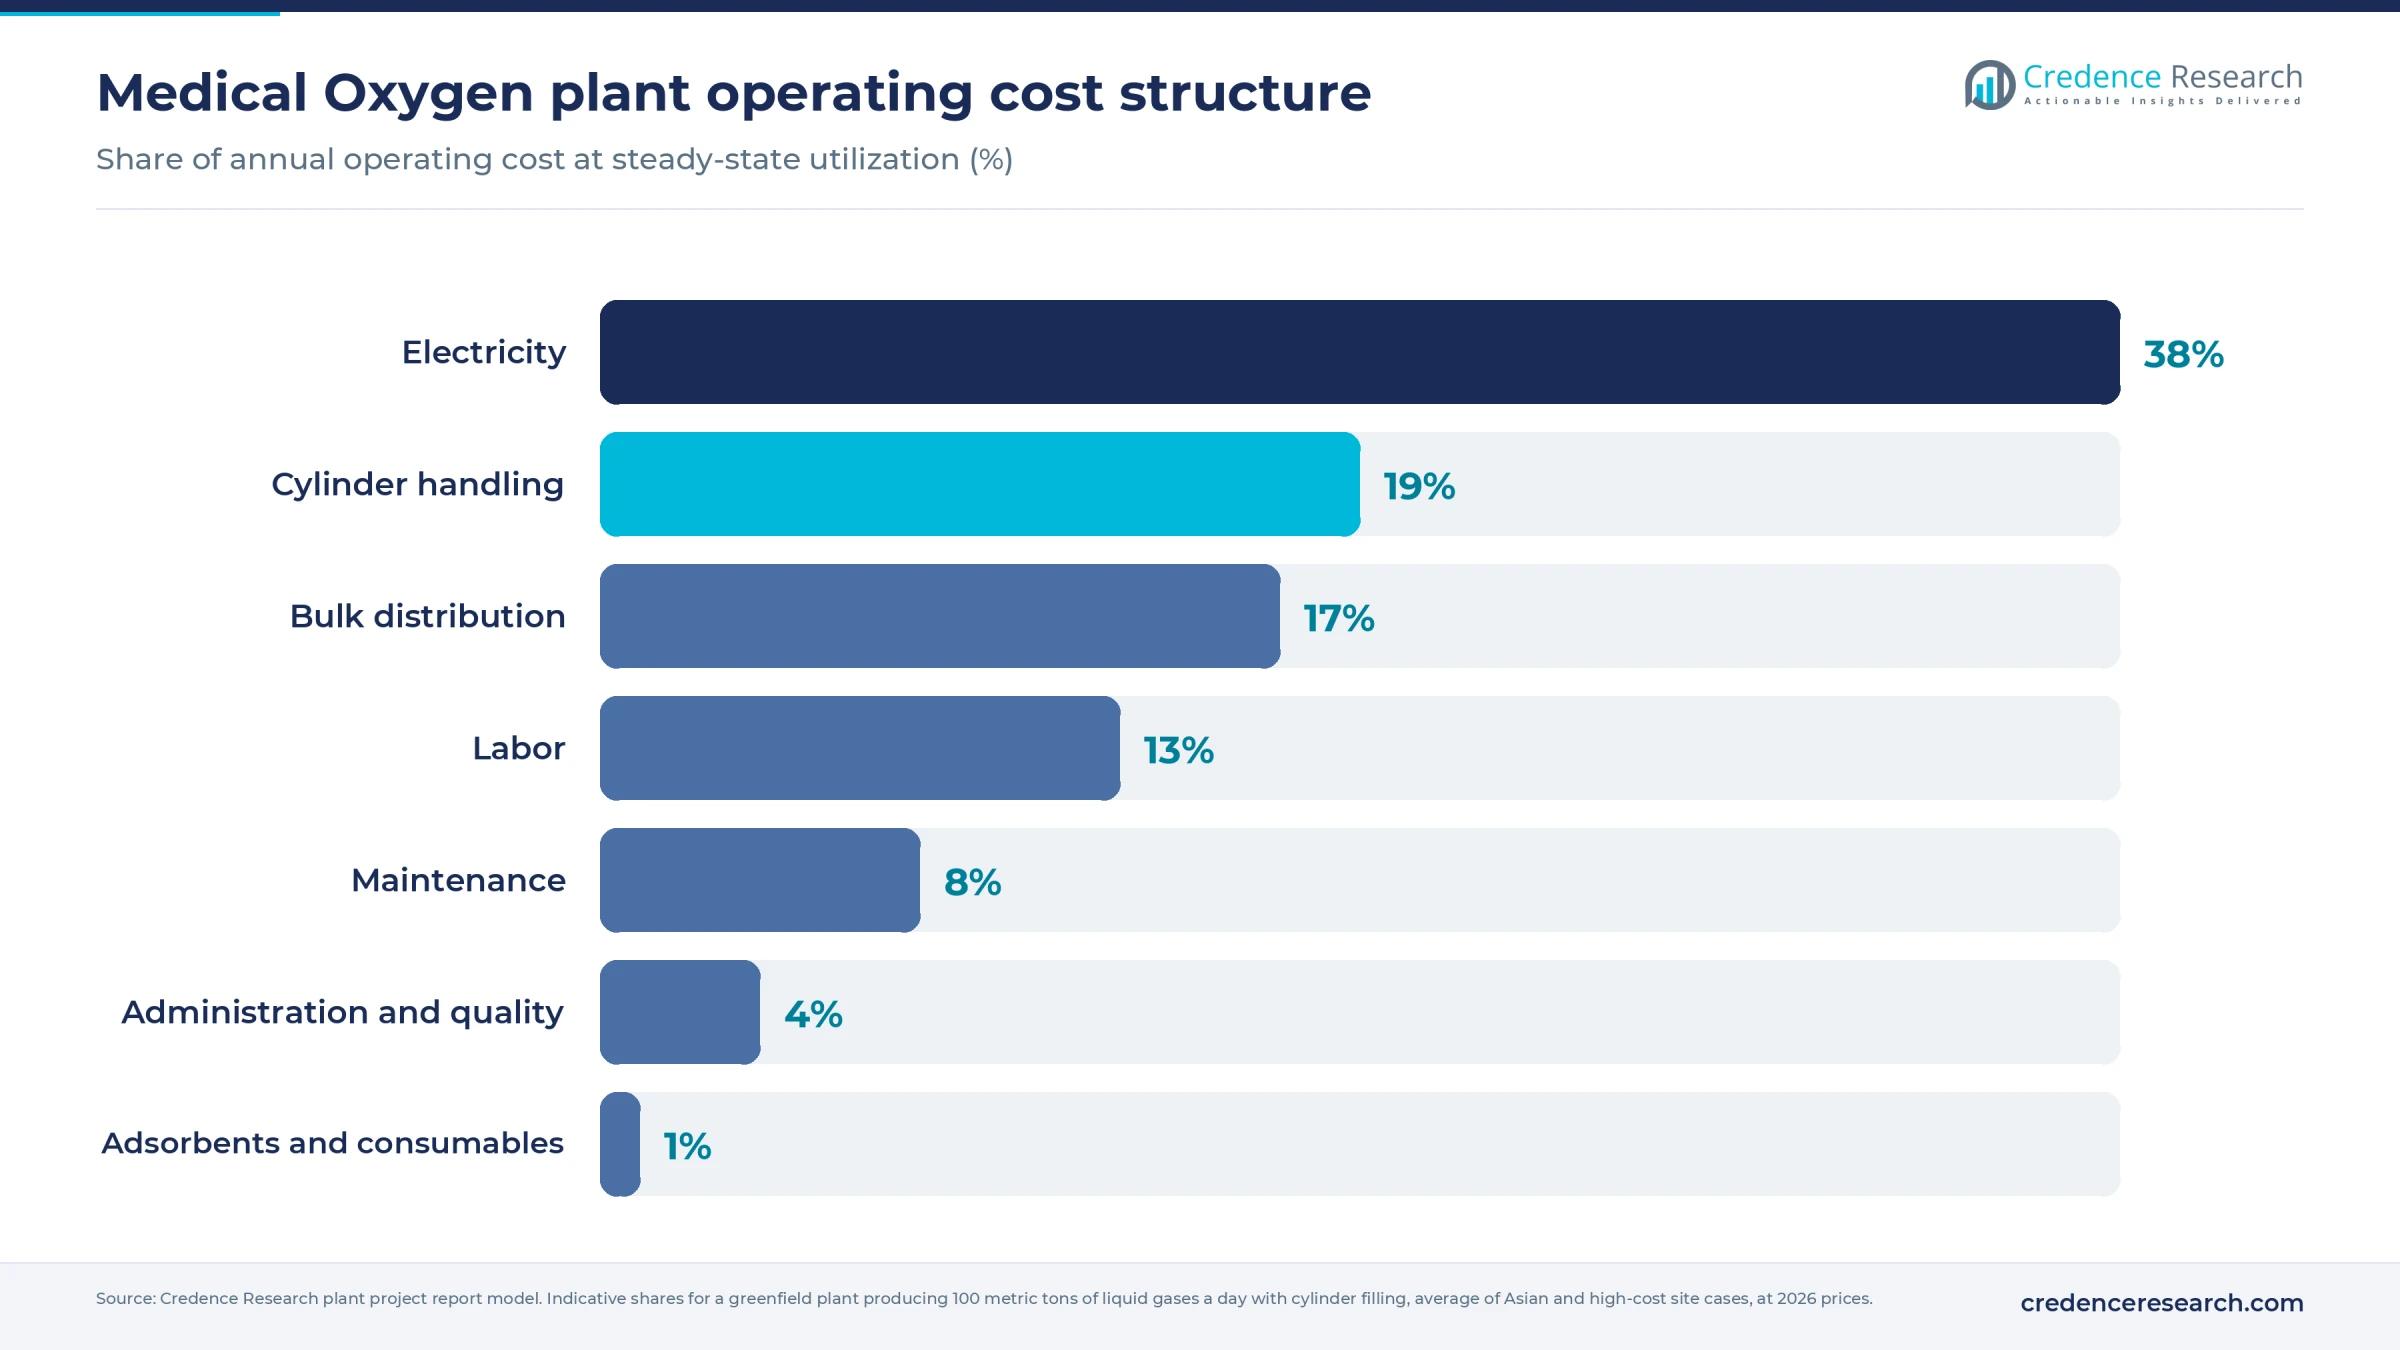
The separation unit dominates the investment. Operating cost then depends on the power contract and on how far the product travels.
The full report can be customized to any country or region.
Machinery and raw materials for a medical oxygen plant
Main equipment groups are listed below; ratings, makes and the full schedule are in the report.
- Air intake filters, main air compressor and precooling unit
- Molecular sieve adsorbers with regeneration heaters
- Cold box with heat exchangers, distillation columns and argon column
- Turbo-expanders and nitrogen liquefier
- Vacuum-insulated oxygen, nitrogen and argon storage tanks
- Cryogenic pumps, vaporizers and tanker loading bays
- Cylinder filling manifolds, vacuum pumps and leak-test stations
- Cryogenic road tankers, cylinders and customer tanks
- Control system, online analyzers and a quality lab with gas chromatography
The feedstock is air, which is free, so the "raw material" for this business is effectively electricity. Plant selection therefore starts with grid reliability and tariff. An outage can also stop deliveries to hospitals, so storage must be sized to cover outages. Consumables such as adsorbents and valves are small.
Purchased items are global. Large cryogenic air separation units come from engineering groups in Germany, France, the United States, Japan and China, with China the main source of lower-priced small units. High-pressure gas cylinders are made in China, India, Europe and the United States, and they need approval under the destination market's pressure-equipment rules. Cryogenic tanks and tankers are built in Asia, Europe and the United States.
Medical oxygen business profit margin and ROI
Gross margin is estimated at 44–59%, measured as revenue minus power, distribution and cylinder handling, before fixed costs. Fixed costs are heavy and revenue per ton is low relative to capital.
Public bulk price evidence is limited. A New York county environmental facilities contract for 2025–26 pays USD 208.98 per delivered ton of bulk liquid oxygen, about USD 230 per metric ton if that is a short ton, as its per-volume price implies. No medical grade is stated, so it serves as a floor. A 2024 Indian hospital study reported about USD 333 per metric ton delivered, converted at assumed rates. Cylinder oxygen, nitrogen and argon prices are assumed: about USD 2,500, 200 and 1,200 per ton in a high-cost market, and USD 500, 150 and 900 in Asia.
At 27,200 tons sold a year, revenue is about USD 8.9 million in the Asian case and USD 13 million in the high-cost case. Assumed fixed costs of USD 1 million and USD 3 million leave cash profit of about USD 3.6–3.9 million, so simple pre-tax payback is about 8–12 years on USD 30 million and USD 47 million of CapEx. A 15% price swing widens that to 6–25 years. Each 10% change in power price moves cash profit by about USD 200,000–290,000.
Substitution is the main risk. The same Indian study found bulk oxygen cost about 2.6 times a 500-liter-a-minute hospital adsorption unit running on grid power. Price caps can also apply, as India's 2020 ceilings showed.
| Metric | Value |
|---|---|
| Gross margin | 44–59% |
| Payback period | 6–25 years |
| IRR (post-tax) | Available in report |
| NPV | Available in report |
| Return on investment | Available in report |
| DSCR | Available in report |
| Break-even utilization | Available in report |
How to start a medical oxygen business, licenses and approvals
Approval steps follow a common path: company and tax registration, industrial zoning and building permits, an environmental permit or consent, occupational safety and fire clearances for oxygen-enriched areas and cryogenic storage, pressure-equipment approval for tanks and cylinders, and dangerous goods compliance for transport. The defining step is drug regulation, because medical oxygen is regulated as a medicine in major markets, so the plant needs a manufacturing authorization, a pharmacopoeial quality system and inspection readiness before its first sale.
| Market | Key approvals for a medical oxygen plant |
|---|---|
| United States | FDA designated medical gas certification under section 576 of the FD&C Act and 21 CFR Part 230; medical gas CGMP rules in 21 CFR Part 213, effective Dec. 18, 2025; establishment registration under Part 207; USP oxygen monograph; OSHA bulk oxygen rule 29 CFR 1910.104; DOT hazardous materials rules |
| European Union | National marketing authorization under Directive 2001/83/EC; manufacturing authorization with a Qualified Person; EU GMP Annex 6 for medicinal gases; European Pharmacopoeia monograph; Pressure Equipment Directive for fixed vessels; Transportable Pressure Equipment Directive 2010/35/EU for cylinders and tankers; Seveso III review of oxygen inventory; ADR transport rules |
| India | Drug manufacturing license from the State Licensing Authority under the Drugs and Cosmetics Act 1940; Indian Pharmacopoeia quality; PESO licensing under the Gas Cylinders Rules 2016 and pressure vessel rules; state pollution board consents; factory license; NPPA price rules where notified |
Timelines, documents and site-specific conditions vary, so early contact with the drug regulator is worthwhile.
Key medical oxygen manufacturers and recent developments
Global supply is concentrated in industrial gas groups, whose hospital contracts sit beside much larger industrial business. Linde, including BOC, Air Liquide, Air Products, Messer and Nippon Sanso Holdings are the main international names. Regional suppliers include INOX Air Products in India, SIAD in Italy and Air Water in Japan. Hospitals may also buy oxygen concentrators as a backup or substitute for delivered oxygen.
- May 2026: BOC, a Linde company, said it will build an air separation unit in Christchurch, New Zealand, producing up to 30 tons of liquid oxygen and nitrogen a day from 2027. It expects to eliminate up to 1,000 inter-island tanker shipments a year.
- June 2026: Air Liquide extended its Access Oxygen program to eight primary health centers in Madagascar serving about 215,000 people, using concentrators with solar power rather than delivered oxygen.
- October 2026: Air Liquide's planned new unit at Fairfield, Sydney, was reported as strengthening industrial and medical gas supply, with operations expected in 2028.
Together these moves show suppliers shortening delivery routes and, in remote settings, accepting on-site generation, which frames where a new plant can compete.
What's inside the Medical Oxygen project report PDF
The report runs to 21 chapters. Open a chapter to see its sections.
1. Preface
2. Scope and Methodology
- 2.1 Objectives of the Study
- 2.2 Stakeholders
- 2.3 Research Methodology
- 2.4 Data Sources and Key Assumptions
3. Executive Summary
- 3.1 Market Snapshot
- 3.2 Project at a Glance (Capacity, CapEx, OpEx)
- 3.3 Key Financial Indicators (IRR, NPV, Payback, Break-even)
- 3.4 Feasibility Verdict
4. Product Overview
- 4.1 Medical Oxygen Definition and Properties
- 4.2 Grades and Specifications (BIS / ISO / ASTM)
- 4.3 HS Code and Classification
- 4.4 Key Applications
- 4.5 Substitutes
5. Global Medical Oxygen Market
- 5.1 Market Overview
- 5.2 Historical and Current Market Performance (Volume and Value)
- 5.3 Market Breakup by Grade / Type
- 5.4 Market Breakup by End-Use Industry
- 5.5 Market Breakup by Region
- 5.6 Market Drivers, Restraints and Trends
- 5.7 Value Chain Analysis
- 5.8 Market Forecast
6. Target Country Medical Oxygen Market Analysis
- 6.1 Demand and Supply Analysis
- 6.2 Installed Capacity vs Demand Gap
- 6.3 Import Dependence
- 6.4 Demand Forecast by End-Use
7. Trade Analysis
- 7.1 Imports by Volume, Value and Country
- 7.2 Exports by Volume, Value and Country
- 7.3 Trade Balance and Opportunities
8. Price Analysis
- 8.1 Historical Medical Oxygen Price Trends by Region
- 8.2 Raw Material / Feedstock Price Trends and Linkage
- 8.3 Price Forecast
- 8.4 Margins Across the Value Chain
9. Competitive Landscape
- 9.1 Market Structure
- 9.2 Key Players and Installed Capacities
- 9.3 Profiles of Key Players
- 9.4 Recent Developments (Expansions, M&A, New Plants)
10. Manufacturing Process and Technology
- 10.1 Comparison of Technology Routes
- 10.2 Selected Route and Process Flow Diagram
- 10.3 Unit Operations Involved
- 10.4 Chemical Reactions Involved
- 10.5 Mass Balance and Raw Material Requirements
- 10.6 Energy Balance
- 10.7 Quality Assurance Criteria and Technical Tests
- 10.8 By-products and Waste Handling
- 10.9 Technology Licensors / Providers
11. Project Details, Requirements and Costs
- 11.1 Land, Location and Site Development
- 11.1.1 Site Selection Criteria
- 11.1.2 Location Analysis
- 11.1.3 Land Requirement and Costs
- 11.1.4 Site Development Costs
- 11.2 Plant Layout
- 11.2.1 Layout Principles
- 11.2.2 Proposed Layout
- 11.2.3 Factors Influencing Layout
- 11.3 Civil Works and Buildings
- 11.4 Plant Machinery
- 11.4.1 Machinery Requirements and Specifications
- 11.4.2 Machinery Costs
- 11.4.3 Machinery Suppliers
- 11.5 Raw Materials
- 11.5.1 Requirements per Tonne of Output
- 11.5.2 Procurement and Sourcing
- 11.5.3 Costs
- 11.5.4 Suppliers
- 11.6 Packaging
- 11.6.1 Packaging Requirements
- 11.6.2 Packaging Costs
- 11.6.3 Packaging Suppliers
- 11.7 Storage and Material Handling
- 11.8 Transportation Requirements and Costs
- 11.9 Utilities
- 11.9.1 Power Requirements and Costs
- 11.9.2 Water Requirements and Costs
- 11.9.3 Steam, Fuel and Other Utilities
- 11.10 Manpower Requirements and Wages
12. Environment, Health, Safety and Sustainability
- 12.1 Effluent and Emissions Management
- 12.2 Hazard Classification and Safety Measures
- 12.3 Carbon Footprint
- 12.4 Green / Low-Carbon Process Options
13. Regulatory Procedures, Approvals and Certifications
- 13.1 Licences and Registrations
- 13.2 Environmental Clearances
- 13.3 Product Certifications (BIS, REACH, etc.)
- 13.4 Approval Timeline
14. Project Implementation Schedule
15. Project Economics
- 15.1 Capital Cost of the Project
- 15.2 Techno-Economic Parameters
- 15.3 Capacity Utilization and Ramp-up
- 15.4 Product Pricing and Margins
- 15.5 Income Projections
- 15.6 Expenditure Projections
- 15.7 Working Capital Requirement
- 15.8 Taxation
- 15.9 Depreciation
16. Financial Analysis
- 16.1 Projected Profit and Loss Account
- 16.2 Projected Cash Flow Statement
- 16.3 Projected Balance Sheet
- 16.4 Liquidity Analysis
- 16.5 Profitability Analysis (Payback, NPV, IRR, ROI)
- 16.6 Break-even Analysis
- 16.7 Debt Service Coverage Ratio (DSCR)
- 16.8 Sensitivity Analysis
- 16.9 Scenario and Uncertainty Analysis
17. Funding and Incentives
- 17.1 Means of Finance and Debt-Equity Structure
- 17.2 Loans and Financial Assistance
- 17.3 Government Schemes and Subsidies (PLI, State Policies)
18. Risk Assessment
- 18.1 Key Success Factors
- 18.2 Key Risk Factors
- 18.3 Risk Mitigation
19. Strategic Recommendations
20. Case Study of a Successful Venture
21. Appendix
- 21.1 Detailed Assumptions
- 21.2 Abbreviations
- 21.3 List of Tables and Figures
- 21.4 Sources
This page vs. the full report
| Data point | On this page (free) | In the full report |
|---|---|---|
| Total CapEx | One rounded range at one capacity | Exact figure at three capacities with a line-item breakup |
| CapEx breakup | Category shares (%) only | Cost, quantity and supplier for every machine |
| Operating cost | Share of raw materials, utilities and labor | Per-unit cost sheet with each input price and consumption |
| Profitability | Gross margin range and payback band | Exact IRR, NPV, ROI, break-even and DSCR |
| Financial statements | List of what is included | 10-year P&L, cash flow, balance sheet and Excel model |
| Sensitivity | One directional line | Full sensitivity and scenario tables |
| Process | Simplified flow diagram | Detailed process flow, mass and energy balance, operating conditions |
| Machinery | Names of the main machines | Specifications, capacity, cost and supplier list |
| Market | Headline size, growth and global demand | Segment, region, trade and price forecast tables |
| Suppliers and buyers | Supplier types and sourcing hubs | Named suppliers and buyers |
Medical Oxygen project report: FAQs
How much does it cost to set up a medical oxygen plant?
Is medical oxygen different from industrial oxygen?
Should a new medical oxygen plant use cryogenic or PSA technology?
What is the profit margin in medical oxygen manufacturing?
What is the payback period for a medical oxygen plant?
Which approvals does a medical oxygen plant need?
Who buys medical oxygen?

About the analyst
Dr. Pankaj Sharma, Healthcare Domain Expert & Medical Advisor
Dr. Pankaj Sharma is an anesthesiologist and healthcare strategic advisor who reviews epidemiological models, therapeutic market assessments and clinical assumptions at Credence Research Inc, so that quantitative forecasts reflect clinical realities.
Related market research
- Medical Oxygen Market Size, Trends, Share and Forecast 2032
- Medical Gases Market Size, Growth, Trend & Forecast, 2032
- Oxygen Concentrators Market Size, Share and Forecast 2032
- Cryogenic Air Separation Unit Market Size, Growth and Forecast 2032
- Gas Cylinders Market Size, Growth, Share and Forecast 2032
- Oxygen Therapy Equipment Market Size. Growth & Forecast 2032
More plant project reports
- Egg Tray Manufacturing Plant Project Report (DPR) 2026
- Recycled Copper Manufacturing Plant Project Report (DPR) 2026
- Condom Manufacturing Plant Project Report (DPR) 2026
- Engine Oil Manufacturing Plant Project Report (DPR) 2026
- Garlic Powder Manufacturing Plant Project Report (DPR) 2026
- Essential Oil Manufacturing Plant Project Report (DPR) 2026