
Quick answer
A recycled copper plant melts, fire-refines and electrorefines scrap into cathode for rod, tube and sheet makers. A greenfield unit of about 20,000 metric tons a year needs an estimated USD 13–32 million of CapEx, before metal inventory. Scrap is about 98% of operating cost and tracks LME copper, so gross margin is thin at 0–4%, with a payback of about 3–8 years before metal financing.
Viable for operators with secured scrap supply, cheap metal credit and strong emission controls, but exposed when tight scrap markets squeeze discounts.
Recycled Copper plant: key highlights
| Parameter | Indicative value | Note |
|---|---|---|
| Plant capacity | About 20,000 metric tons per year | Cathode output from purchased scrap, using fire refining and electrorefining |
| Total CapEx | USD 13–32 million | Greenfield, Asian or emerging-market site; excludes metal inventory; U.S. and EU sites usually higher |
| Raw material share of operating cost | 97–98% | Scrap priced as a percentage of LME copper, including melt loss |
| Gross margin | 0–4% | Thin as a percentage because metal passes through near USD 14,400 per metric ton |
| Payback period | 3–8 years | At 85% utilization and mid-range CapEx, before tax and metal financing; no payback in the weakest case |
| IRR | Available in report | Post-tax, 10-year model |
| Break-even | Available in report | Capacity utilization basis |
Ranges assume a greenfield 20,000 metric ton a year scrap-to-cathode plant, an Asian or emerging-market industrial park (U.S./EU costs higher), 2026 prices, 85% utilization, LME copper at USD 14,441, and assumed scrap payables, cathode premium, melt loss, conversion cost and land rate. Rupees at an assumed 88, euros at an assumed 1.15 and dirhams at 3.6725 per USD. CapEx excludes metal inventory. Customizable to any country.
What is recycled copper?
Recycled copper is metal recovered from production offcuts and end-of-life goods such as cable, tube, motors and radiators, then melted and refined for reuse. Copper does not lose its properties when properly refined, so cathode made from scrap can meet the same grade as cathode made from mined ore. That is the core commercial point, because buyers pay on quality rather than origin, although some now pay extra for documented recycled content and lower carbon.
Output falls into three broad grades. Fire-refined copper suits rod and alloy uses where conductivity limits are less strict, anode goes on to an electrolytic tankhouse, and electrorefined cathode is the top grade, sold against LME Grade A specifications.
Under the Harmonized System, the reference plant's cathode falls under subheading 7403.11, while other refined unwrought shapes such as billets use neighboring subheadings in heading 7403. Its feedstock, copper waste and scrap, is classified under 7404.00. Applications run from wire rod and power cable to plumbing tube, strip, electronics, vehicles and building products.
Recycled copper market overview and global demand
Credence Research values the global copper and copper alloy scrap and recycling market at about USD 9.6 billion in 2025, based on its USD 8.89 billion estimate for 2024 and a 7.9% CAGR through 2032. It sits upstream of metal-heavy product markets such as the copper tube market.
Physical data give a sense of the scale. The International Copper Study Group reported slightly under 1.93 million metric tons of secondary refined output in January to May 2024, or 16.7% of global refined copper. That counts only scrap that passes through a refinery. Clean scrap melted directly by fabricators sits outside the figure, so total recycled supply is higher. In October 2026 the group forecast refined usage growth of 1.5% in 2026 and 2.5% in 2027, with secondary refined output up about 4.7% in 2027 and surpluses of 104,000 and 368,000 metric tons.
TrendEconomy trade statistics put 2023 world scrap imports under HS 7404 at over USD 31 billion. China took about 45%, or USD 14.4 billion, ahead of Germany, India, Belgium and Japan. The United States led exporters at USD 4.59 billion, followed by Japan and Germany.
The growth story has shifted from demand to feedstock. Smelters facing thin concentrate fees, cable makers wanting closed-loop metal and governments treating copper as critical are all chasing the same scrap. The European Union is reviewing non-OECD waste exports, and the United States has proposed keeping 25% of high-quality scrap at home. A new plant's first question is therefore where its scrap will come from, not who will buy the cathode.
Recycled copper manufacturing process from scrap to cathode
The reference plant buys graded scrap and sells cathode. It skips the shredding and cable granulation that many yards run upstream, although some operators integrate those steps to capture a wider discount on low-grade feed.
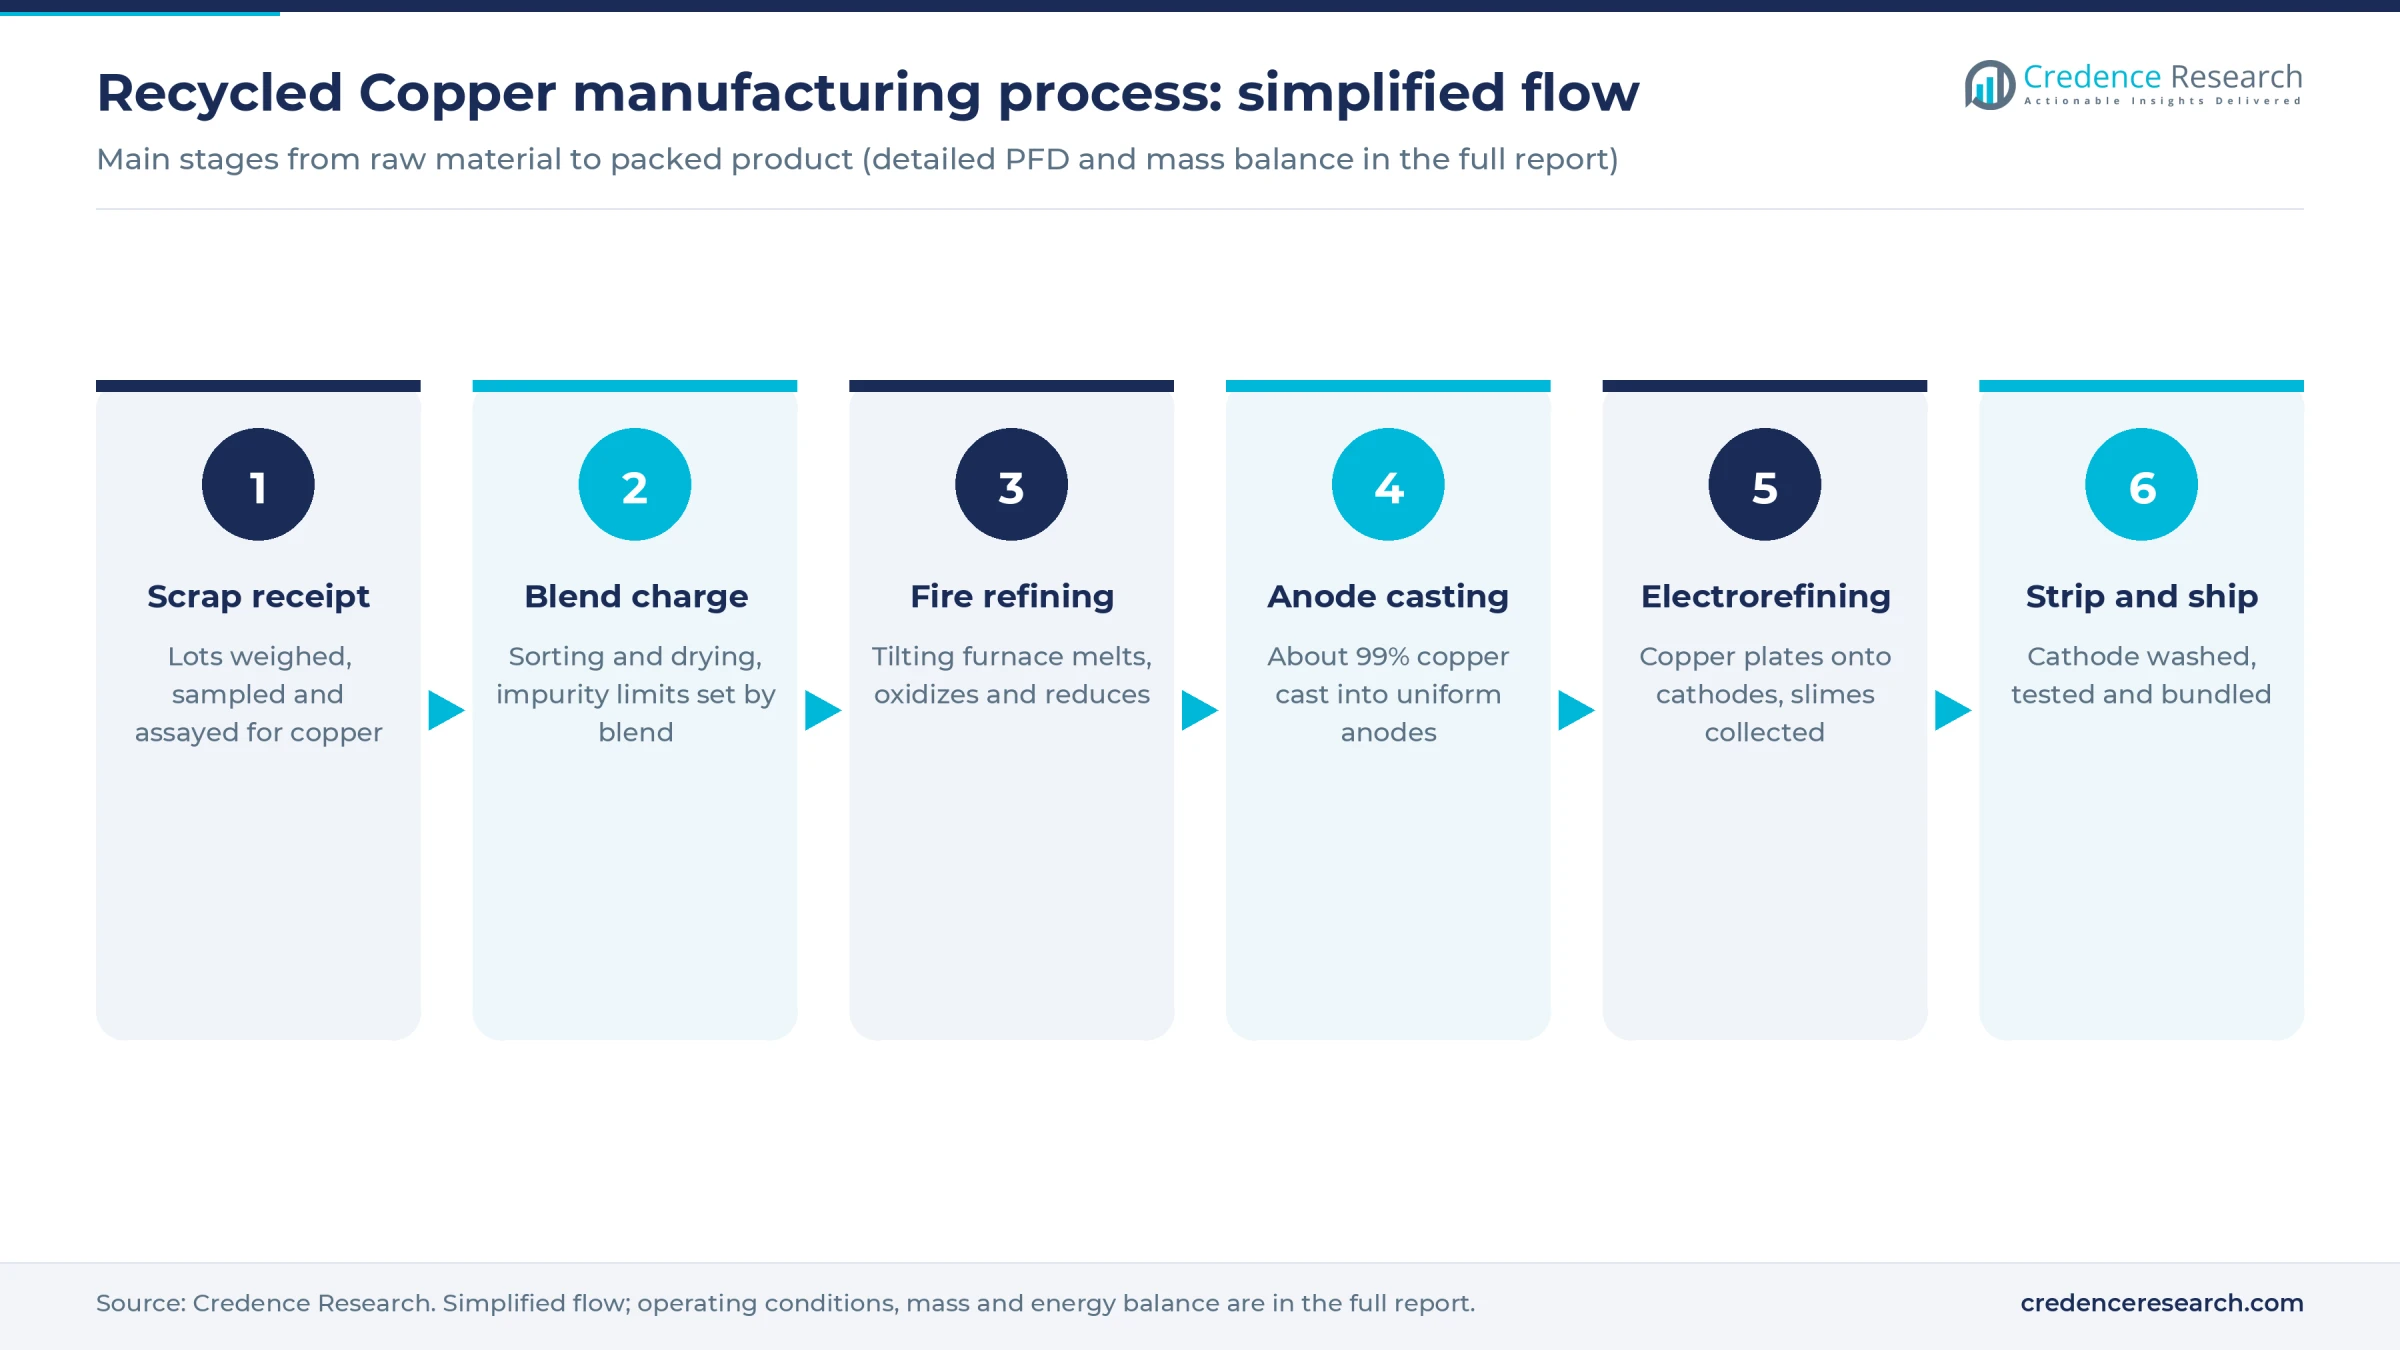
- Scrap receipt and sampling. Lots are weighed, graded and assayed for copper and impurities. Handheld analyzers help, but melt samples settle disputes. Payment follows contained copper, so a sampling error of even half a point can wipe out the margin on a cargo.
- Blending and pretreatment. Oil, plastics and attached iron are reduced through sorting and, where needed, drying. The furnace charge is blended to hold lead, tin, nickel and zinc within limits the tankhouse can tolerate. This step also controls emissions, because organic residues drive much of the dioxin and fume risk.
- Melting and fire refining. A tilting refining furnace melts the charge, oxidizes impurities into slag, then reduces oxygen with a fuel or gas. Slag is skimmed and recycled or sold for its remaining metal.
- Anode casting. Refined metal is cast into anodes of about 99% copper. Consistent weight and flat geometry matter because uneven anodes cause short circuits and lost current in the next stage.
- Electrorefining. Anodes dissolve in an acid copper sulfate bath, and purified copper plates onto stainless or starter cathodes over about two to three weeks. Anode slimes collect gold, silver and other values, which can add useful credits.
- Washing, stripping and shipping. Finished cathode is washed, stripped, tested and bundled. Spent anodes return to the furnace, and bleed electrolyte is treated to recover nickel and copper.
Gas cleaning usually decides whether this design gets permitted. Baghouses, afterburners and quench systems handle the furnace off-gas, and they often cost more to run well than to buy. Fire-refined rod plants skip the tankhouse and need less capital, but they sell into a narrower market.
Recycled copper plant setup cost
The reference plant makes about 20,000 metric tons a year of cathode. Total CapEx is estimated at USD 13–32 million, covering land, buildings, machinery, gas cleaning, utilities, preoperative cost and a non-metal working capital margin.
The closest public benchmark is Pondy Oxides and Chemicals' May 2026 filing, which budgets about 2 billion rupees for 36,000 metric tons a year of cathode using combined pyro-refining and electrorefining. The filing does not say whether existing site assets lower that cost, so it is treated as a floor. That is about USD 630 per metric ton at an assumed 88 rupees. Samta Metals and Alloys' Morocco project, reported at USD 70 million for 15,000 metric tons of copper and 20,000 metric tons of aluminum alloy, works out near USD 2,000 per metric ton, although that blends two metal lines. Nexans' upgrade at Lens, France, at more than EUR 90 million for up to 80,000 metric tons of scrap, is about USD 1,300 at an assumed 1.15, for a rod line on an existing site. Applying USD 650–1,600 per metric ton gives USD 13–32 million.
Complex multimetal smelters are a different business. Aurubis's Richmond, Georgia, plant cost about USD 800 million for 180,000 metric tons of complex feed, so it is excluded from this range.
For the land row, the plant needs about 6 acres, or 24,000 square meters. At an assumed USD 40–100 per square meter in an Asian industrial park, land costs about USD 1.0–2.4 million, close to 7% of mid-range CapEx. U.S. and European sites vary too widely for one figure, and the report can be customized to any country or region.
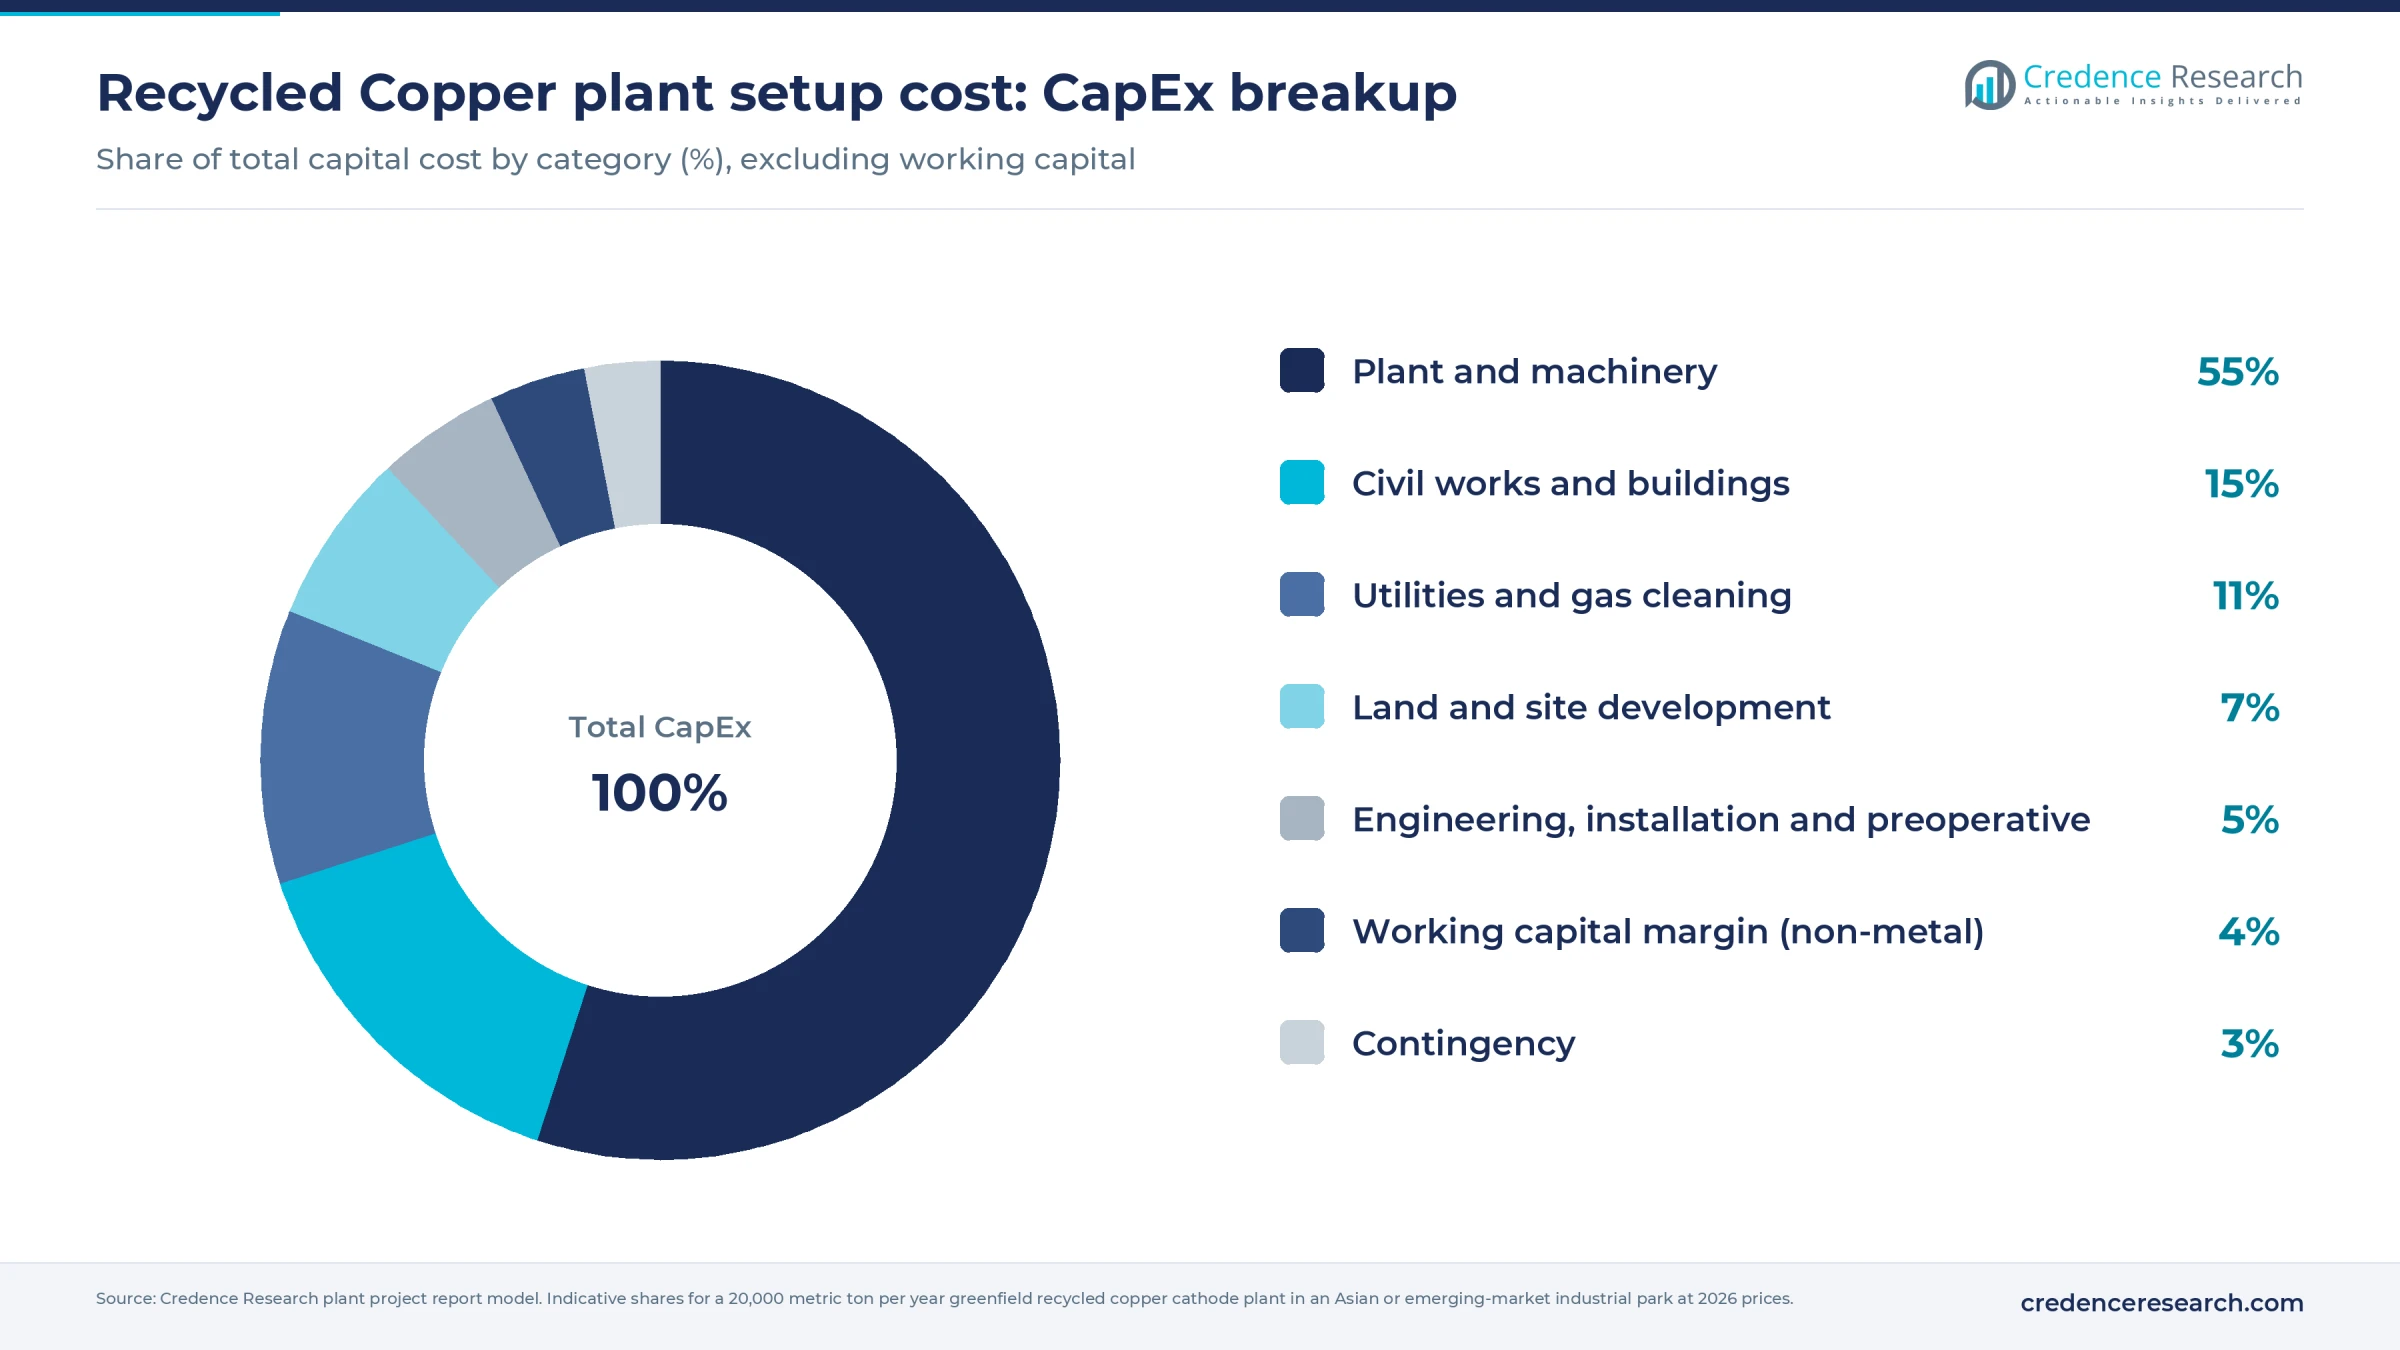
Machinery takes about 55% of CapEx, with furnaces, the tankhouse and gas cleaning as the main items. The larger cash need sits outside this chart: one month of scrap at full rate is worth about USD 23 million, roughly the plant's mid-range cost.
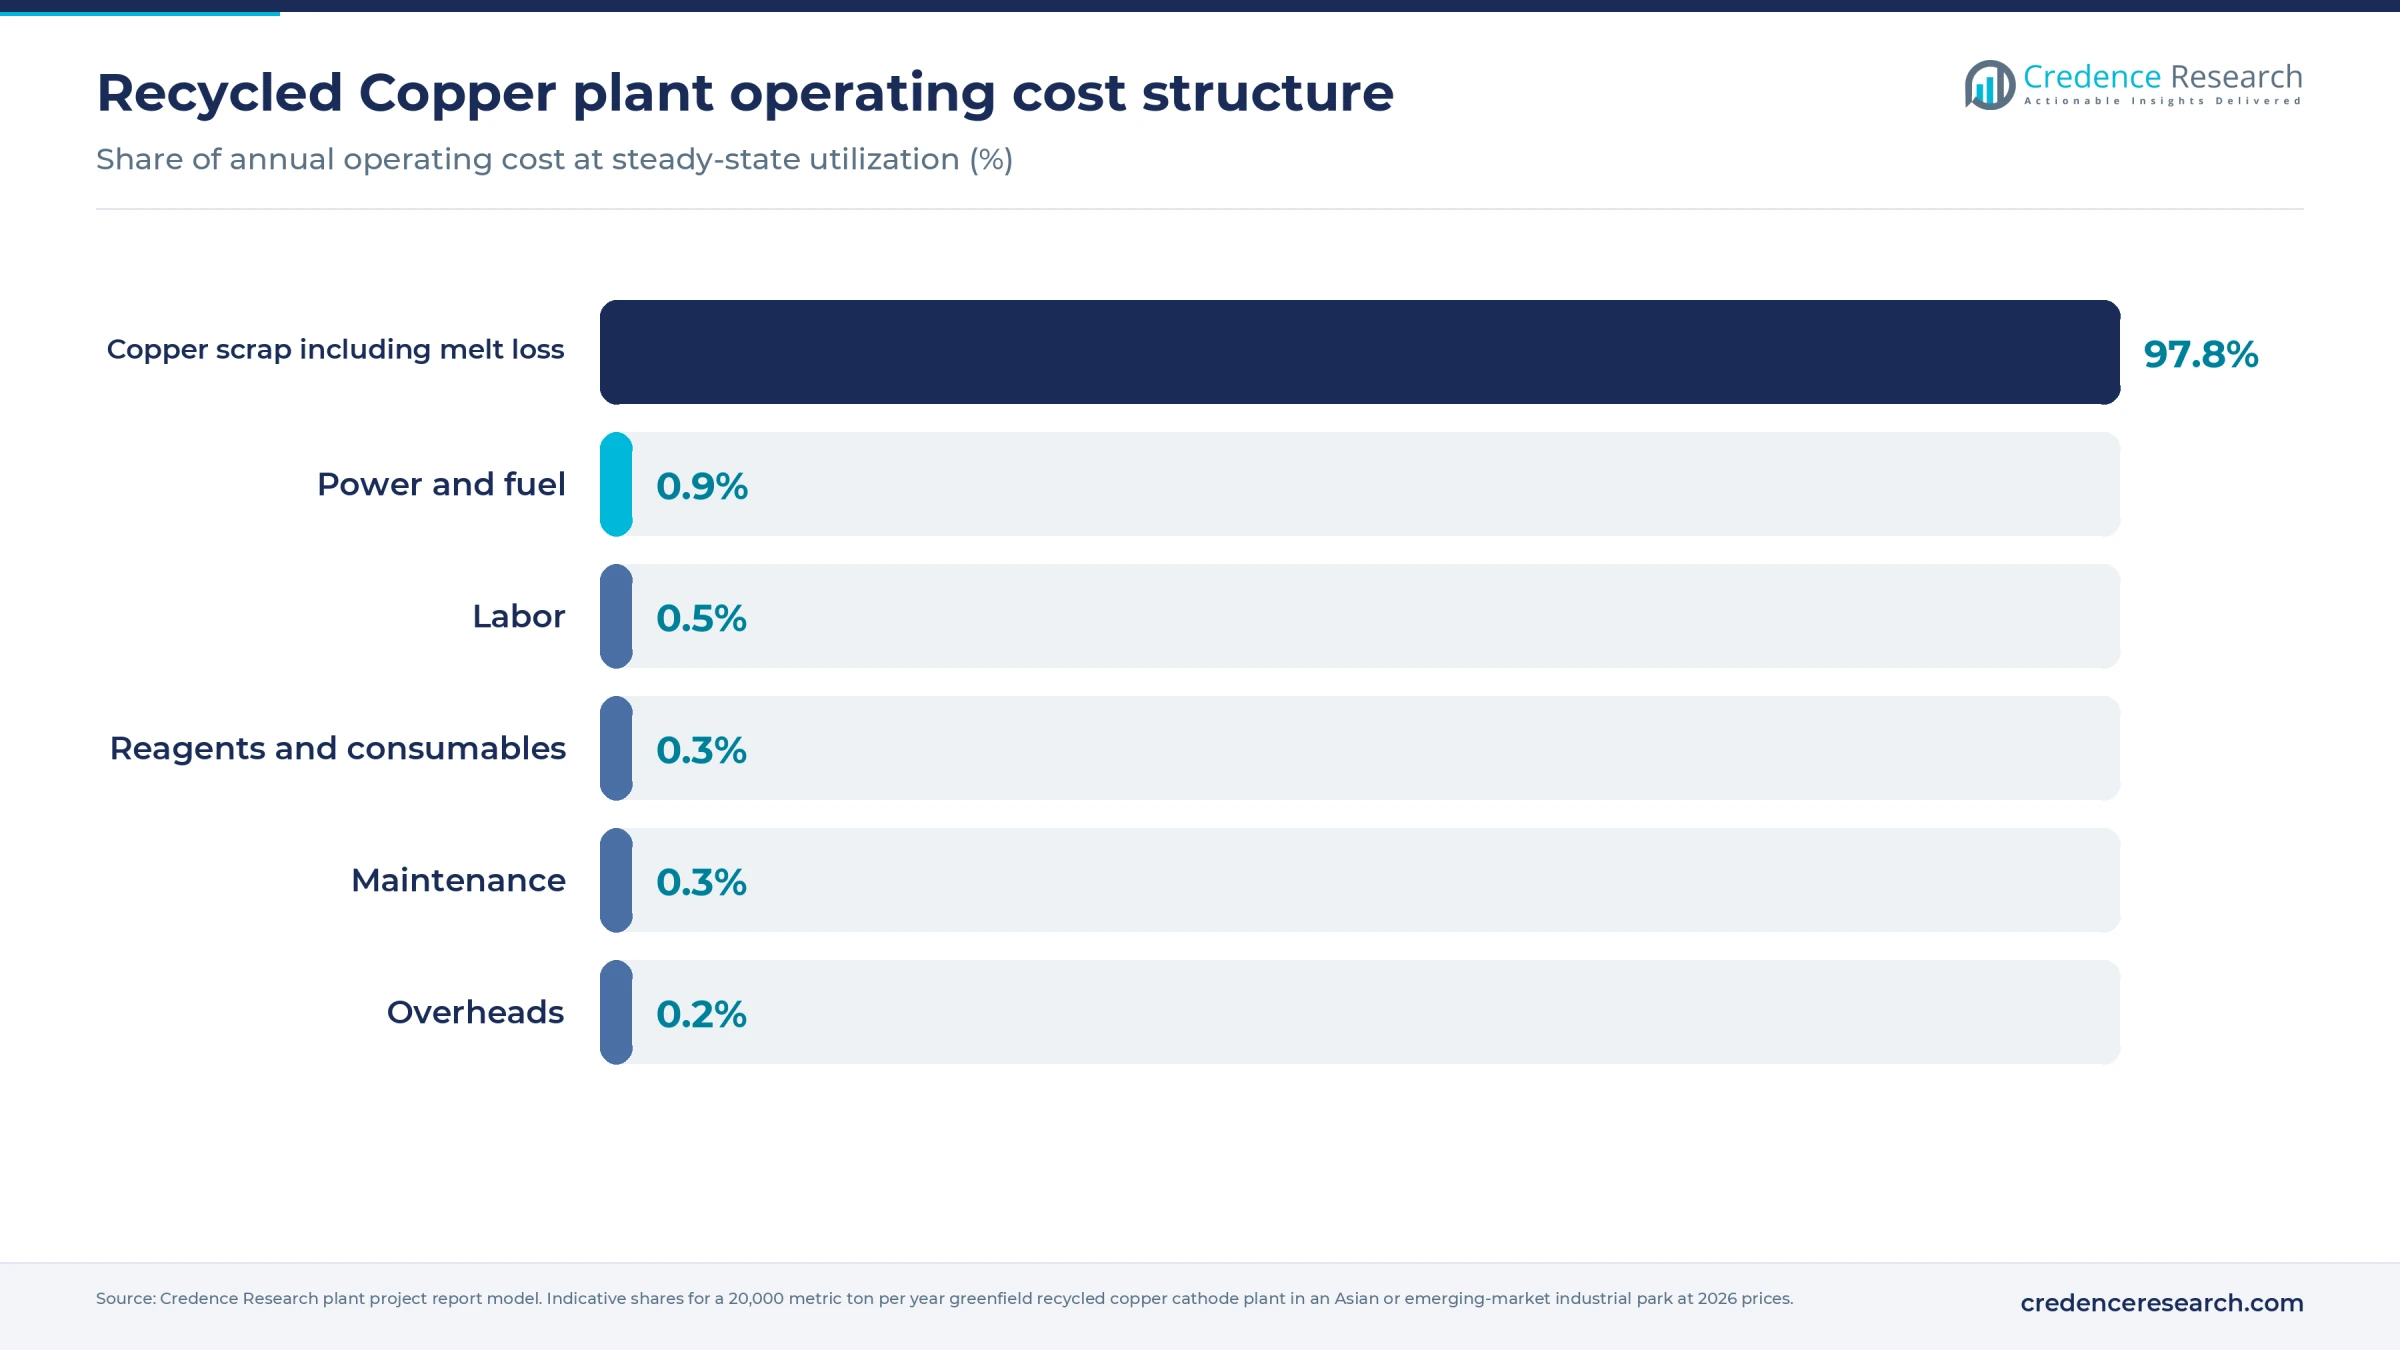
Scrap accounts for about 98% of operating cost. Power, fuel and labor look small in share, but they decide whether the discount captured on scrap turns into profit.
Machinery and raw materials for a recycled copper plant
The main equipment groups are listed below. Sizing, counts and the full schedule are in the report.
- Weighbridge, analyzers, sampling and scrap storage bays
- Charging machines and tilting refining furnaces
- Anode casting wheel or molds and anode preparation
- Electrolytic cells, rectifiers, stainless blanks and stripping machines
- Electrolyte circulation, heating and purification
- Afterburner, quench, baghouse and scrubbing systems
- Slag handling and slimes filtration
- Laboratory, wastewater treatment, cranes and substation
Scrap supply differs sharply by region. The United States, Japan, Germany, the United Kingdom and France were the largest exporters in 2023, and China, Germany and India were large buyers. Southeast Asia and the Middle East also absorb growing volumes of medium and low grades. Domestic collection matters too, especially for plants near cable, motor and appliance recyclers, and it can sit alongside copper foil and fabricator offcuts that return to refiners as process scrap.
Trade rules can move faster than a build schedule. The EU list of approved non-OECD destinations takes effect in May 2027, and China has so far not appeared on it, based on an August 2026 trade analysis. A plant should map at least two feed regions before it commits to a site, and it should price the sampling and credit terms of each, since a bigger discount on paper can hide weaker copper content.
Recycled copper business profit margin and ROI
Gross margin for the reference plant is estimated at 0–4%, measured as cathode price minus scrap and direct conversion. The central case is about 1.5%. A low percentage is normal, since metal value passes through and inflates sales.
The build starts from LME spot copper at USD 14,441 per metric ton on Oct. 21, 2026. A July 2026 market review showed No. 1 scrap at 97–98% of copper value outside China and Asian No. 2 semis at 95–96%. Applying those July ratios to the October price, the model assumes an average payable of 95–97%, with assumed melt loss, cathode premium and conversion cost detailed in the report.
At 85% utilization, or 17,000 metric tons, cash profit runs from about USD 3 million in the central case to USD 8 million in the strong case. Mid-range CapEx of USD 22.5 million then pays back in about 3–8 years before tax and metal financing. After the metal interest below, the same cases pay back in about 4–16 years. The weakest case loses money, so there is no payback at all. Holding one month of metal at an assumed 8% interest costs about USD 1.6 million a year. Each one-point change in the scrap payable moves cash profit by about USD 2.5 million.
| Metric | Value |
|---|---|
| Gross margin | 0–4% |
| Payback period | 3–8 years |
| IRR (post-tax) | Available in report |
| NPV | Available in report |
| Return on investment | Available in report |
| DSCR | Available in report |
| Break-even utilization | Available in report |
How to start a recycled copper business, licenses and approvals
The steps are similar across most countries: company and tax registration, land use and building permits, an environmental permit covering furnace emissions, wastewater and residues, occupational safety and fire approvals, waste handling or recycler registration, and import-export registration for scrap and metal. Air permits usually take longest, since neighbors and regulators focus on metal dust and dioxins.
Examples by market
| Market | Key approvals for a scrap-to-cathode plant |
|---|---|
| United States | EPA Subpart FFFFFF of 40 CFR Part 63 for new secondary copper smelters that are area sources, which covers anode production from scrap but excludes melting for ingots or direct use; state air and discharge permits; EPA nonferrous effluent rules at 40 CFR Part 421 |
| European Union | National integrated permit under Industrial Emissions Directive Annex I, activity 2.5, for producing non-ferrous crude metals from secondary raw materials; 2016 non-ferrous metals BAT conclusions; Waste Shipment Regulation for imported scrap |
| India | Consent to establish and operate from the state pollution control board; recycler registration on the Central Pollution Control Board portal under the Hazardous and Other Wastes Amendment Rules, 2025, whose non-ferrous extended producer responsibility system began April 1, 2026 and covers copper |
Selling cathode as LME-deliverable also requires the brand to be listed by the exchange, a separate step that takes sustained quality records. Many plants therefore sell to rod mills first.
Key recycled copper manufacturers and recent developments
Scrap-based refining ranges from global multimetal groups to regional refiners. Leading names include Aurubis in Germany and the United States, Boliden in Sweden, Glencore at Horne in Canada and Wieland in Germany and the United States. Nexans recycles for its own cable rod in France, and Pondy Oxides and Chemicals is entering from lead recycling in India. Their output also feeds downstream users such as structural copper wire makers.
- May 2026: Pondy Oxides and Chemicals approved a 36,000 metric ton a year cathode plant in Tamil Nadu, India, in two 18,000 metric ton phases, targeting commissioning by December 2026.
- July 2026: Aurubis commissioned its EUR 190 million Complex Recycling Hamburg unit in Germany, which adds more than 30,000 metric tons of complex material capacity, per trade reports.
- July 2026: Shyam Steel opened a recycling site in Hamriyah Free Zone, UAE, with 6,000 metric tons a year of copper alloys and 24,000 metric tons of aluminum alloys.
Clean scrap stayed tight in several regions through 2026, which helps explain why payables held up at record prices. New entrants will likely need low-grade feed skills or captive collection.
What's inside the Recycled Copper project report PDF
The report runs to 21 chapters. Open a chapter to see its sections.
1. Preface
2. Scope and Methodology
- 2.1 Objectives of the Study
- 2.2 Stakeholders
- 2.3 Research Methodology
- 2.4 Data Sources and Key Assumptions
3. Executive Summary
- 3.1 Market Snapshot
- 3.2 Project at a Glance (Capacity, CapEx, OpEx)
- 3.3 Key Financial Indicators (IRR, NPV, Payback, Break-even)
- 3.4 Feasibility Verdict
4. Product Overview
- 4.1 Recycled Copper Definition and Properties
- 4.2 Grades and Specifications (BIS / ISO / ASTM)
- 4.3 HS Code and Classification
- 4.4 Key Applications
- 4.5 Substitutes
5. Global Recycled Copper Market
- 5.1 Market Overview
- 5.2 Historical and Current Market Performance (Volume and Value)
- 5.3 Market Breakup by Grade / Type
- 5.4 Market Breakup by End-Use Industry
- 5.5 Market Breakup by Region
- 5.6 Market Drivers, Restraints and Trends
- 5.7 Value Chain Analysis
- 5.8 Market Forecast
6. Target Country Recycled Copper Market Analysis
- 6.1 Demand and Supply Analysis
- 6.2 Installed Capacity vs Demand Gap
- 6.3 Import Dependence
- 6.4 Demand Forecast by End-Use
7. Trade Analysis
- 7.1 Imports by Volume, Value and Country
- 7.2 Exports by Volume, Value and Country
- 7.3 Trade Balance and Opportunities
8. Price Analysis
- 8.1 Historical Recycled Copper Price Trends by Region
- 8.2 Raw Material / Feedstock Price Trends and Linkage
- 8.3 Price Forecast
- 8.4 Margins Across the Value Chain
9. Competitive Landscape
- 9.1 Market Structure
- 9.2 Key Players and Installed Capacities
- 9.3 Profiles of Key Players
- 9.4 Recent Developments (Expansions, M&A, New Plants)
10. Manufacturing Process and Technology
- 10.1 Comparison of Technology Routes
- 10.2 Selected Route and Process Flow Diagram
- 10.3 Unit Operations Involved
- 10.4 Chemical Reactions Involved
- 10.5 Mass Balance and Raw Material Requirements
- 10.6 Energy Balance
- 10.7 Quality Assurance Criteria and Technical Tests
- 10.8 By-products and Waste Handling
- 10.9 Technology Licensors / Providers
11. Project Details, Requirements and Costs
- 11.1 Land, Location and Site Development
- 11.1.1 Site Selection Criteria
- 11.1.2 Location Analysis
- 11.1.3 Land Requirement and Costs
- 11.1.4 Site Development Costs
- 11.2 Plant Layout
- 11.2.1 Layout Principles
- 11.2.2 Proposed Layout
- 11.2.3 Factors Influencing Layout
- 11.3 Civil Works and Buildings
- 11.4 Plant Machinery
- 11.4.1 Machinery Requirements and Specifications
- 11.4.2 Machinery Costs
- 11.4.3 Machinery Suppliers
- 11.5 Raw Materials
- 11.5.1 Requirements per Tonne of Output
- 11.5.2 Procurement and Sourcing
- 11.5.3 Costs
- 11.5.4 Suppliers
- 11.6 Packaging
- 11.6.1 Packaging Requirements
- 11.6.2 Packaging Costs
- 11.6.3 Packaging Suppliers
- 11.7 Storage and Material Handling
- 11.8 Transportation Requirements and Costs
- 11.9 Utilities
- 11.9.1 Power Requirements and Costs
- 11.9.2 Water Requirements and Costs
- 11.9.3 Steam, Fuel and Other Utilities
- 11.10 Manpower Requirements and Wages
12. Environment, Health, Safety and Sustainability
- 12.1 Effluent and Emissions Management
- 12.2 Hazard Classification and Safety Measures
- 12.3 Carbon Footprint
- 12.4 Green / Low-Carbon Process Options
13. Regulatory Procedures, Approvals and Certifications
- 13.1 Licences and Registrations
- 13.2 Environmental Clearances
- 13.3 Product Certifications (BIS, REACH, etc.)
- 13.4 Approval Timeline
14. Project Implementation Schedule
15. Project Economics
- 15.1 Capital Cost of the Project
- 15.2 Techno-Economic Parameters
- 15.3 Capacity Utilization and Ramp-up
- 15.4 Product Pricing and Margins
- 15.5 Income Projections
- 15.6 Expenditure Projections
- 15.7 Working Capital Requirement
- 15.8 Taxation
- 15.9 Depreciation
16. Financial Analysis
- 16.1 Projected Profit and Loss Account
- 16.2 Projected Cash Flow Statement
- 16.3 Projected Balance Sheet
- 16.4 Liquidity Analysis
- 16.5 Profitability Analysis (Payback, NPV, IRR, ROI)
- 16.6 Break-even Analysis
- 16.7 Debt Service Coverage Ratio (DSCR)
- 16.8 Sensitivity Analysis
- 16.9 Scenario and Uncertainty Analysis
17. Funding and Incentives
- 17.1 Means of Finance and Debt-Equity Structure
- 17.2 Loans and Financial Assistance
- 17.3 Government Schemes and Subsidies (PLI, State Policies)
18. Risk Assessment
- 18.1 Key Success Factors
- 18.2 Key Risk Factors
- 18.3 Risk Mitigation
19. Strategic Recommendations
20. Case Study of a Successful Venture
21. Appendix
- 21.1 Detailed Assumptions
- 21.2 Abbreviations
- 21.3 List of Tables and Figures
- 21.4 Sources
This page vs. the full report
| Data point | On this page (free) | In the full report |
|---|---|---|
| Total CapEx | One rounded range at one capacity | Exact figure at three capacities with a line-item breakup |
| CapEx breakup | Category shares (%) only | Cost, quantity and supplier for every machine |
| Operating cost | Share of raw materials, utilities and labor | Per-unit cost sheet with each input price and consumption |
| Profitability | Gross margin range and payback band | Exact IRR, NPV, ROI, break-even and DSCR |
| Financial statements | List of what is included | 10-year P&L, cash flow, balance sheet and Excel model |
| Sensitivity | One directional line | Full sensitivity and scenario tables |
| Process | Simplified flow diagram | Detailed process flow, mass and energy balance, operating conditions |
| Machinery | Names of the main machines | Specifications, capacity, cost and supplier list |
| Market | Headline size, growth and global demand | Segment, region, trade and price forecast tables |
| Suppliers and buyers | Supplier types and sourcing hubs | Named suppliers and buyers |
Recycled Copper project report: FAQs
How much does it cost to set up a recycled copper plant?
Is recycled copper as good as primary copper?
What is the profit margin in recycled copper production?
What is the payback period for a recycled copper plant?
Which approvals does a recycled copper plant need?
Where do recycled copper plants source scrap?
Why does metal financing matter so much for a recycled copper plant?

About the analyst
Nisha Gupta, Senior Research Analyst
Nisha Gupta is a Senior Research Analyst at Credence Research Inc. who works across industry domains, including packaging, automotive parts and machinery. Her focus is the modelling engine behind each study: she builds quantitative market databases and econometric forecasting frameworks, and developed automated Excel-based market modelling templates that cut client turnaround time by 30%.
Related market research
- Copper and Copper Alloy Scrap and Recycling Market Size, Share and Forecast 2032
- Copper Tube Market Size, Trends, Share, Growth & Forecast 2032
- Copper Foil Market Size, Growth, Analysis and Forecast 2032
- Structural Copper Wire Market Size, Growth and Forecast 2032
- Copper and Brass Flat Products Market Size, Share and Forecast 2032
- Copper Pipes And Tubes Market Size, Growth and Forecast 2032
More plant project reports
- Copper Wire Manufacturing Plant Project Report (DPR) 2026
- Egg Tray Manufacturing Plant Project Report (DPR) 2026
- Condom Manufacturing Plant Project Report (DPR) 2026
- Medical Oxygen Manufacturing Plant Project Report (DPR) 2026
- Engine Oil Manufacturing Plant Project Report (DPR) 2026
- Garlic Powder Manufacturing Plant Project Report (DPR) 2026