
Quick answer
An essential oil plant steam-distills aromatic herbs, grasses, seeds or flowers, then separates, refines and tests the oil. This overview models a greenfield multi-crop unit with capacity of 100 tonnes of oil a year and estimated CapEx of USD 4–8 million. Gross margin is estimated at 25–35% on assumed prices, with payback at 5–10 years. Biomass supply, crop yields and price swings are the main risks.
Viable for a promoter with contracted growers, several crops to fill the season and buyers who pay for documented quality; a single-crop unit selling unbranded oil on the spot market carries real risk.
Essential Oil plant: key highlights
| Parameter | Indicative value | Note |
|---|---|---|
| Plant capacity | 100 tonnes of oil per year | Multi-crop steam distillation with refining, from roughly 10,000 tonnes of biomass at an assumed 1% average yield |
| Total CapEx | USD 4–8 million | Greenfield, scaled from a disclosed Bulgarian distillery plus assumed refining, lab and tank costs; excludes working capital |
| Raw material share of operating cost | 70–78% | Purchased biomass dominates, and its cost per kg of oil moves with yield as well as price |
| Gross margin | 25–35% | At an assumed USD 35–65 per kg blended price, with biomass cost assumed to move with oil prices |
| Payback period | 5–10 years | At 80% utilization with an assumed one-year ramp-up; a high-CapEx build at the lowest profit falls well outside this band |
| IRR | Available in report | Post-tax, 10-year model |
| Break-even | Available in report | Capacity utilization basis |
Ranges assume a 100 tonnes-per-year multi-crop greenfield plant, 80% utilization and 2026 prices. Selling prices of USD 35–65 per kg, biomass at USD 0.20–0.38 per kg, a 1% average oil yield and land rates are assumed. Conversions use assumed rates of USD 1.15 per euro and EGP 48 per U.S. dollar. CapEx excludes working capital and is scaled from disclosed projects. The full report can be customized to any country or region.
What is essential oil?
An essential oil is a concentrated, volatile mixture of aroma compounds taken from plant material, usually by steam distillation or, for citrus peel, by cold pressing. Most oils are terpenes, alcohols, esters and phenols, so composition rather than purity alone decides value. Two lots of the same oil can sell at very different prices if their chemical profiles differ.
The Harmonized System places these products under heading 33.01. Subheading 3301.12 covers orange oil, 3301.13 lemon, 3301.19 other citrus, 3301.24 peppermint, 3301.25 other mints and 3301.29 other non-citrus oils, the likeliest main code for the plant modeled here. Resinoids sit in 3301.30, and terpenic by-products and concentrates in 3301.90.
Buyers fall into four groups. Flavor houses and beverage makers use citrus and mint oils in volume. Fragrance houses buy for perfumes and household products, and some oils go on to become single molecules, a segment followed in Credence Research's essential oil isolates analysis. Oral care and pharmaceutical makers take mint and eucalyptus, and retail brands sell small bottles, tracked in its aromatherapy oils study.
Essential oil market overview and global demand
Credence Research values the global essential oils market at about USD 28 billion in 2025, based on its USD 25.8 billion for 2024 and an 8.6% CAGR, and expects about USD 50 billion by 2032. Citrus oils alone were worth USD 1.7 billion in 2024, according to its citrus oil study.
Trade figures need careful reading. The U.S. Department of Agriculture put world trade at USD 43 billion in 2024, up 25% from 2023, with U.S. exports at a record USD 2.5 billion and imports at USD 5.6 billion. That category looks far wider than plant-distilled oil alone, since USDA ties imports from Ireland to flavoring used by cola makers. A new distiller should not treat it as its addressable market.
Narrower lines give a better sense of scale. World orange oil exports reached about USD 916 million in 2023, TrendEconomy data show, with Brazil at about 39%, followed by the U.S., Germany, Italy and Mexico. Orange oil is largely a juice by-product, so its supply follows the citrus harvest rather than oil demand. India's exports of all essential oils under heading 33.01 came to roughly USD 900 million in 2023, on the same data set, with mint a large share.
Some crops have extreme concentration or regulated supply. Indonesia provides 85–90% of global patchouli demand, the Dutch government's CBI export program reports. In the U.S., a federal marketing order set salable spearmint oil for 2025–26 at about 808,700 pounds of Scotch and 1.03 million pounds of native oil, under a USDA rule published in May 2026. A new plant therefore competes in many small, separate markets, not one large one.
Essential oil manufacturing process
The modeled plant buys fresh or wilted biomass from contract growers and runs steam distillation through a season of several crops, with a refining section to bring oils to buyer specifications. Citrus cold pressing belongs at juice plants and is not included.
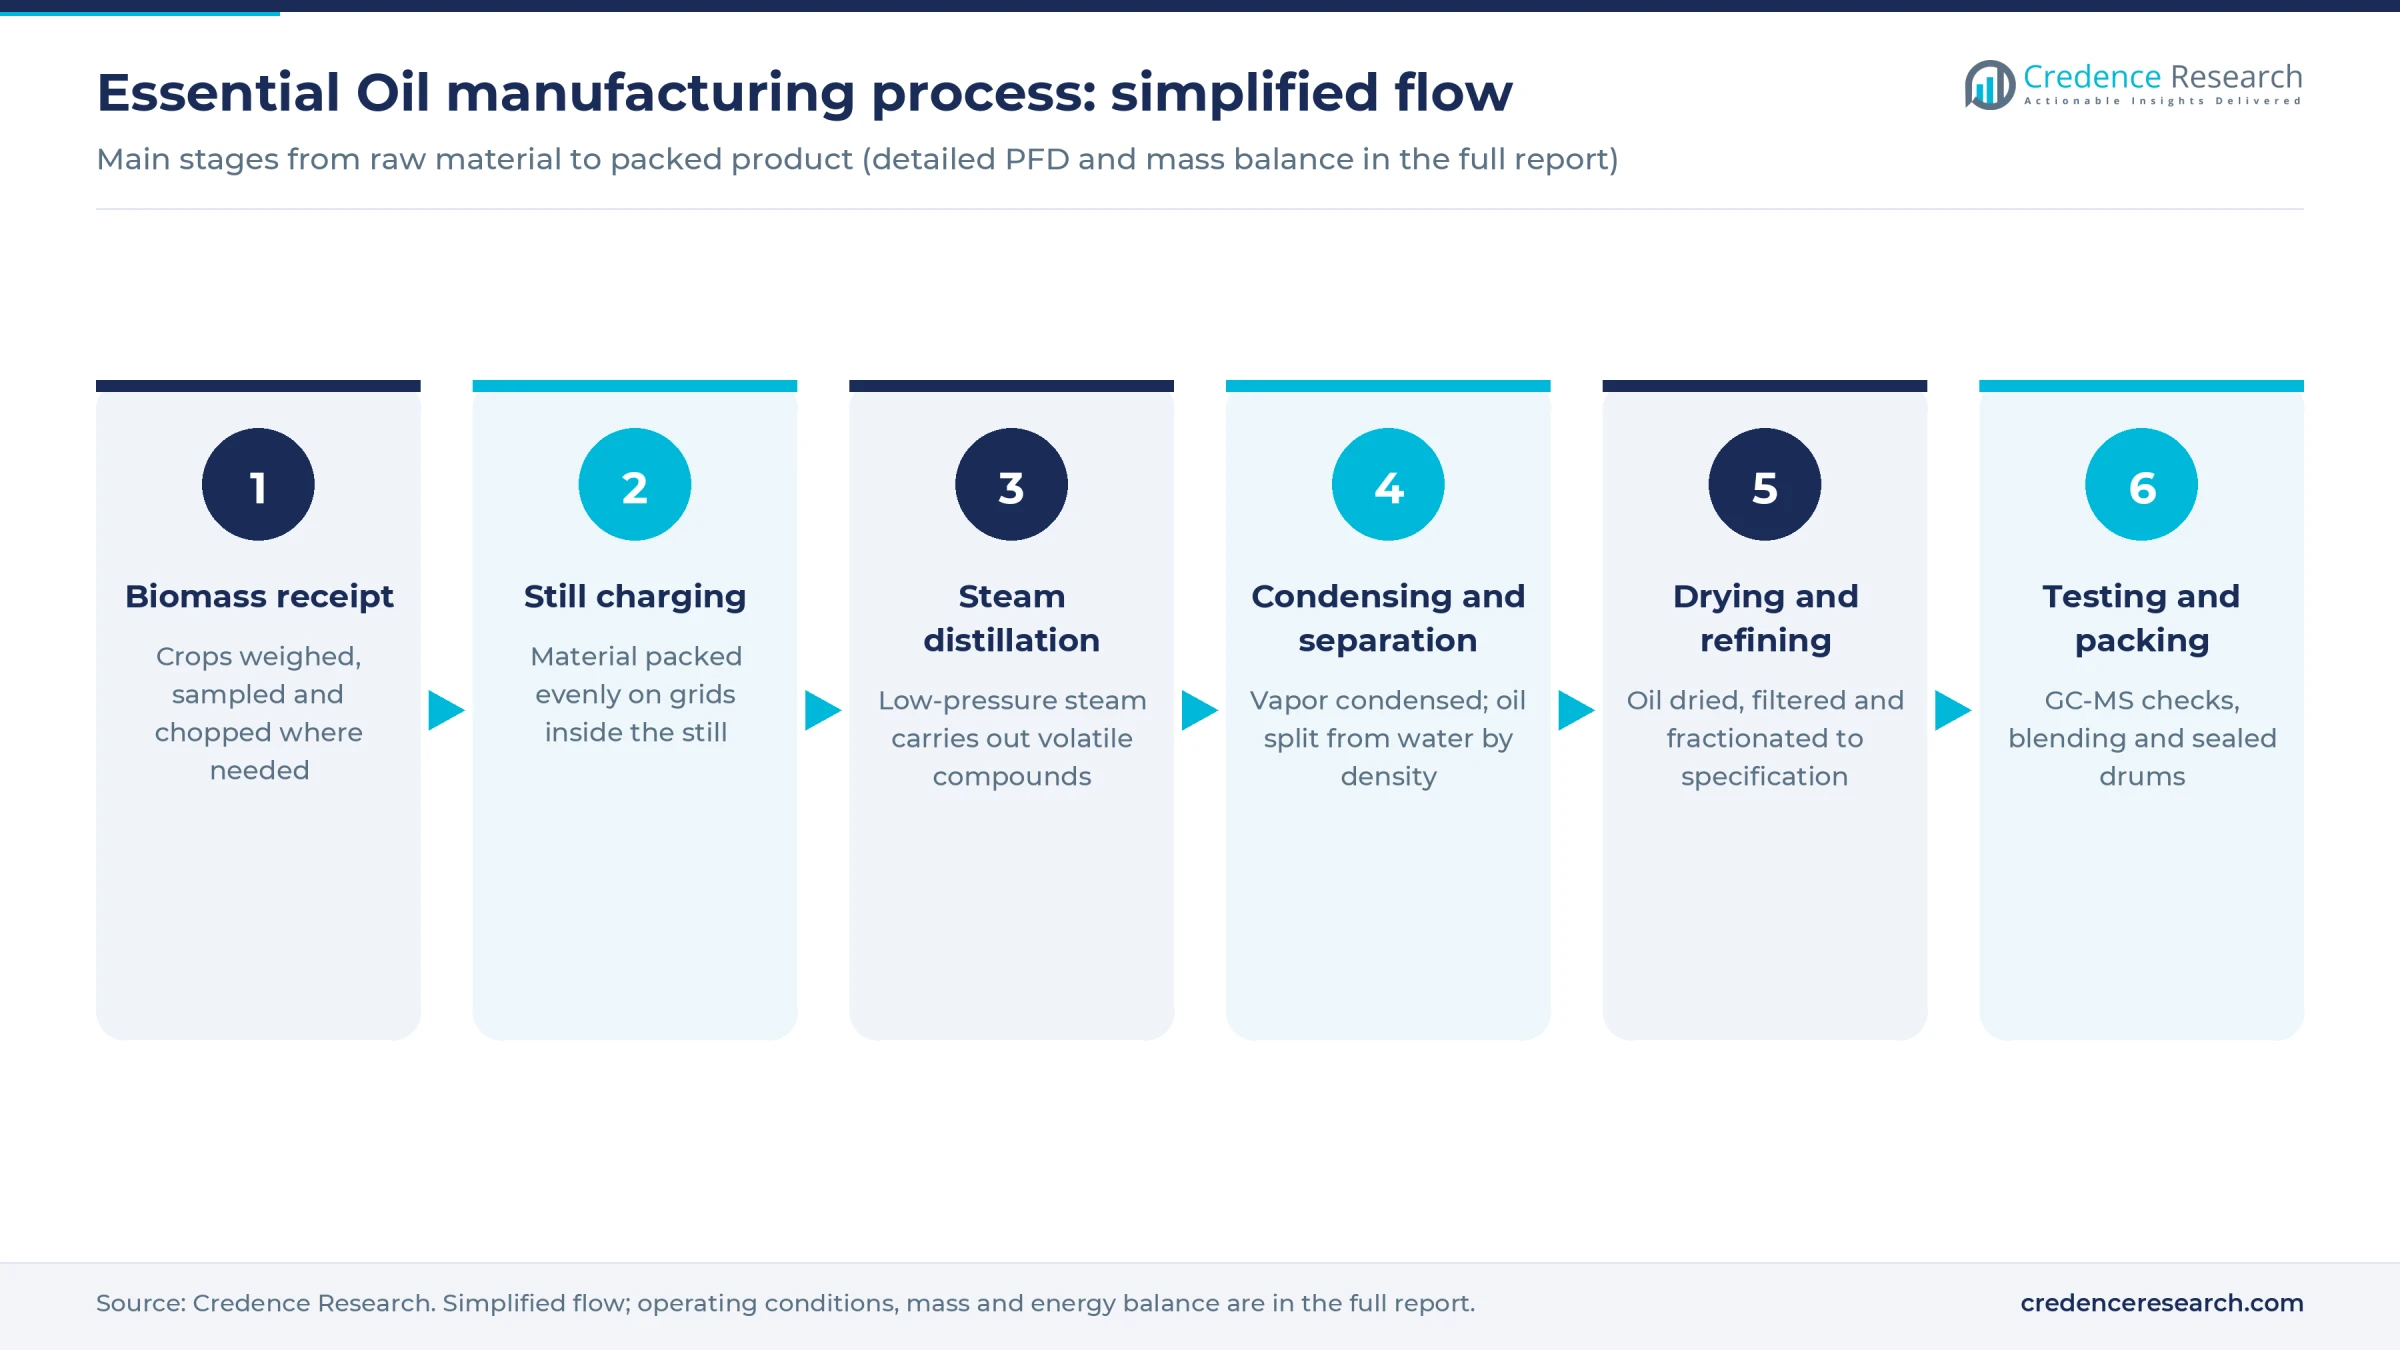
- Biomass receipt. Herbs, grasses, seeds or flowers are weighed, sampled for moisture and oil content, then chopped or crushed if needed. Delay is costly, since many crops lose volatile oil or begin to ferment after cutting.
- Still charging. Material is packed evenly on grids inside the still. Poor packing lets steam channel through gaps, leaving oil behind.
- Steam distillation. Low-pressure steam carries the volatile compounds out of the plant cells. Batches take from about an hour to many hours depending on the crop, and some heavy oils need far longer. Excess heat can damage delicate esters.
- Condensing and separation. A condenser turns the vapor to liquid, and a Florentine separator splits oil from water by density. Water-miscible aroma stays in the hydrosol, which can be sold or redistilled through a cohobation column.
- Drying and refining. Oil is dried, filtered and, where a buyer requires it, rectified or fractionated under vacuum to remove off-notes or concentrate key components.
- Testing and packing. Each lot is checked by gas chromatography-mass spectrometry, then blended to specification and sealed in drums under nitrogen, away from light and heat.
Equipment design has a clear effect on yield. India's CSIR-CIMAP says its improved field units recover 10–15% more oil than local stills, cut distillation time by 30–40% and use 20–30% less fuel, with spent biomass as boiler fuel. Oil yields vary enormously, from fractions of a percent for flowers to several percent for some seeds and buds, so the plant's economics depend heavily on crop mix. Lot records matter too, because adulteration is a persistent concern and buyers increasingly ask for chemical fingerprints that trace back to origin.
Essential oil plant setup cost
This overview models a greenfield plant with capacity of 100 tonnes of oil a year at an estimated total CapEx of USD 4–8 million. Few project disclosures give both cost and tonnage, so the range rests on one main benchmark and added items, and readers should treat it as indicative.
SeeNews reported that Esseterre Bulgaria spent 4.2 million levs, about USD 2.4 million, on a second distillery that doubled capacity to 210 cubic meters a year, a figure the report does not define. Reading the added 105 cubic meters as oil, about 95 tonnes at an assumed density, and assuming a date of about 2019, then applying an assumed 0.7 power rule and 1.25 escalation, gives about USD 3.1 million. Adjusting by an assumed 0.8 for low-cost Asian sites and 1.3 for new U.S. or EU builds gives USD 2.5–4 million. Refining, a test lab, tank storage and packing add an assumed USD 1.5–4 million.
Egypt's Namaa spent EGP 250 million, about USD 5.2 million, on a fractional distillation unit for isolating aroma compounds, which suggests that a heavier refining scope could push a project beyond the top of this range.
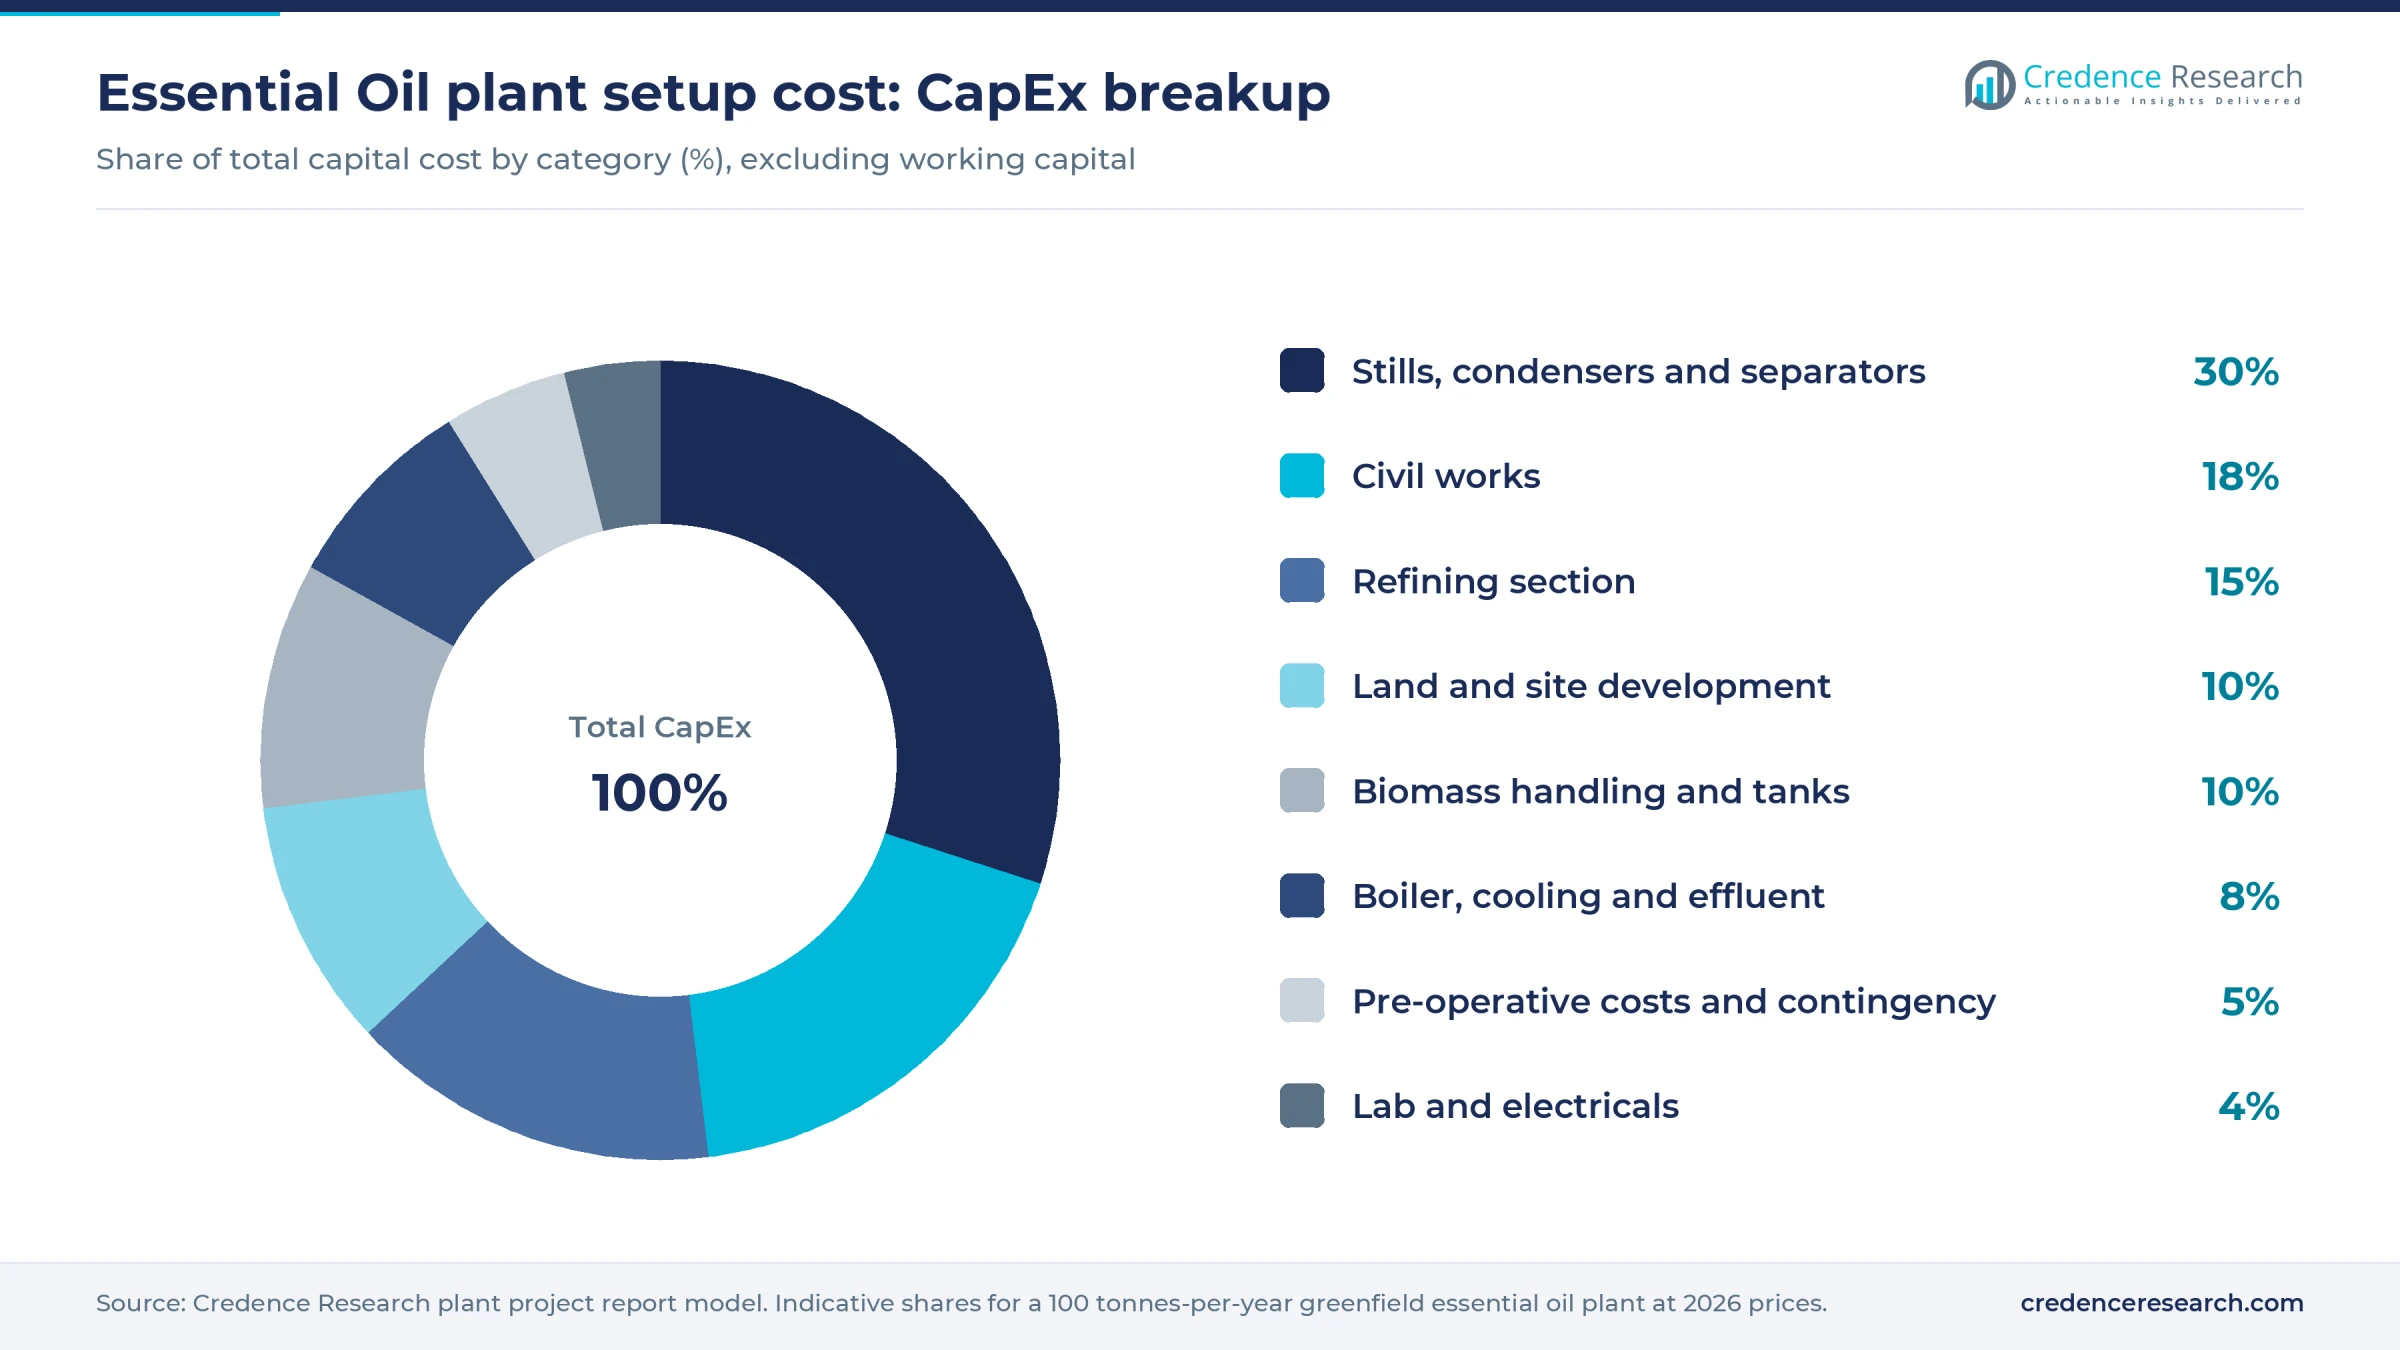
Worked example, land and site development. The plant needs an assumed 10,000–15,000 square meters, including biomass yards and spent biomass handling. At an assumed USD 20–50 per square meter in an Asian industrial park, the plot costs about USD 0.2–0.75 million. At an assumed USD 30–80 at a U.S. or EU site, it costs about USD 0.3–1.2 million. Site works add an assumed USD 0.1–0.3 million, so this row usually runs 7–19% of CapEx. Sites near growing areas are usually cheaper, and they shorten biomass haulage.
Working capital adds an estimated USD 0.8–1.8 million, because seasonal crops are bought within weeks and sold over months.
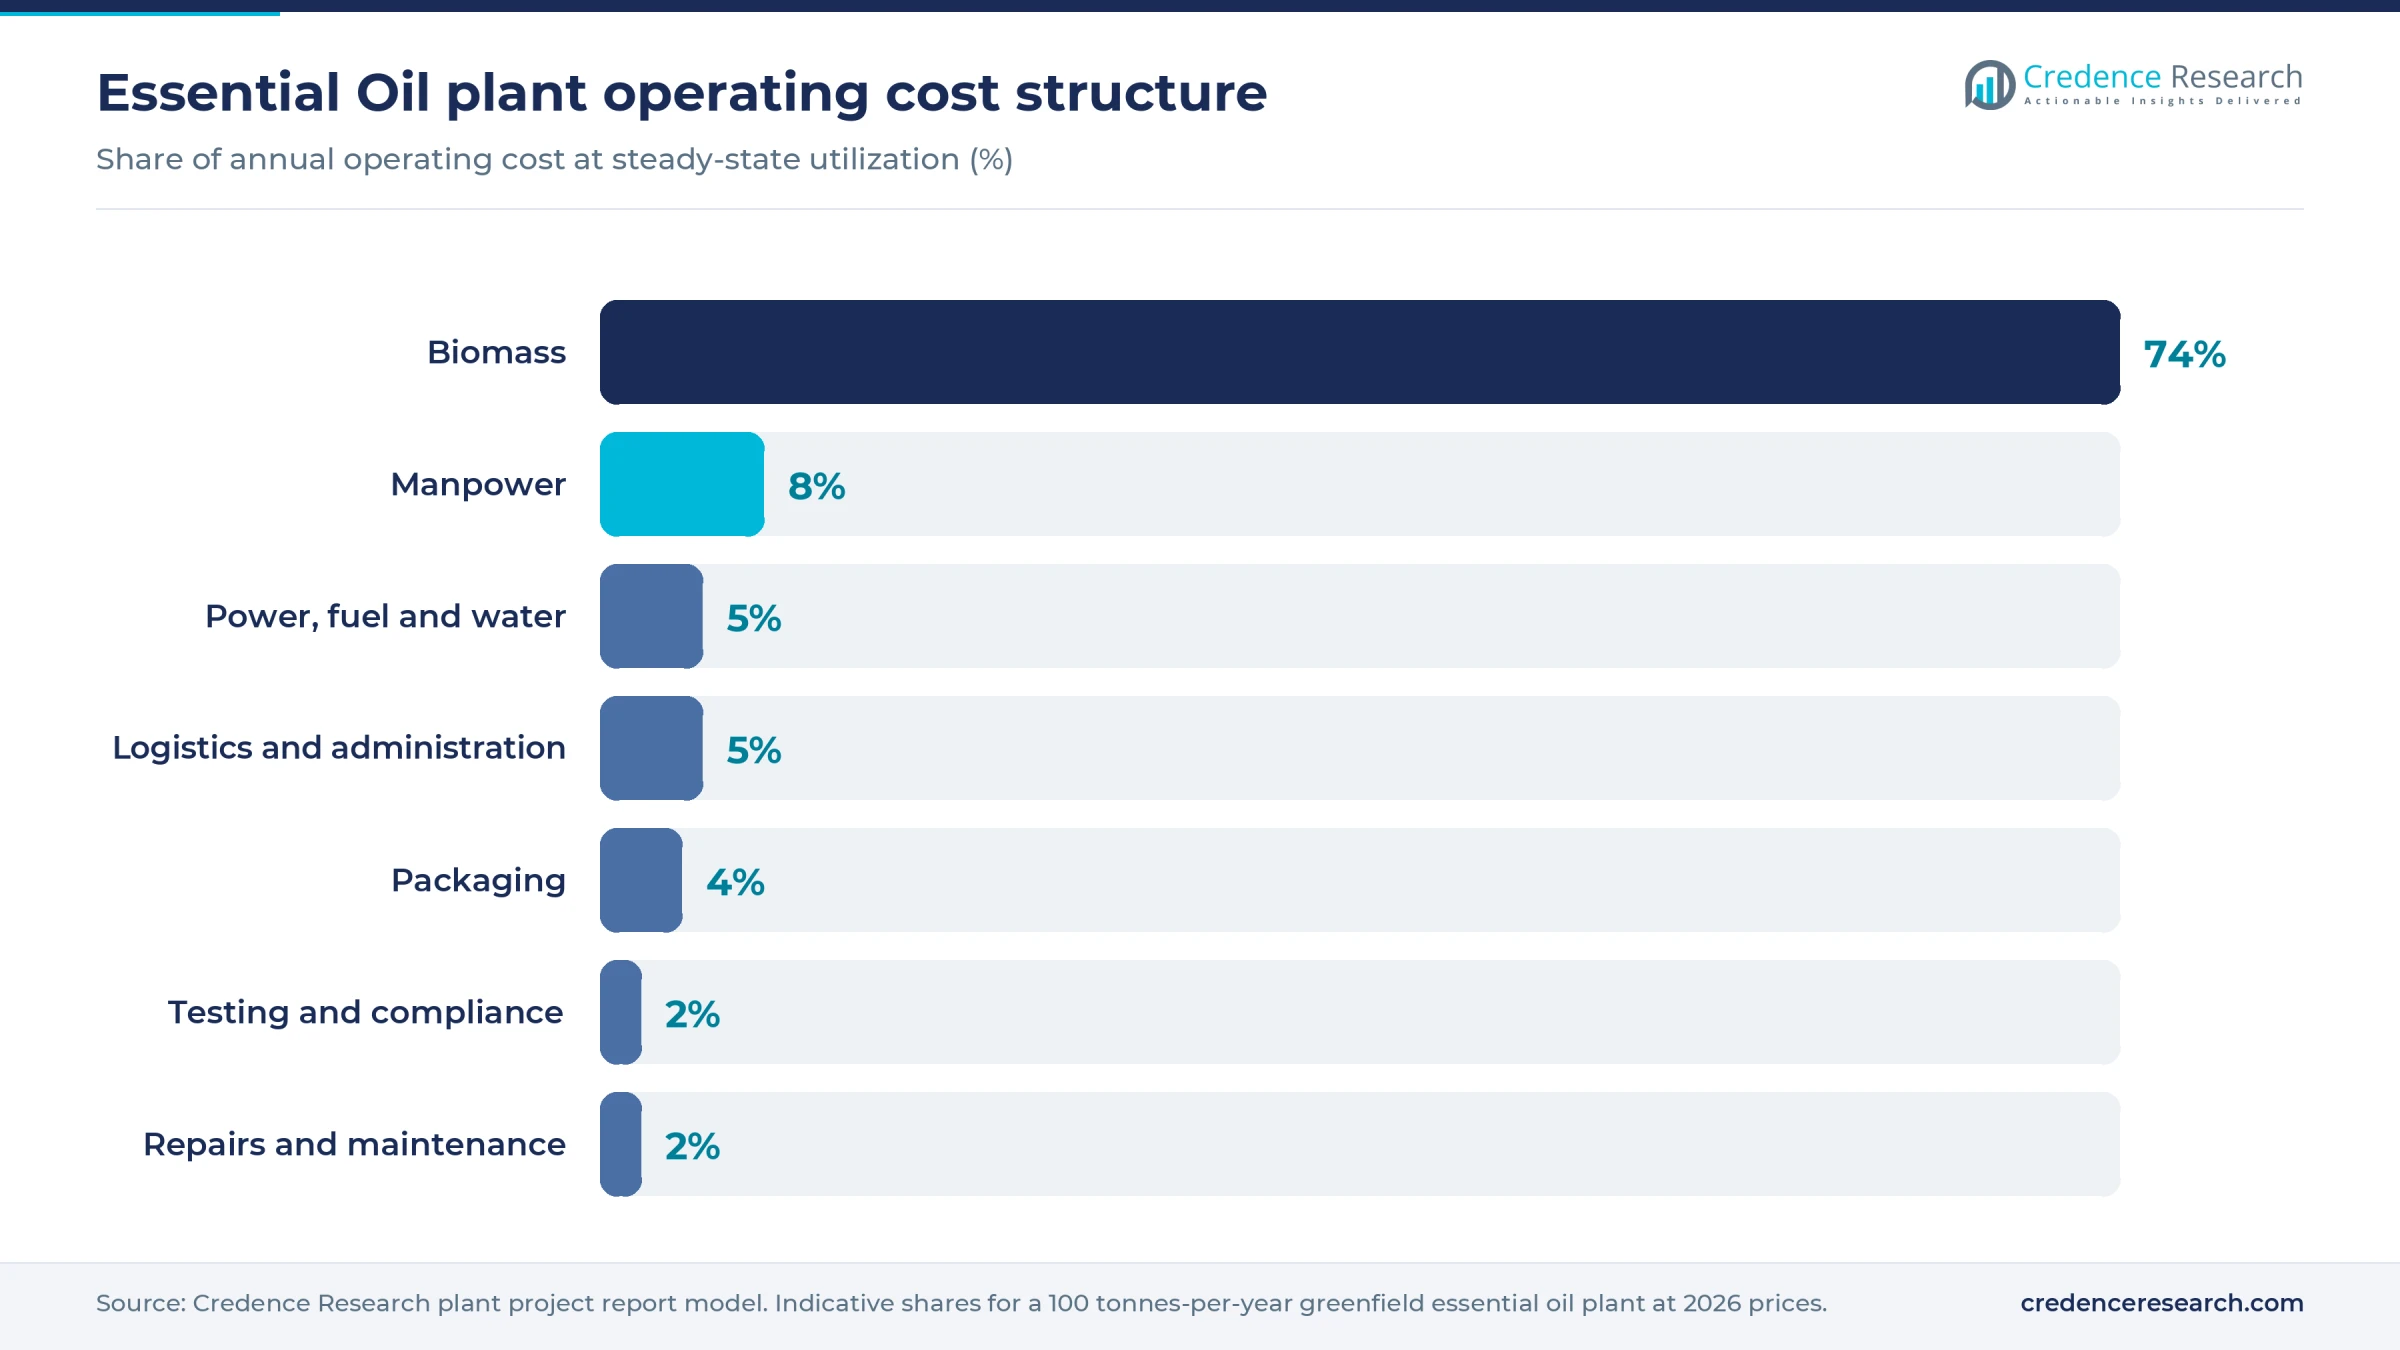
Biomass dominates operating cost, so grower contracts and agronomy support typically matter more than savings on stills.
Machinery and raw materials for an essential oil plant
The main machinery groups are listed below; capacities, specifications and quotations are available in the report.
- Biomass handling: weighbridge, conveyors, chopper or crusher and still-loading hoists
- Distillation: stainless steel stills with baskets, condensers, Florentine separators and cohobation columns
- Refining: dryers, filters and vacuum fractionation columns
- Quality: GC-MS, refractometer, polarimeter and density meter
- Storage and packing: stainless tanks, nitrogen blanketing, drum and small-pack filling
- Utilities: biomass-fired boiler, cooling tower, effluent treatment and spent biomass handling
Sourcing is highly regional, because most fresh biomass cannot travel far before losses mount. India is the leading source of mint and a large producer of lemongrass, citronella and vetiver, while China supplies mint, citronella, eucalyptus and other oils. Indonesia dominates patchouli and is a major source of clove leaf. Bulgaria and France lead lavender, and France also leads lavandin, while Bulgaria and Turkey are known for rose. Brazil, the U.S., Mexico and Italy dominate citrus, and Oregon and Washington remain the core of U.S. mint output.
Yields set the land a plant must secure. A socio-economic review of lavender put average lavender oil output near 40 kg per hectare, so one tonne of that oil needs about 25 hectares. Most promoters therefore contract growers and pay by oil content or weight, rather than rely on spot biomass.
Essential oil business profit margin and ROI
Gross margin after biomass and direct conversion is estimated at 25–35%, at an assumed blended price of USD 35–65 per kg and 80 tonnes sold. After assumed overheads and 20% tax, and a one-year ramp-up, cash profit of about USD 0.3–1.1 million gives a typical 5–10 year payback. A USD 8 million build at the lowest profit would take about 26 years, so CapEx discipline matters at this scale.
Public pricing is thin. The Dutch government's CBI program said in January 2026 that no single public source gives current FOB prices, and its indicative 2025 exporter price for patchouli was EUR 55–75 per kg, about USD 63–86. Export guide Ximpex listed menthol crystals at USD 12–25 per kg. The assumed blend sits between these two points.
Margin is earned mainly on three levers. The first is oil yield per tonne of biomass, since biomass bought by weight costs more per kg of oil in a poor season. An unrecovered 10% rise in biomass cost trims gross margin by an estimated 6 percentage points. The second is filling stills across more months with several crops, because a single-crop plant sits idle for most of the year. The third is selling refined, documented lots to fragrance and flavor buyers rather than crude oil to traders.
| Metric | Value |
|---|---|
| Project IRR (post-tax) | Available in report |
| NPV | Available in report |
| Return on investment | Available in report |
| DSCR | Available in report |
| Break-even utilization | Available in report |
How to start an essential oil business, licenses and approvals
An essential oil plant needs approvals in six areas wherever it is built. These are business and tax registration; land use, zoning and building permits; an environmental permit covering boiler emissions, volatile compounds and still wastewater; occupational safety approvals, including boilers and flammable liquid storage; product compliance tied to end use, whether food, cosmetic or chemical; and customs registration, with dangerous goods paperwork for shipments of flammable oils. Buyers often also ask for ISO 9001, FSSC 22000 or organic certificates, along with GC-MS profiles and allergen declarations.
| Market | Product | Environment and safety |
|---|---|---|
| United States | FDA food facility registration for food-grade oil, with many oils listed as generally recognized as safe in 21 CFR 182.20; MoCRA facility registration when making finished cosmetics; therapeutic claims can make a product a drug | State air permit; NPDES or local pretreatment permit; OSHA hazard communication; DOT hazardous materials rules; California Proposition 65 warnings where listed substances exceed limits |
| European Union | REACH under ECHA, where buyers above 1 tonne a year need a registered supplier; CLP safety data sheets; Regulation (EC) No 1334/2008 for flavorings; Regulation (EU) 2023/1545 on fragrance allergens in cosmetics | National environmental and worker safety permits; ADR rules for road transport of flammable goods |
| India | FSSAI license for food-grade oil; manufacturing license under the Cosmetics Rules, 2020, from the state licensing authority for finished cosmetics; DGFT export license for sandalwood oil | State pollution control board consents to establish and operate; factory license and boiler registration |
CBI estimates that a non-EU exporter registering one oil under REACH through an Only Representative pays EUR 40,000–50,000, which is a real cost for a multi-crop plant.
Key essential oil manufacturers and recent developments
Givaudan, dsm-firmenich, Symrise, Robertet and Mane lead the fragrance and flavor houses that buy, process and sometimes distill natural oils. Specialists include Treatt, Berjé, which bought Peruvian citrus processors in 2024, Citrus and Allied Essences, and Flavex in Germany for CO2 extracts. Young Living and doTERRA are major retail brands with their own sourcing networks. Most other output comes from regional distillers and grower groups across India, China, Indonesia, Bulgaria and France, which is the competitive set a new plant actually faces.
- November 2025. Namaa Flavors & Fragrances opened a natural isolation unit in Egypt's 10th of Ramadan industrial zone, using vacuum fractional distillation on essential oils, in an EGP 250 million project.
- April 2026. Treatt, the U.K. extracts and ingredients maker, accepted a GBP 183 million cash offer from Germany's Döhler Group, LSE.co.uk reported. The scheme took effect on July 2, 2026, and Treatt delisted the next day.
- July 2026. Symrise signed a put option agreement for Floral Concept, a natural fragrance ingredients house in the Grasse region of France, with terms undisclosed, to form a naturals cluster with Maison Lautier 1795, and had completed the purchase by September 2026.
What's inside the Essential Oil project report PDF
The report runs to 21 chapters. Open a chapter to see its sections.
1. Preface
2. Scope and Methodology
- 2.1 Objectives of the Study
- 2.2 Stakeholders
- 2.3 Research Methodology
- 2.4 Data Sources and Key Assumptions
3. Executive Summary
- 3.1 Market Snapshot
- 3.2 Project at a Glance (Capacity, CapEx, OpEx)
- 3.3 Key Financial Indicators (IRR, NPV, Payback, Break-even)
- 3.4 Feasibility Verdict
4. Product Overview
- 4.1 Essential Oil Definition and Properties
- 4.2 Grades and Specifications (BIS / ISO / ASTM)
- 4.3 HS Code and Classification
- 4.4 Key Applications
- 4.5 Substitutes
5. Global Essential Oil Market
- 5.1 Market Overview
- 5.2 Historical and Current Market Performance (Volume and Value)
- 5.3 Market Breakup by Grade / Type
- 5.4 Market Breakup by End-Use Industry
- 5.5 Market Breakup by Region
- 5.6 Market Drivers, Restraints and Trends
- 5.7 Value Chain Analysis
- 5.8 Market Forecast
6. Target Country Essential Oil Market Analysis
- 6.1 Demand and Supply Analysis
- 6.2 Installed Capacity vs Demand Gap
- 6.3 Import Dependence
- 6.4 Demand Forecast by End-Use
7. Trade Analysis
- 7.1 Imports by Volume, Value and Country
- 7.2 Exports by Volume, Value and Country
- 7.3 Trade Balance and Opportunities
8. Price Analysis
- 8.1 Historical Essential Oil Price Trends by Region
- 8.2 Raw Material / Feedstock Price Trends and Linkage
- 8.3 Price Forecast
- 8.4 Margins Across the Value Chain
9. Competitive Landscape
- 9.1 Market Structure
- 9.2 Key Players and Installed Capacities
- 9.3 Profiles of Key Players
- 9.4 Recent Developments (Expansions, M&A, New Plants)
10. Manufacturing Process and Technology
- 10.1 Comparison of Technology Routes
- 10.2 Selected Route and Process Flow Diagram
- 10.3 Unit Operations Involved
- 10.4 Chemical Reactions Involved
- 10.5 Mass Balance and Raw Material Requirements
- 10.6 Energy Balance
- 10.7 Quality Assurance Criteria and Technical Tests
- 10.8 By-products and Waste Handling
- 10.9 Technology Licensors / Providers
11. Project Details, Requirements and Costs
- 11.1 Land, Location and Site Development
- 11.1.1 Site Selection Criteria
- 11.1.2 Location Analysis
- 11.1.3 Land Requirement and Costs
- 11.1.4 Site Development Costs
- 11.2 Plant Layout
- 11.2.1 Layout Principles
- 11.2.2 Proposed Layout
- 11.2.3 Factors Influencing Layout
- 11.3 Civil Works and Buildings
- 11.4 Plant Machinery
- 11.4.1 Machinery Requirements and Specifications
- 11.4.2 Machinery Costs
- 11.4.3 Machinery Suppliers
- 11.5 Raw Materials
- 11.5.1 Requirements per Tonne of Output
- 11.5.2 Procurement and Sourcing
- 11.5.3 Costs
- 11.5.4 Suppliers
- 11.6 Packaging
- 11.6.1 Packaging Requirements
- 11.6.2 Packaging Costs
- 11.6.3 Packaging Suppliers
- 11.7 Storage and Material Handling
- 11.8 Transportation Requirements and Costs
- 11.9 Utilities
- 11.9.1 Power Requirements and Costs
- 11.9.2 Water Requirements and Costs
- 11.9.3 Steam, Fuel and Other Utilities
- 11.10 Manpower Requirements and Wages
12. Environment, Health, Safety and Sustainability
- 12.1 Effluent and Emissions Management
- 12.2 Hazard Classification and Safety Measures
- 12.3 Carbon Footprint
- 12.4 Green / Low-Carbon Process Options
13. Regulatory Procedures, Approvals and Certifications
- 13.1 Licences and Registrations
- 13.2 Environmental Clearances
- 13.3 Product Certifications (BIS, REACH, etc.)
- 13.4 Approval Timeline
14. Project Implementation Schedule
15. Project Economics
- 15.1 Capital Cost of the Project
- 15.2 Techno-Economic Parameters
- 15.3 Capacity Utilization and Ramp-up
- 15.4 Product Pricing and Margins
- 15.5 Income Projections
- 15.6 Expenditure Projections
- 15.7 Working Capital Requirement
- 15.8 Taxation
- 15.9 Depreciation
16. Financial Analysis
- 16.1 Projected Profit and Loss Account
- 16.2 Projected Cash Flow Statement
- 16.3 Projected Balance Sheet
- 16.4 Liquidity Analysis
- 16.5 Profitability Analysis (Payback, NPV, IRR, ROI)
- 16.6 Break-even Analysis
- 16.7 Debt Service Coverage Ratio (DSCR)
- 16.8 Sensitivity Analysis
- 16.9 Scenario and Uncertainty Analysis
17. Funding and Incentives
- 17.1 Means of Finance and Debt-Equity Structure
- 17.2 Loans and Financial Assistance
- 17.3 Government Schemes and Subsidies (PLI, State Policies)
18. Risk Assessment
- 18.1 Key Success Factors
- 18.2 Key Risk Factors
- 18.3 Risk Mitigation
19. Strategic Recommendations
20. Case Study of a Successful Venture
21. Appendix
- 21.1 Detailed Assumptions
- 21.2 Abbreviations
- 21.3 List of Tables and Figures
- 21.4 Sources
This page vs. the full report
| Data point | On this page (free) | In the full report |
|---|---|---|
| Total CapEx | One rounded range at one capacity | Exact figure at three capacities with a line-item breakup |
| CapEx breakup | Category shares (%) only | Cost, quantity and supplier for every machine |
| Operating cost | Share of raw materials, utilities and labor | Per-unit cost sheet with each input price and consumption |
| Profitability | Gross margin range and payback band | Exact IRR, NPV, ROI, break-even and DSCR |
| Financial statements | List of what is included | 10-year P&L, cash flow, balance sheet and Excel model |
| Sensitivity | One directional line | Full sensitivity and scenario tables |
| Process | Simplified flow diagram | Detailed process flow, mass and energy balance, operating conditions |
| Machinery | Names of the main machines | Specifications, capacity, cost and supplier list |
| Market | Headline size, growth and global demand | Segment, region, trade and price forecast tables |
| Suppliers and buyers | Supplier types and sourcing hubs | Named suppliers and buyers |
Essential Oil project report: FAQs
How much does it cost to set up an essential oil plant?
How much biomass does an essential oil plant need?
What profit margin can an essential oil plant earn?
Which essential oils should a new plant produce?
Which licenses does an essential oil plant need?
Is steam distillation better than solvent or CO2 extraction?

About the analyst
Rajdeep Kumar Deb, Lead Analyst - Consumer & Finance
Rajdeep brings a decade of consumer goods and financial services insight to strategic market analysis.
Related market research
- Essential Oils Market Size, Share, Growth and Forecast 2032.
- Citrus Essential Oil Market Size, Growth, Share and Forecast 2032
- Essential Oil Isolates Market Size, Growth, Share & Forecast 2032
- Aromatherapy Oils Market Size, Share, Growth and Forecast 2032
- Wood Essential Oils Market Size, Trends, Share & Forecast 2032
- Encapsulated Flavors and Fragrances Market Size and Share 2032
More plant project reports
- Cigarette Lighter Manufacturing Plant Project Report (DPR) 2026
- Palm Oil Processing Plant Project Report (DPR) 2026
- Perfume Manufacturing Plant Project Report (DPR) 2026
- Paper Cups Manufacturing Plant Project Report (DPR) 2026
- Cigarette Manufacturing Plant Project Report (DPR) 2026
- Ceiling Fan Manufacturing Plant Project Report (DPR) 2026