
Quick answer
A paper cups manufacturing plant converts coated cupstock into printed, formed drinking cups. A mid-size unit making about 500 million 8 oz-equivalent cups a year needs an estimated USD 5–9 million of CapEx. Cupstock and other materials take 55–65% of operating cost, leaving a gross margin of 20–30% at mid-market prices. Payback is about 3–5 years at 85% utilization, provided the plant holds steady coffee chain or distributor volume.
Viable for a converter with secured cupstock and contracted foodservice buyers, but only if its coating choice can meet tightening rules on plastic-lined cups in export markets.
Paper Cups plant: key highlights
| Parameter | Indicative value | Note |
|---|---|---|
| Plant capacity | About 500 million cups per year | 8 oz-equivalent, about 16 high-speed formers on three shifts |
| Total CapEx | USD 5–9 million | Greenfield, Asian machinery basis; European machinery or U.S. and EU sites at or above the top |
| Raw material share of operating cost | 55–65% | Coated cupstock is about 55%; inks and packing materials add the rest |
| Gross margin | 20–30% | Delivered price minus materials and direct conversion, at a mid-market price |
| Payback period | 3–5 years | At 85% utilization and mid-range CapEx of about USD 7 million |
| IRR | Available in report | Post-tax, 10-year model |
| Break-even | Available in report | Capacity utilization basis |
Ranges assume about 500 million 8 oz-equivalent cups a year, a greenfield Asian industrial park (U.S. and EU costs higher), 2026 prices, 85% utilization, listed Asian formers, assumed press and building costs, cupstock at USD 1,100–1,620 per metric ton, an assumed USD 0.027 delivered cup price and rupee figures at 88 per USD. Customizable to any country.
What is a paper cups manufacturing plant?
Paper cups are disposable drinking containers formed from food-grade paperboard with a thin liquid barrier on the inside. A converting plant does not make the board. It buys coated cupstock in reels, prints and die-cuts it into curved fan-shaped blanks, then forms each blank around a mandrel, seals the side seam, fits a separate bottom disc and curls the rim.
The main formats are single-wall hot cups, double-wall and ripple insulated cups, and cold cups coated on both sides, usually in sizes from 4 oz to 22 oz. Barrier choice now defines the product as much as size does. Polyethylene remains the workhorse, while PLA and water-based dispersion coatings serve buyers facing plastic rules or composting requirements. In the Harmonized System, paper cups fall under subheading 4823.69, which also covers paper trays, dishes and plates, so trade data for the code overstate cups alone. Coffee chains, quick-service restaurants, vending operators, offices, airlines and ice cream brands are the main users.
Paper cups market overview and global demand
The global market for disposable drinking cups was USD 14.0 billion in 2023 and is forecast by Credence Research to reach USD 18.9 billion by 2032, a 3.77% CAGR.
Cups themselves are bulky and low in value per truckload, so most printed volume is made within a day or two of delivery from the customer, while plain stock cups travel farther.
Demand follows takeaway coffee and tea, delivery and quick-service dining. North America and Western Europe are the largest mature markets by value, while China, India and Southeast Asia add new volume as cafe chains expand and as buyers move from foam and plastic cups to fiber. Buyers split into two groups: national chains that award large printed contracts on annual tenders, and distributors that buy plain or lightly printed stock cups on price.
Regulation cuts both ways for fiber cups. Limits on foam and plastic cups help paper, yet European rules now target plastic-lined paper cups too and push operators toward reusable options. A new entrant should therefore expect growth to favor cups with lower plastic content, and should test exposure to reusable mandates before relying on EU volume. Trends in paperboard packaging demand also influence board availability and pricing for converters.
Paper cups manufacturing process from cupstock to carton
Paper cup production is a dry converting process with no pulping or papermaking on site. Most waste is clean trim that can be sold as baled scrap, although plastic-coated trim fetches less than plain board. The sequence below describes a plant that prints its own blanks, which is where a converter earns its branded-cup premium.
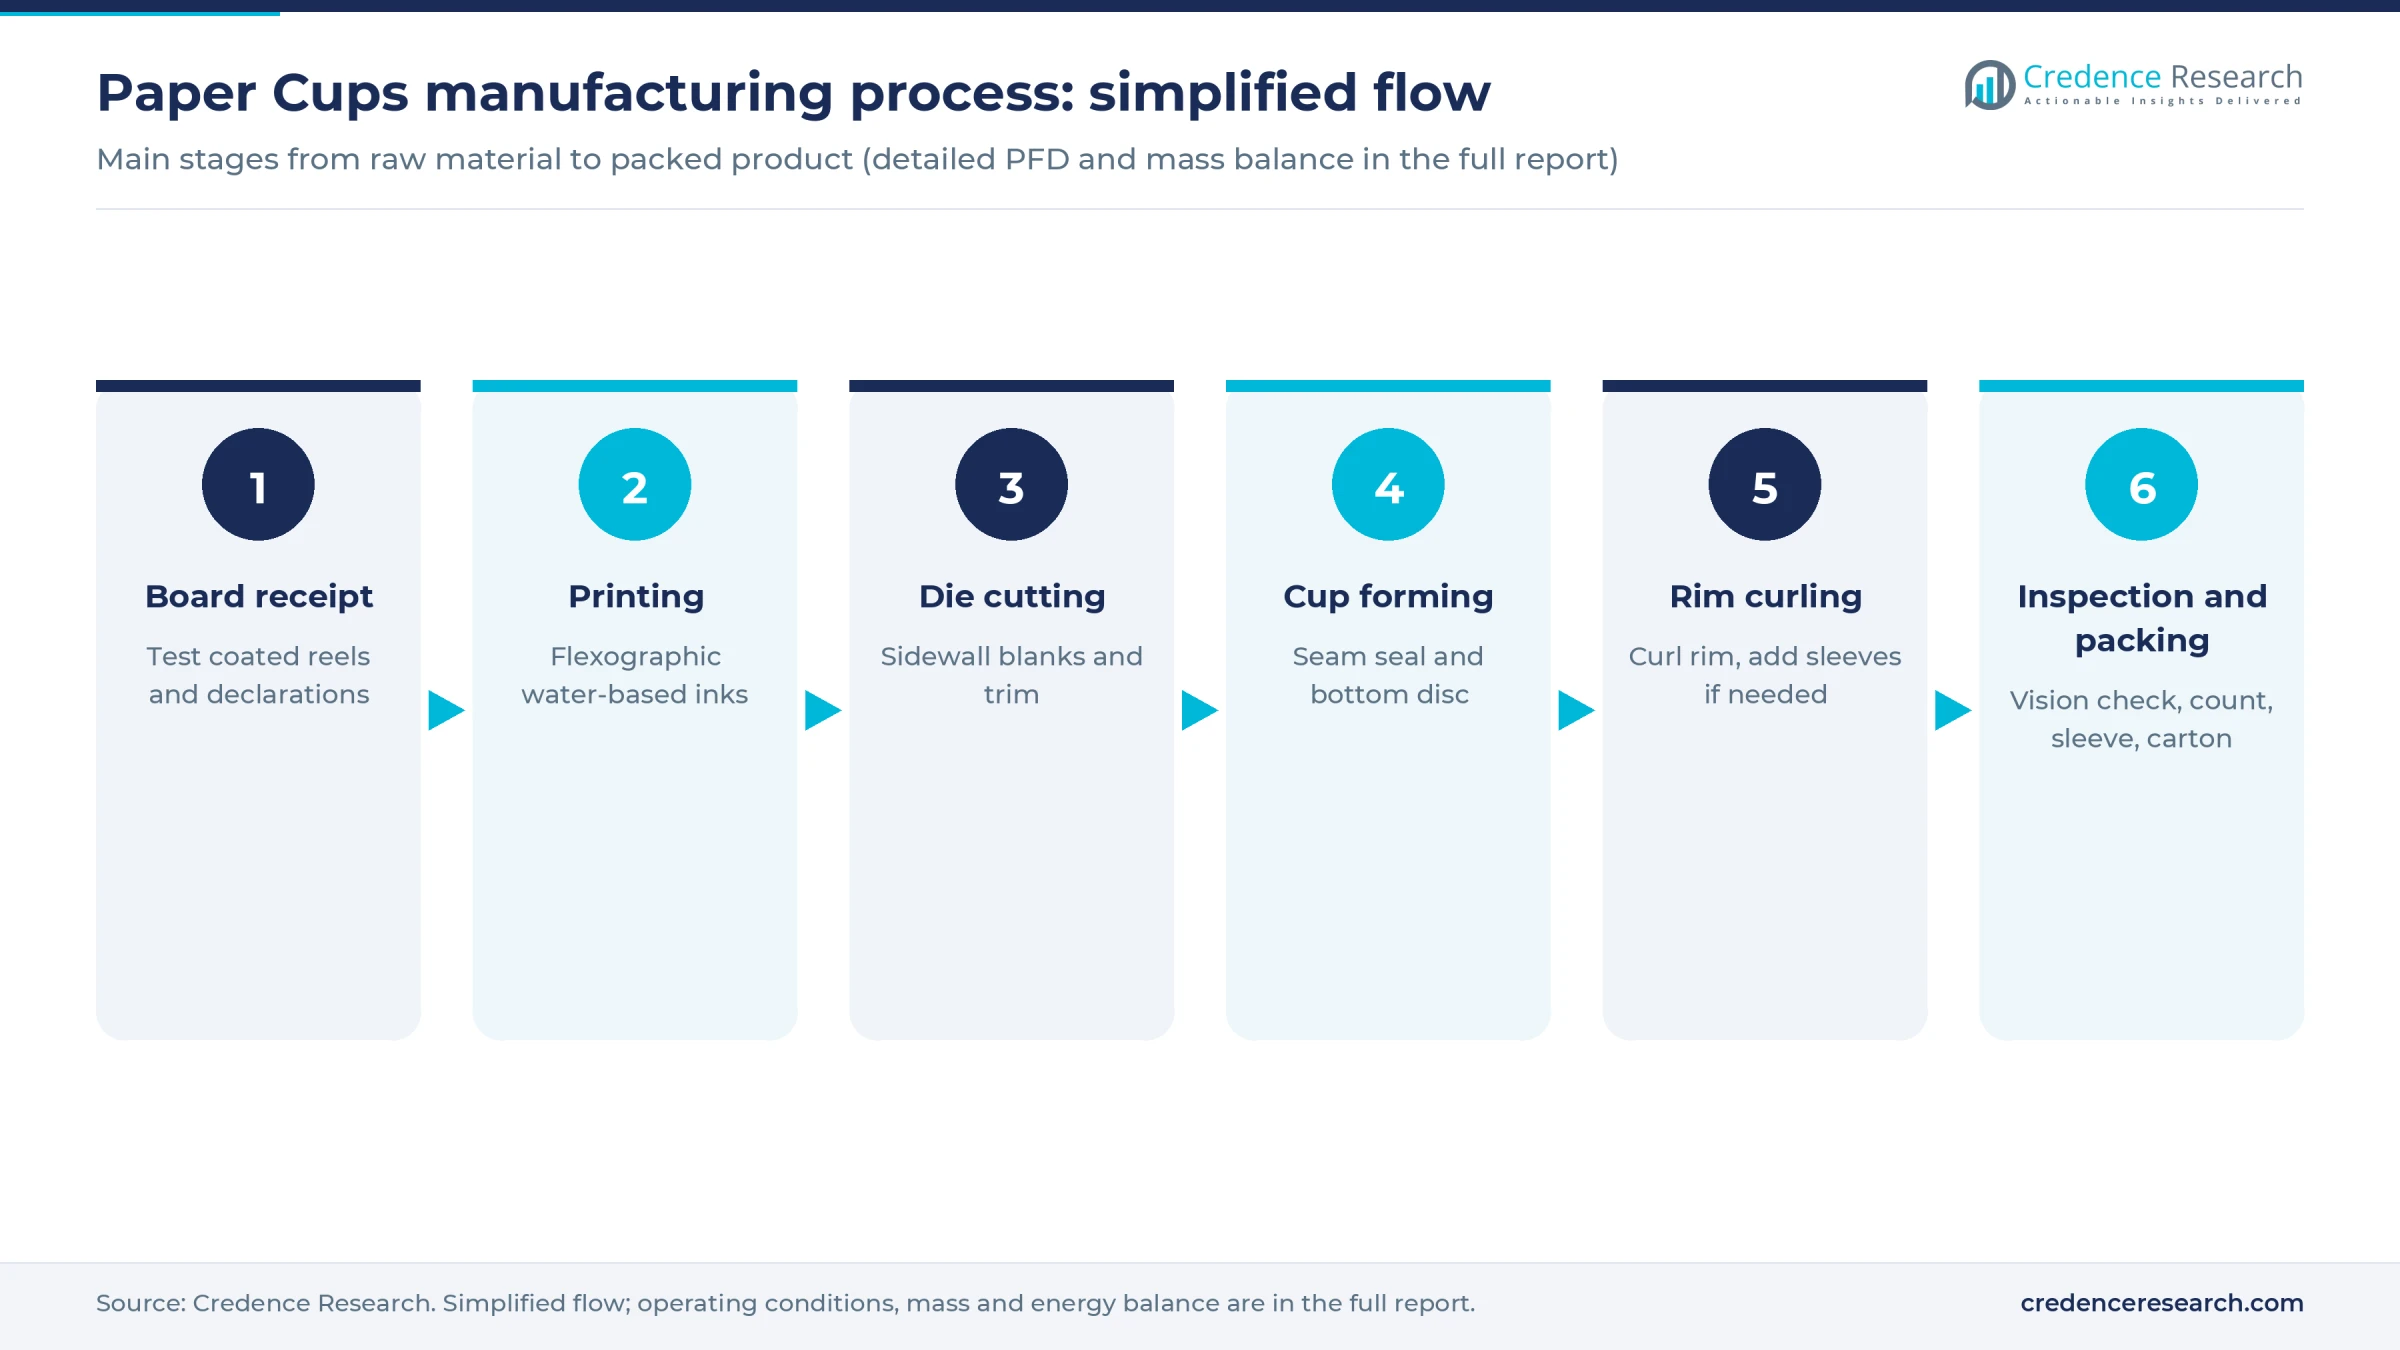
- Board receipt and testing. Coated reels are checked for grammage, coating weight, moisture and any food-contact declaration from the mill. Consistent coating matters because heat-seal failure on a forming machine usually traces back to the reel.
- Flexographic printing. Water-based inks are applied in reel-to-reel presses, with low-migration ink systems required for food-contact work. Print changeovers are the main loss of productive time for plants serving many brands.
- Die cutting. Printed reels pass through rotary or platen die cutters that produce curved sidewall blanks and stacked, nested waste skeletons. Layout efficiency here directly sets board yield, so tooling design pays for itself quickly.
- Cup forming. Blanks feed a forming machine that wraps them around a tapered mandrel and seals the side seam with hot air or ultrasonic energy. Bottom discs are punched from a separate reel, inserted, knurled and heat sealed.
- Rim curling and double wrapping. The top edge is curled to create a stiff drinking rim. Insulated products pass to a second machine that adds an outer sleeve or corrugated wall.
- Inspection and packing. Vision systems reject leaks, misprints and rim defects, then cups are counted into stacks, sleeved in film and packed in cartons under hygienic conditions.
Water-based barrier boards generally need tighter heat and pressure control than polyethylene, so plants serving European buyers should trial these grades before committing machines. Output depends on changeovers, seam reject rates and machine uptime, which is why print-heavy plants run noticeably below nameplate speed.
Paper cups plant setup cost
The reference plant in this report is a greenfield unit making about 500 million 8 oz-equivalent cups a year. That output comes from about 16 high-speed formers running around 6,900 hours a year at about 75% effective efficiency. At this scale, total CapEx is estimated at USD 5–9 million, including land, buildings, utilities, preoperative costs and working capital margin.
The range starts from listed prices for Asian forming machines plus assumed costs for presses, die cutters and packing lines, then scales up using the capital structure of a public fully automatic paper cup project profile from India's Uttar Pradesh government, in which plant and machinery made up about 38% of project cost. Two disclosed projects support the order of magnitude. Benders paper cups committed GBP 9 million in 2016 to high-speed forming and printing machines for a 40% capacity increase at Wrexham, and Huhtamaki budgeted EUR 10 million in 2021 to relocate its Malaysian cup plant. Selecting European high-speed formers, or building in the U.S. or EU, pushes the total to or above the top of the range.
For the land row, the plant needs about 8,000 square meters for the building, reel storage, finished goods and truck movement. At an assumed USD 30–100 per square meter in an Asian industrial park, land costs about USD 240,000–800,000, near 7% of CapEx. U.S. and European parks vary far more by location, so the full report models the chosen site.
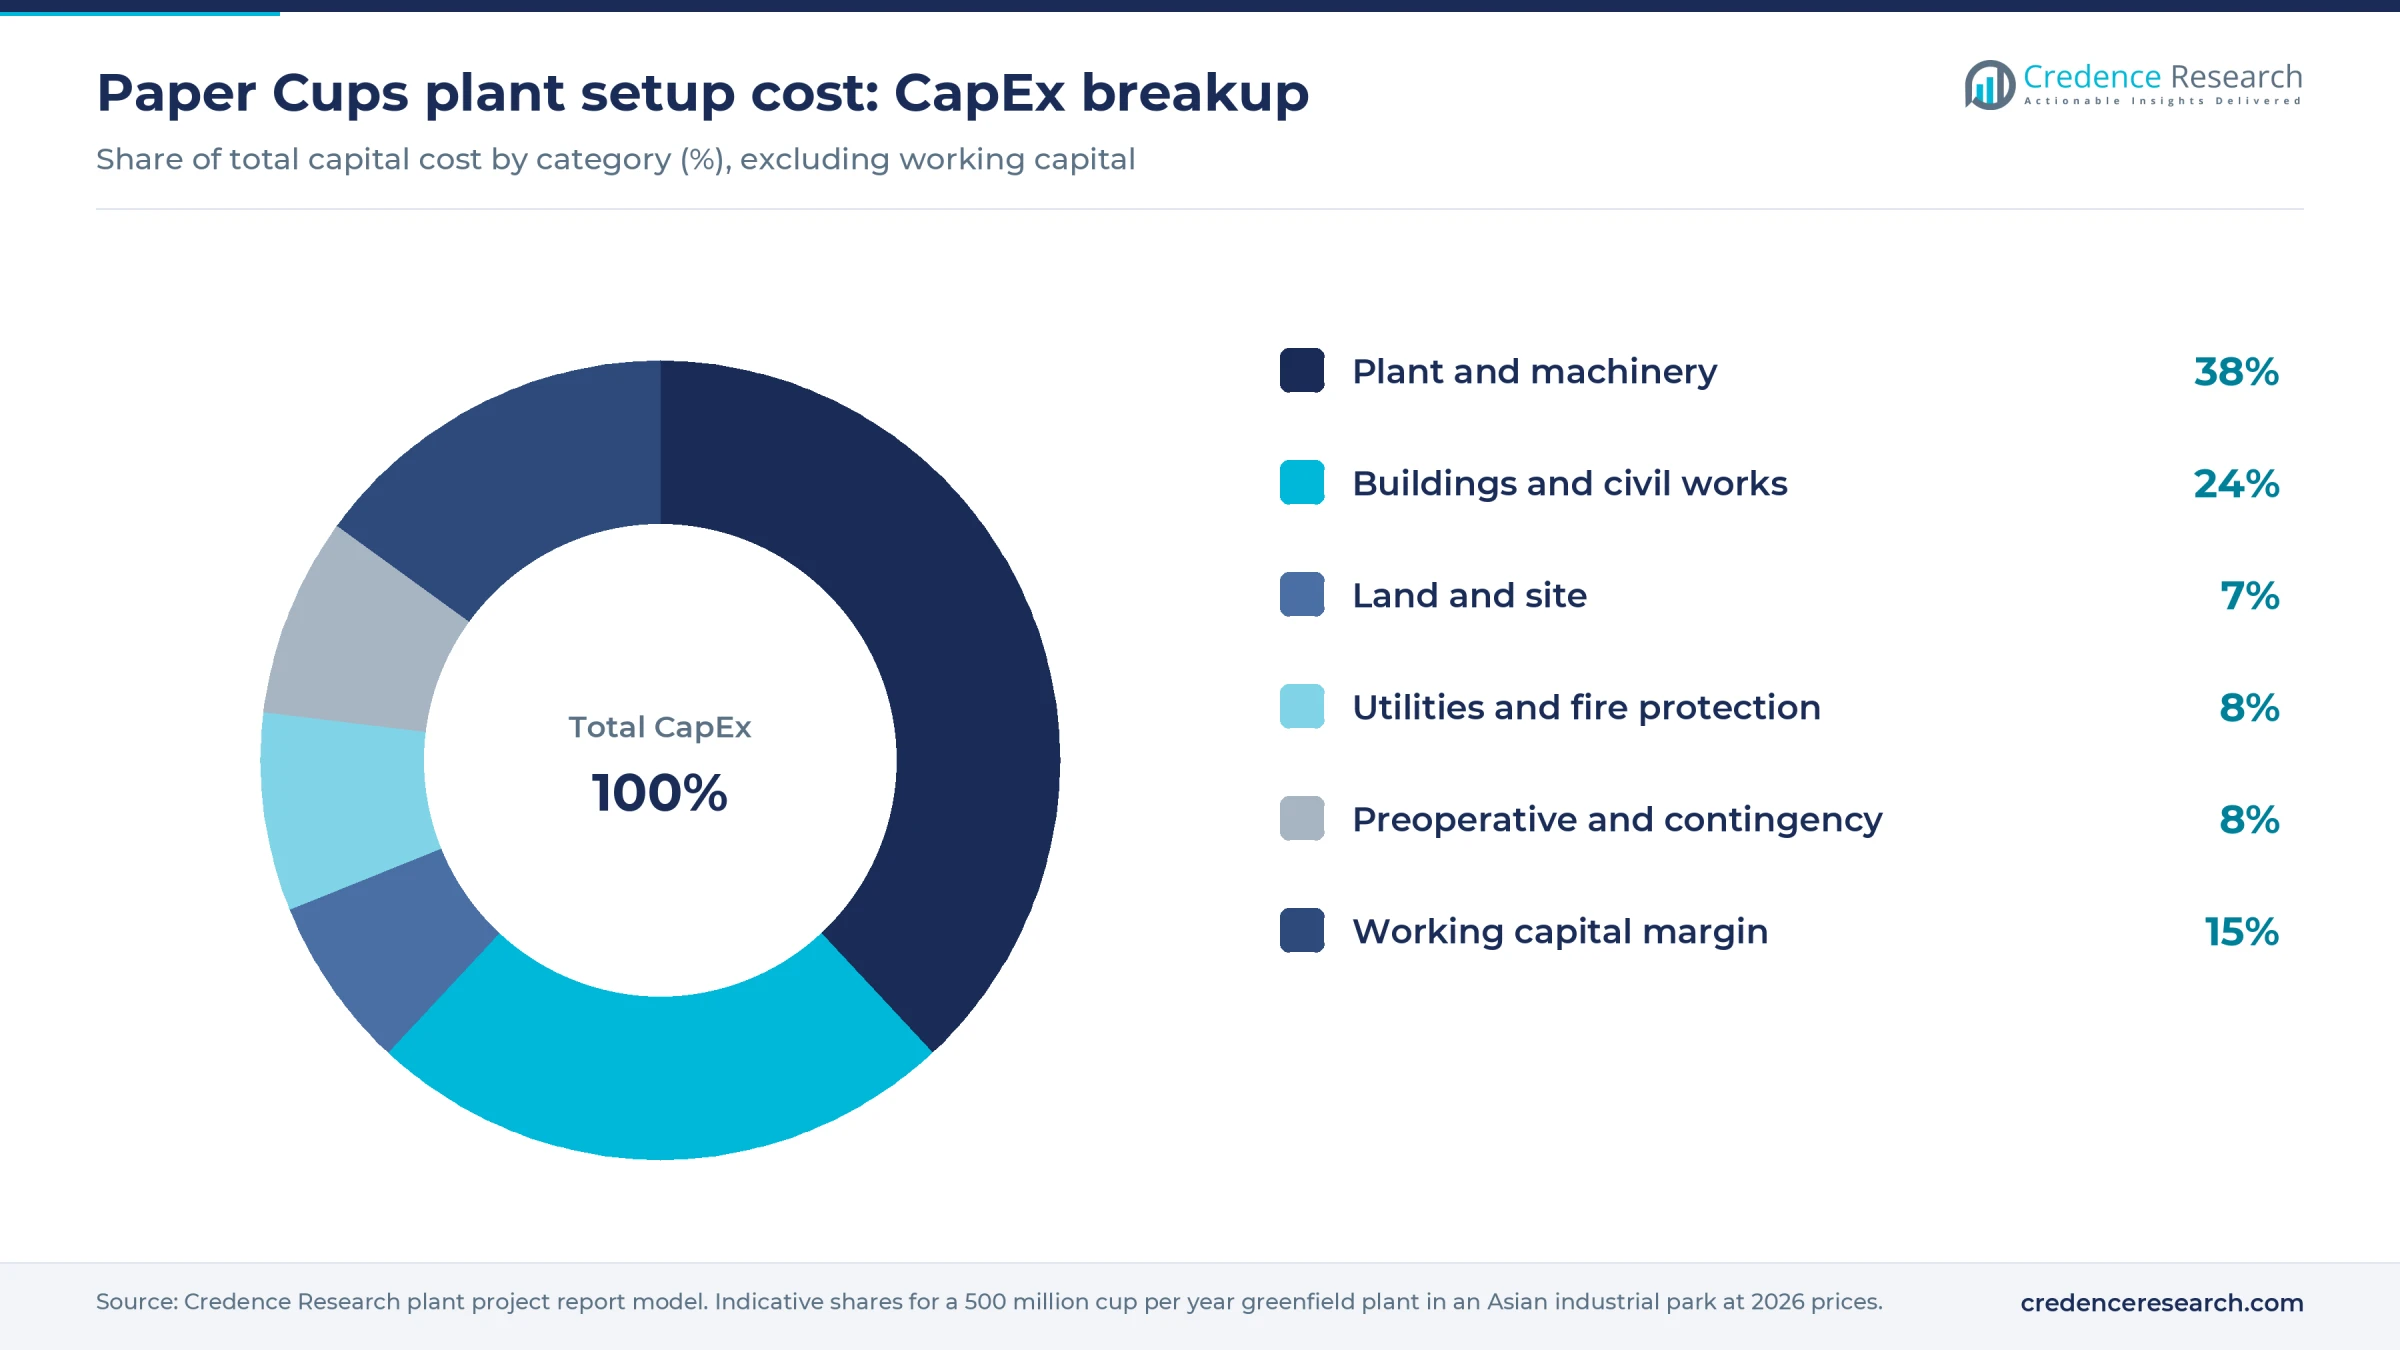
Plant and machinery take about 38% of CapEx, and buildings about 24%, because finished cups occupy far more storage space than their weight suggests. Working capital is unusually important, since reels are bought in container lots and chain customers often pay on long terms.
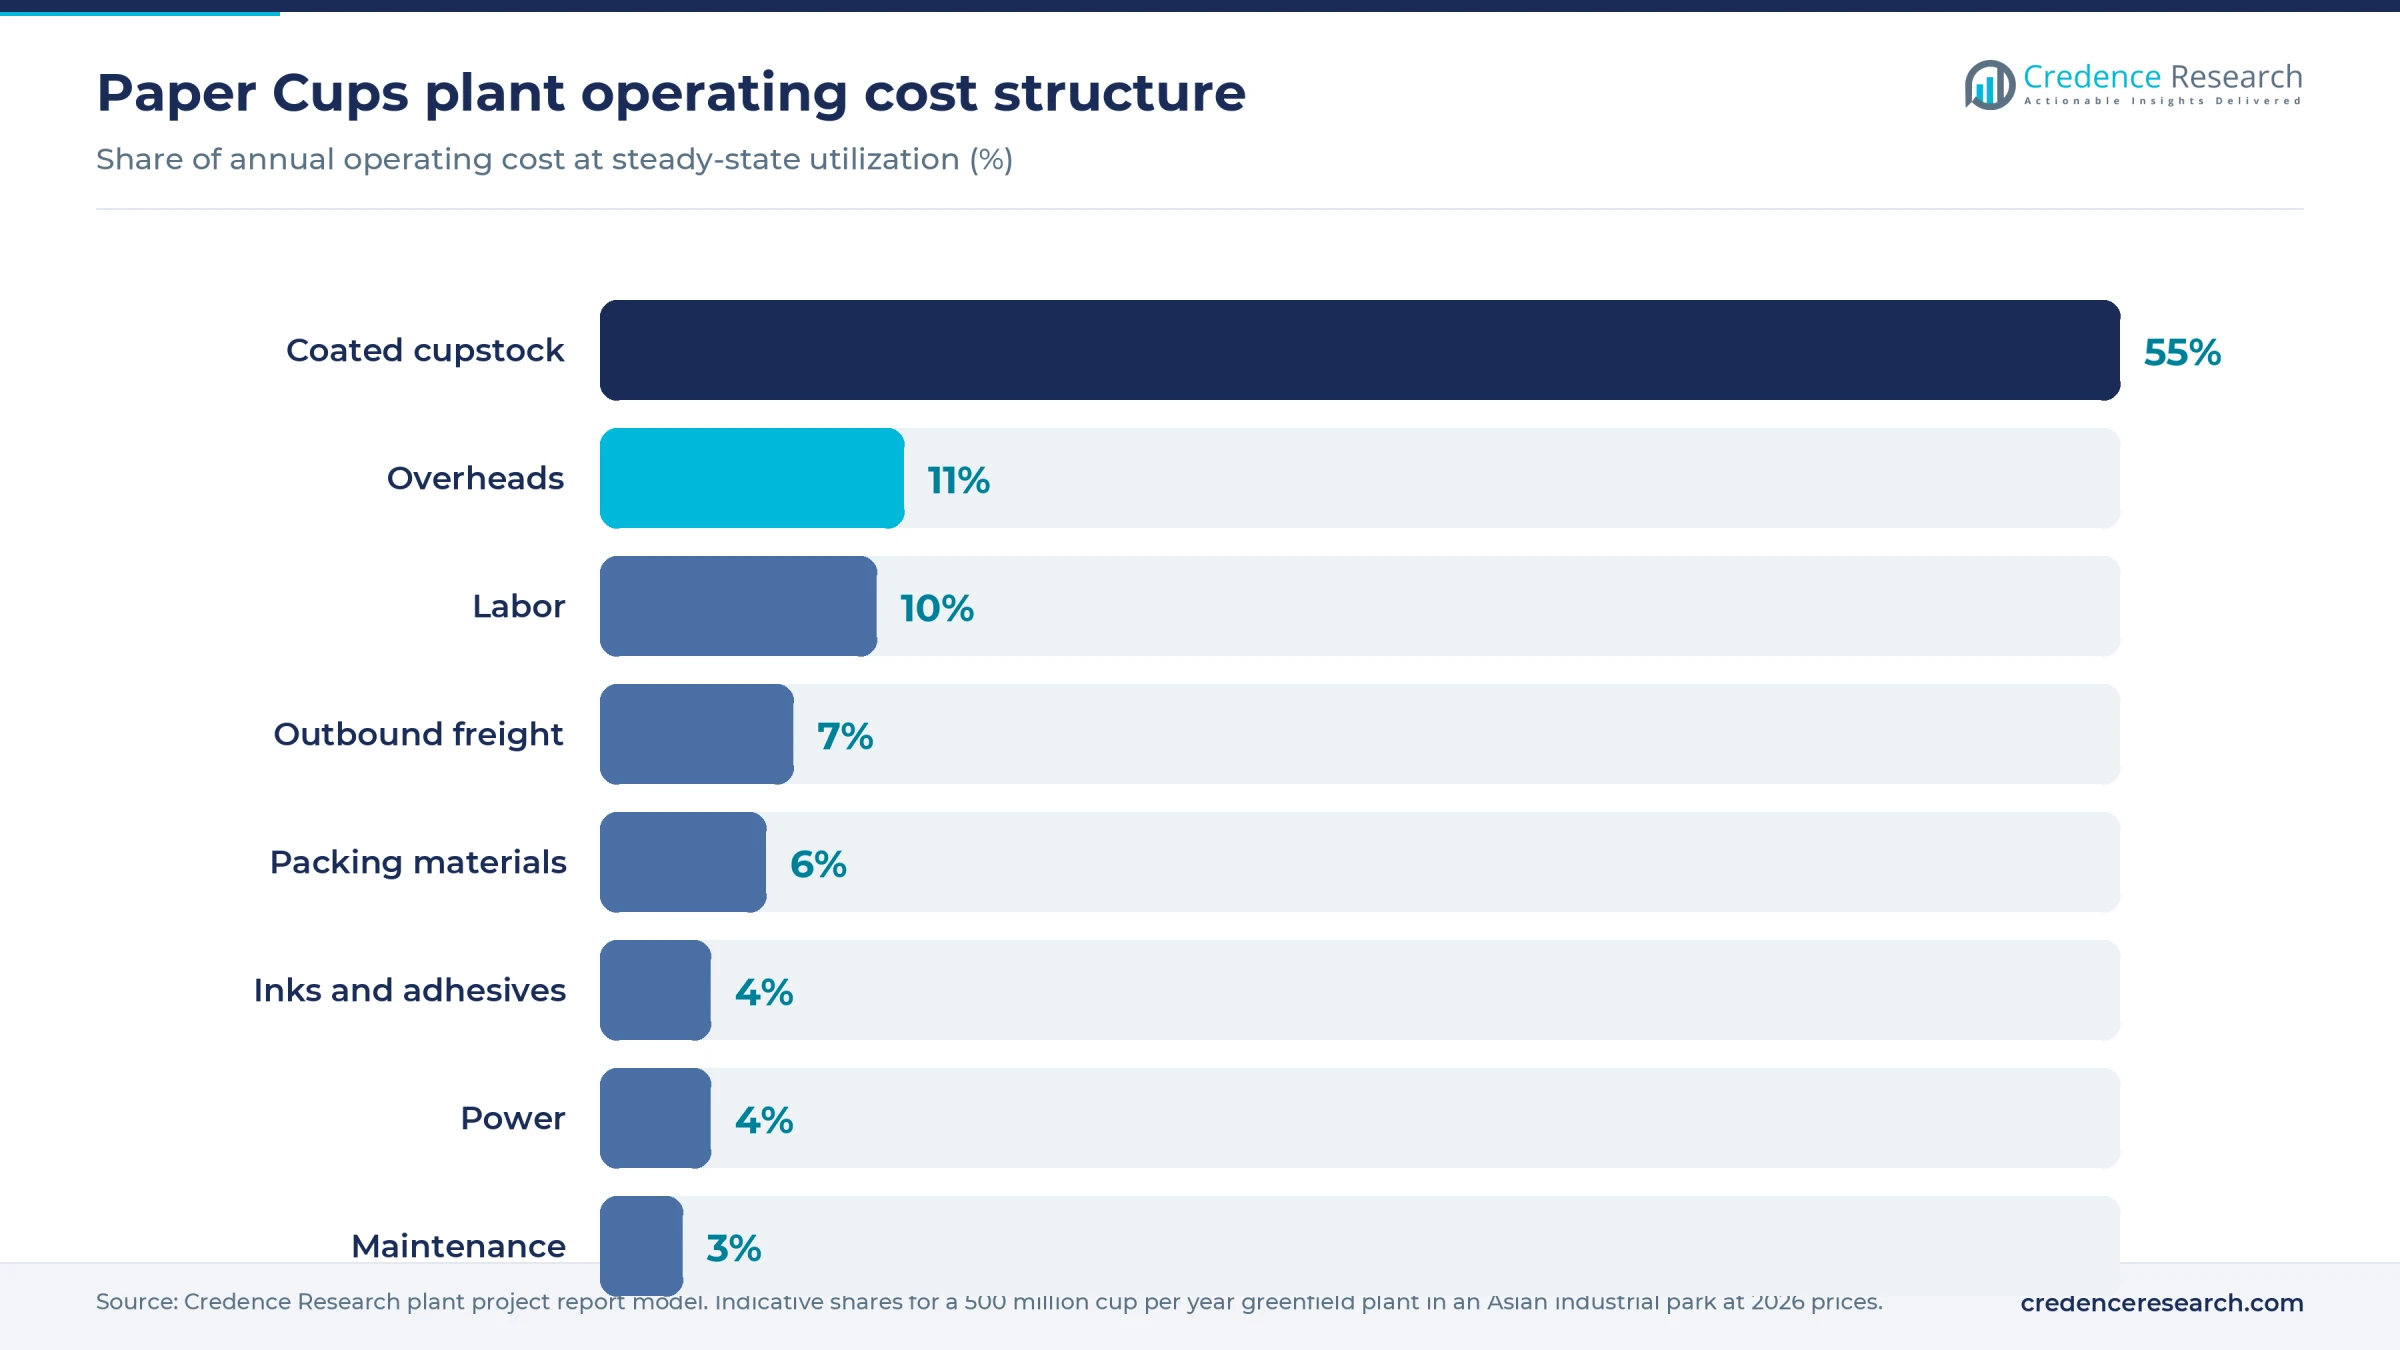
Operating cost is led by coated cupstock at about 55%, while overheads and labor are the next largest lines. Cost shares change in high-wage markets, where automated packing usually earns its added capital.
Machinery and raw materials for a paper cups plant
The main equipment groups are listed below; makes, speeds and the costed schedule are in the report.
- Reel handling and slitting
- Flexographic presses with plate-making and ink management
- Rotary or platen die cutters with waste extraction
- Cup forming machines with hot-air or ultrasonic sealing
- Double-wall or ripple sleeve machines for insulated cups
- Vision inspection, leak testers, counting and sleeve packers
- Compressors, chillers, dust extraction, trim balers and fire protection
Cupstock comes from integrated board mills in Scandinavia, North America, China, India, South Korea and Japan, with coating sometimes done by separate extrusion converters. Wood fiber supply ties those mills to the forest regions of Northern Europe, the U.S., Canada and South America. Polyethylene resin comes mainly from the Middle East, the U.S. and Asia, and PLA from a small group of producers in the U.S. and Asia. Printing inks are sourced from global ink makers with regional plants.
Board security is the largest supply risk. The reference plant uses about 3,600–4,250 metric tons of coated board a year, so a two-mill qualification policy is advisable. Food-contact declarations must cover each layer of the sheet, and changing coatings often means new sealing trials and customer approvals, which limits switching at short notice.
Paper cups business profit margin and ROI
Gross margin for the reference plant is estimated at 20–30%, measured as delivered price minus materials and direct conversion cost. The build uses an assumed mid-market price of about USD 0.027 per 8 oz-equivalent single-wall cup, in line with a published Asian factory range of USD 0.022–0.028 for unprinted 8 oz cups plus delivery. Board prices of USD 1,100–1,620 per metric ton, seen in published Asian and Indian offers, together with assumed conversion and delivery costs, set the margin; the per-cup build is in the report. The Uttar Pradesh project profile, built for a far smaller Indian unit, shows a broadly similar 23–25%.
At 85% utilization, about 425 million cups a year, annual cash profit after assumed overheads comes to about USD 1.3–2.4 million, which puts payback at about 3–5 years on mid-range CapEx of about USD 7 million.
Sensitivity runs through board cost and print mix. A rise in board price cuts margin quickly on plain stock cups, while branded cups usually carry a better margin and longer contracts. Water-based barrier grades raise material cost, so they only help where buyers pay for compliance.
| Metric | Value |
|---|---|
| Gross margin | 20–30% |
| Payback period | 3–5 years |
| IRR (post-tax) | Available in report |
| NPV | Available in report |
| Return on investment | Available in report |
| DSCR | Available in report |
| Break-even utilization | Available in report |
How to start a paper cups business with licenses and approvals
Most jurisdictions follow a similar path: register the business and tax accounts, secure land use and building permits, obtain any environmental permit covering printing emissions and waste, comply with factory and occupational safety rules, and document food-contact compliance for every material. Chain customers usually add hygiene audits and chain-of-custody certification such as FSC or PEFC, and exporters need import-export registration. Because a paper cup touches food, buyers ask for a declaration of compliance covering board, coating and inks. Single-use rules affect product design as well as paperwork, so they should be checked for each target market before coatings are chosen.
| Market | Food contact and product rules | Plant and environmental permits |
|---|---|---|
| United States | FDA food-contact rules, including 21 CFR 176.170 for paper and paperboard components; no FDA license for the cup itself | State air permit where press emissions require it, local zoning and building permits, OSHA workplace rules |
| European Union | Regulation 1935/2004 and good manufacturing practice Regulation 2023/2006; Regulation 2020/2151 marking for beverage cups made partly from plastic; Packaging Regulation 2025/40, including PFAS limits from August 2026 | National environmental and building permits, national workplace safety law |
| India | FSSAI Food Safety and Standards (Packaging) Regulations, 2018, which refer to Indian Standards for paper and paperboard; state rules on plastic-coated disposables should be checked locally | State Pollution Control Board Consent to Establish and Consent to Operate, factory registration, Plastic Waste Management Rules obligations where they apply |
Key paper cups manufacturers and recent developments
Global and regional makers include Huhtamaki (Finland), Dart Container and Georgia-Pacific's Dixie brand (United States), Novolex, including Eco-Products (United States), Graphic Packaging (United States), Seda International Packaging Group (Italy), Benders paper cups (United Kingdom), Detpak (Australia) and Hotpack (United Arab Emirates). Regional printers serve most local coffee chains, and that fragmentation leaves room for a focused entrant.
Recent moves show that competition is shifting to barrier materials and plastic content, reflected in growing interest in PFAS-free food packaging:
- March 2026: Board maker Lecta extended its EraCup Natural water-based barrier board, developed for paper cups, to bowls and trays.
- May 2026: Huhtamaki said Finnish chain Hesburger had begun switching to its fiber-based drink lids, a sign that chains now look beyond the cup itself.
- June 2026: Novolex brand Eco-Products redesigned its World Art compostable hot and soup cups on FSC-certified paperboard, according to Packaging Insights.
What's inside the Paper Cups project report PDF
The report runs to 21 chapters. Open a chapter to see its sections.
1. Preface
2. Scope and Methodology
- 2.1 Objectives of the Study
- 2.2 Stakeholders
- 2.3 Research Methodology
- 2.4 Data Sources and Key Assumptions
3. Executive Summary
- 3.1 Market Snapshot
- 3.2 Project at a Glance (Capacity, CapEx, OpEx)
- 3.3 Key Financial Indicators (IRR, NPV, Payback, Break-even)
- 3.4 Feasibility Verdict
4. Product Overview
- 4.1 Paper Cups Definition and Properties
- 4.2 Grades and Specifications (BIS / ISO / ASTM)
- 4.3 HS Code and Classification
- 4.4 Key Applications
- 4.5 Substitutes
5. Global Paper Cups Market
- 5.1 Market Overview
- 5.2 Historical and Current Market Performance (Volume and Value)
- 5.3 Market Breakup by Grade / Type
- 5.4 Market Breakup by End-Use Industry
- 5.5 Market Breakup by Region
- 5.6 Market Drivers, Restraints and Trends
- 5.7 Value Chain Analysis
- 5.8 Market Forecast
6. Target Country Paper Cups Market Analysis
- 6.1 Demand and Supply Analysis
- 6.2 Installed Capacity vs Demand Gap
- 6.3 Import Dependence
- 6.4 Demand Forecast by End-Use
7. Trade Analysis
- 7.1 Imports by Volume, Value and Country
- 7.2 Exports by Volume, Value and Country
- 7.3 Trade Balance and Opportunities
8. Price Analysis
- 8.1 Historical Paper Cups Price Trends by Region
- 8.2 Raw Material / Feedstock Price Trends and Linkage
- 8.3 Price Forecast
- 8.4 Margins Across the Value Chain
9. Competitive Landscape
- 9.1 Market Structure
- 9.2 Key Players and Installed Capacities
- 9.3 Profiles of Key Players
- 9.4 Recent Developments (Expansions, M&A, New Plants)
10. Manufacturing Process and Technology
- 10.1 Comparison of Technology Routes
- 10.2 Selected Route and Process Flow Diagram
- 10.3 Unit Operations Involved
- 10.4 Chemical Reactions Involved
- 10.5 Mass Balance and Raw Material Requirements
- 10.6 Energy Balance
- 10.7 Quality Assurance Criteria and Technical Tests
- 10.8 By-products and Waste Handling
- 10.9 Technology Licensors / Providers
11. Project Details, Requirements and Costs
- 11.1 Land, Location and Site Development
- 11.1.1 Site Selection Criteria
- 11.1.2 Location Analysis
- 11.1.3 Land Requirement and Costs
- 11.1.4 Site Development Costs
- 11.2 Plant Layout
- 11.2.1 Layout Principles
- 11.2.2 Proposed Layout
- 11.2.3 Factors Influencing Layout
- 11.3 Civil Works and Buildings
- 11.4 Plant Machinery
- 11.4.1 Machinery Requirements and Specifications
- 11.4.2 Machinery Costs
- 11.4.3 Machinery Suppliers
- 11.5 Raw Materials
- 11.5.1 Requirements per Tonne of Output
- 11.5.2 Procurement and Sourcing
- 11.5.3 Costs
- 11.5.4 Suppliers
- 11.6 Packaging
- 11.6.1 Packaging Requirements
- 11.6.2 Packaging Costs
- 11.6.3 Packaging Suppliers
- 11.7 Storage and Material Handling
- 11.8 Transportation Requirements and Costs
- 11.9 Utilities
- 11.9.1 Power Requirements and Costs
- 11.9.2 Water Requirements and Costs
- 11.9.3 Steam, Fuel and Other Utilities
- 11.10 Manpower Requirements and Wages
12. Environment, Health, Safety and Sustainability
- 12.1 Effluent and Emissions Management
- 12.2 Hazard Classification and Safety Measures
- 12.3 Carbon Footprint
- 12.4 Green / Low-Carbon Process Options
13. Regulatory Procedures, Approvals and Certifications
- 13.1 Licences and Registrations
- 13.2 Environmental Clearances
- 13.3 Product Certifications (BIS, REACH, etc.)
- 13.4 Approval Timeline
14. Project Implementation Schedule
15. Project Economics
- 15.1 Capital Cost of the Project
- 15.2 Techno-Economic Parameters
- 15.3 Capacity Utilization and Ramp-up
- 15.4 Product Pricing and Margins
- 15.5 Income Projections
- 15.6 Expenditure Projections
- 15.7 Working Capital Requirement
- 15.8 Taxation
- 15.9 Depreciation
16. Financial Analysis
- 16.1 Projected Profit and Loss Account
- 16.2 Projected Cash Flow Statement
- 16.3 Projected Balance Sheet
- 16.4 Liquidity Analysis
- 16.5 Profitability Analysis (Payback, NPV, IRR, ROI)
- 16.6 Break-even Analysis
- 16.7 Debt Service Coverage Ratio (DSCR)
- 16.8 Sensitivity Analysis
- 16.9 Scenario and Uncertainty Analysis
17. Funding and Incentives
- 17.1 Means of Finance and Debt-Equity Structure
- 17.2 Loans and Financial Assistance
- 17.3 Government Schemes and Subsidies (PLI, State Policies)
18. Risk Assessment
- 18.1 Key Success Factors
- 18.2 Key Risk Factors
- 18.3 Risk Mitigation
19. Strategic Recommendations
20. Case Study of a Successful Venture
21. Appendix
- 21.1 Detailed Assumptions
- 21.2 Abbreviations
- 21.3 List of Tables and Figures
- 21.4 Sources
This page vs. the full report
| Data point | On this page (free) | In the full report |
|---|---|---|
| Total CapEx | One rounded range at one capacity | Exact figure at three capacities with a line-item breakup |
| CapEx breakup | Category shares (%) only | Cost, quantity and supplier for every machine |
| Operating cost | Share of raw materials, utilities and labor | Per-unit cost sheet with each input price and consumption |
| Profitability | Gross margin range and payback band | Exact IRR, NPV, ROI, break-even and DSCR |
| Financial statements | List of what is included | 10-year P&L, cash flow, balance sheet and Excel model |
| Sensitivity | One directional line | Full sensitivity and scenario tables |
| Process | Simplified flow diagram | Detailed process flow, mass and energy balance, operating conditions |
| Machinery | Names of the main machines | Specifications, capacity, cost and supplier list |
| Market | Headline size, growth and India demand trend | Segment, region, trade and price forecast tables |
| Suppliers and buyers | Supplier types and sourcing hubs | Named suppliers and buyers |
Paper Cups project report: FAQs
How much does it cost to set up a paper cups manufacturing plant?
What is the profit margin in paper cup manufacturing?
How long is the payback period for a paper cup plant?
What raw materials does a paper cup plant need?
What is the HS code for paper cups?
Are plastic-lined paper cups still allowed in the European Union?

About the analyst
Rajdeep Kumar Deb, Lead Analyst - Consumer & Finance
Rajdeep brings a decade of consumer goods and financial services insight to strategic market analysis.
Related market research
- Paper Cups Market Size, Growth, Share and Forecast 2032
- Paperboard Packaging Market Size, Growth and Forecast 2032
- Paperboard Market Size, Share, Trends, Growth and Forecast 2032
- PFAS Free Food Packaging Market Size, Growth and Forecast 2032
- Biodegradable Food Packaging Market Size, Share & Growth Report 2032
- Japan Paper Cups Market Size, Share and Forecast 2032
More plant project reports
- Cigarette Manufacturing Plant Project Report (DPR) 2026
- Ceiling Fan Manufacturing Plant Project Report (DPR) 2026
- Avocado Oil Processing Plant Project Report (DPR) 2026
- Aluminium Cans Manufacturing Plant Project Report (DPR) 2026
- Aloe Vera Gel Manufacturing Plant Project Report (DPR) 2026
- Shrimp Processing Plant Project Report (DPR) 2026