
Quick answer
Perfume is a blend of fragrance concentrate, ethanol and water, matured, chilled, filtered and filled into spray bottles. A greenfield plant filling 6 million bottles a year needs an estimated USD 8–30 million of CapEx, excluding working capital. Private-label and mid-market makers can expect a gross margin of about 30–45%, with payback in about 4–8 years. Packaging, not liquid, is the largest cost.
Feasible for a filler with secured brand or private-label contracts; speculative capacity without customers is the main way this project fails.
Perfume plant: key highlights
| Parameter | Indicative value | Note |
|---|---|---|
| Plant capacity | 6 million bottles per year | 50–100 ml sizes, about 450,000 liters of finished perfume, 250 operating days |
| Total CapEx | USD 8–30 million | Greenfield, excluding working capital; a luxury-house build can run higher |
| Raw material share of operating cost | 55–70% | Includes concentrate, ethanol and packaging components |
| Gross margin | 30–45% | At an assumed ex-factory USD 3–6 per bottle |
| Payback period | 4–8 years | From commissioning, including ramp-up and customer qualification |
| IRR | Available in report | Post-tax, 10-year model |
| Break-even | Available in report | Capacity utilization basis |
Ranges assume 6 million bottles a year (average 75 ml), a representative greenfield site from an Asian industrial park to a U.S. or EU location, 2026 prices, 85% steady-state utilization, an assumed ex-factory price of USD 3–6 a bottle and EUR at an assumed USD 1.15. Scaled from disclosed plants with a 0.65 capacity exponent. Excludes working capital and brand marketing. The full report can be customized to any country or region.
What is perfume?
Perfume is a scented liquid made by dissolving a fragrance concentrate in high-purity ethanol, usually with a little demineralized water. The concentrate, a formula that can hold dozens of natural and synthetic aroma materials, is what gives a scent its character. Most of the liquid in the bottle is alcohol.
Grades are set by trade practice rather than by a single global law. Eau de parfum typically carries about 15–20% concentrate and eau de toilette about 5–15%, with extrait higher and eau de cologne and body mists lower. Alcohol-free attars and oil perfumes form a separate segment, strong in the Middle East and South Asia.
Internationally, these products fall under HS code 3303.00, perfumes and toilet waters. Aftershave lotions, personal deodorants and hair lotions are classified elsewhere. Buyers are fragrance brands, retailers that commission private labels, and distributors. A plant therefore usually sells a filling service and a finished product against a customer's specification, not simply a commodity liquid.
Perfume market overview and global demand
Global trade offers the clearest public measure of the sector. World exports of perfumes under HS 3303 reached about USD 34.7 billion in 2025, according to World's Top Exports, which lists the International Trade Centre's Trade Map among its sources. France led at about USD 9.1 billion, followed by Spain at USD 5.3 billion, Italy at USD 3.1 billion, the United States at USD 2.1 billion and the United Arab Emirates at USD 1.9 billion. Europe accounted for about 72% of export value and Asia for about 18%.
Those figures show where filling know-how and brands sit, and also how much product is re-exported. The UAE, Singapore and Hong Kong all rank among the top 15 exporters, which partly reflects their role as distribution hubs.
Credence Research does not size finished perfume in a single dedicated report, but it tracks the supply chain around it. Its fragrance concentrates report implies about USD 8 billion in 2025, derived from USD 7.63 billion for 2024 and a 5.29% CAGR. The market for bottles and other perfume packaging stood at USD 3.51 billion in 2024, with a forecast CAGR of 6.53%.
Physical scale is visible at the plant level. L'Oréal said in November 2025 that its Gauchy site in France would reach 200 million bottles a year, and Chanel's Venette plant in France, which began operating in June 2026, is rated at up to 50 million. A 6-million-bottle unit is small against these sites, so it competes on flexibility, short runs and cost, not on volume. Its likeliest customers are smaller brands and retail private labels that cannot justify a plant of their own.
Perfume manufacturing process
Unlike most chemical manufacturing, a perfume plant involves no reaction at the filling stage. The process is a sequence of careful dosing, aging, clarification and packing, and quality is mostly decided by formula accuracy and contamination control.
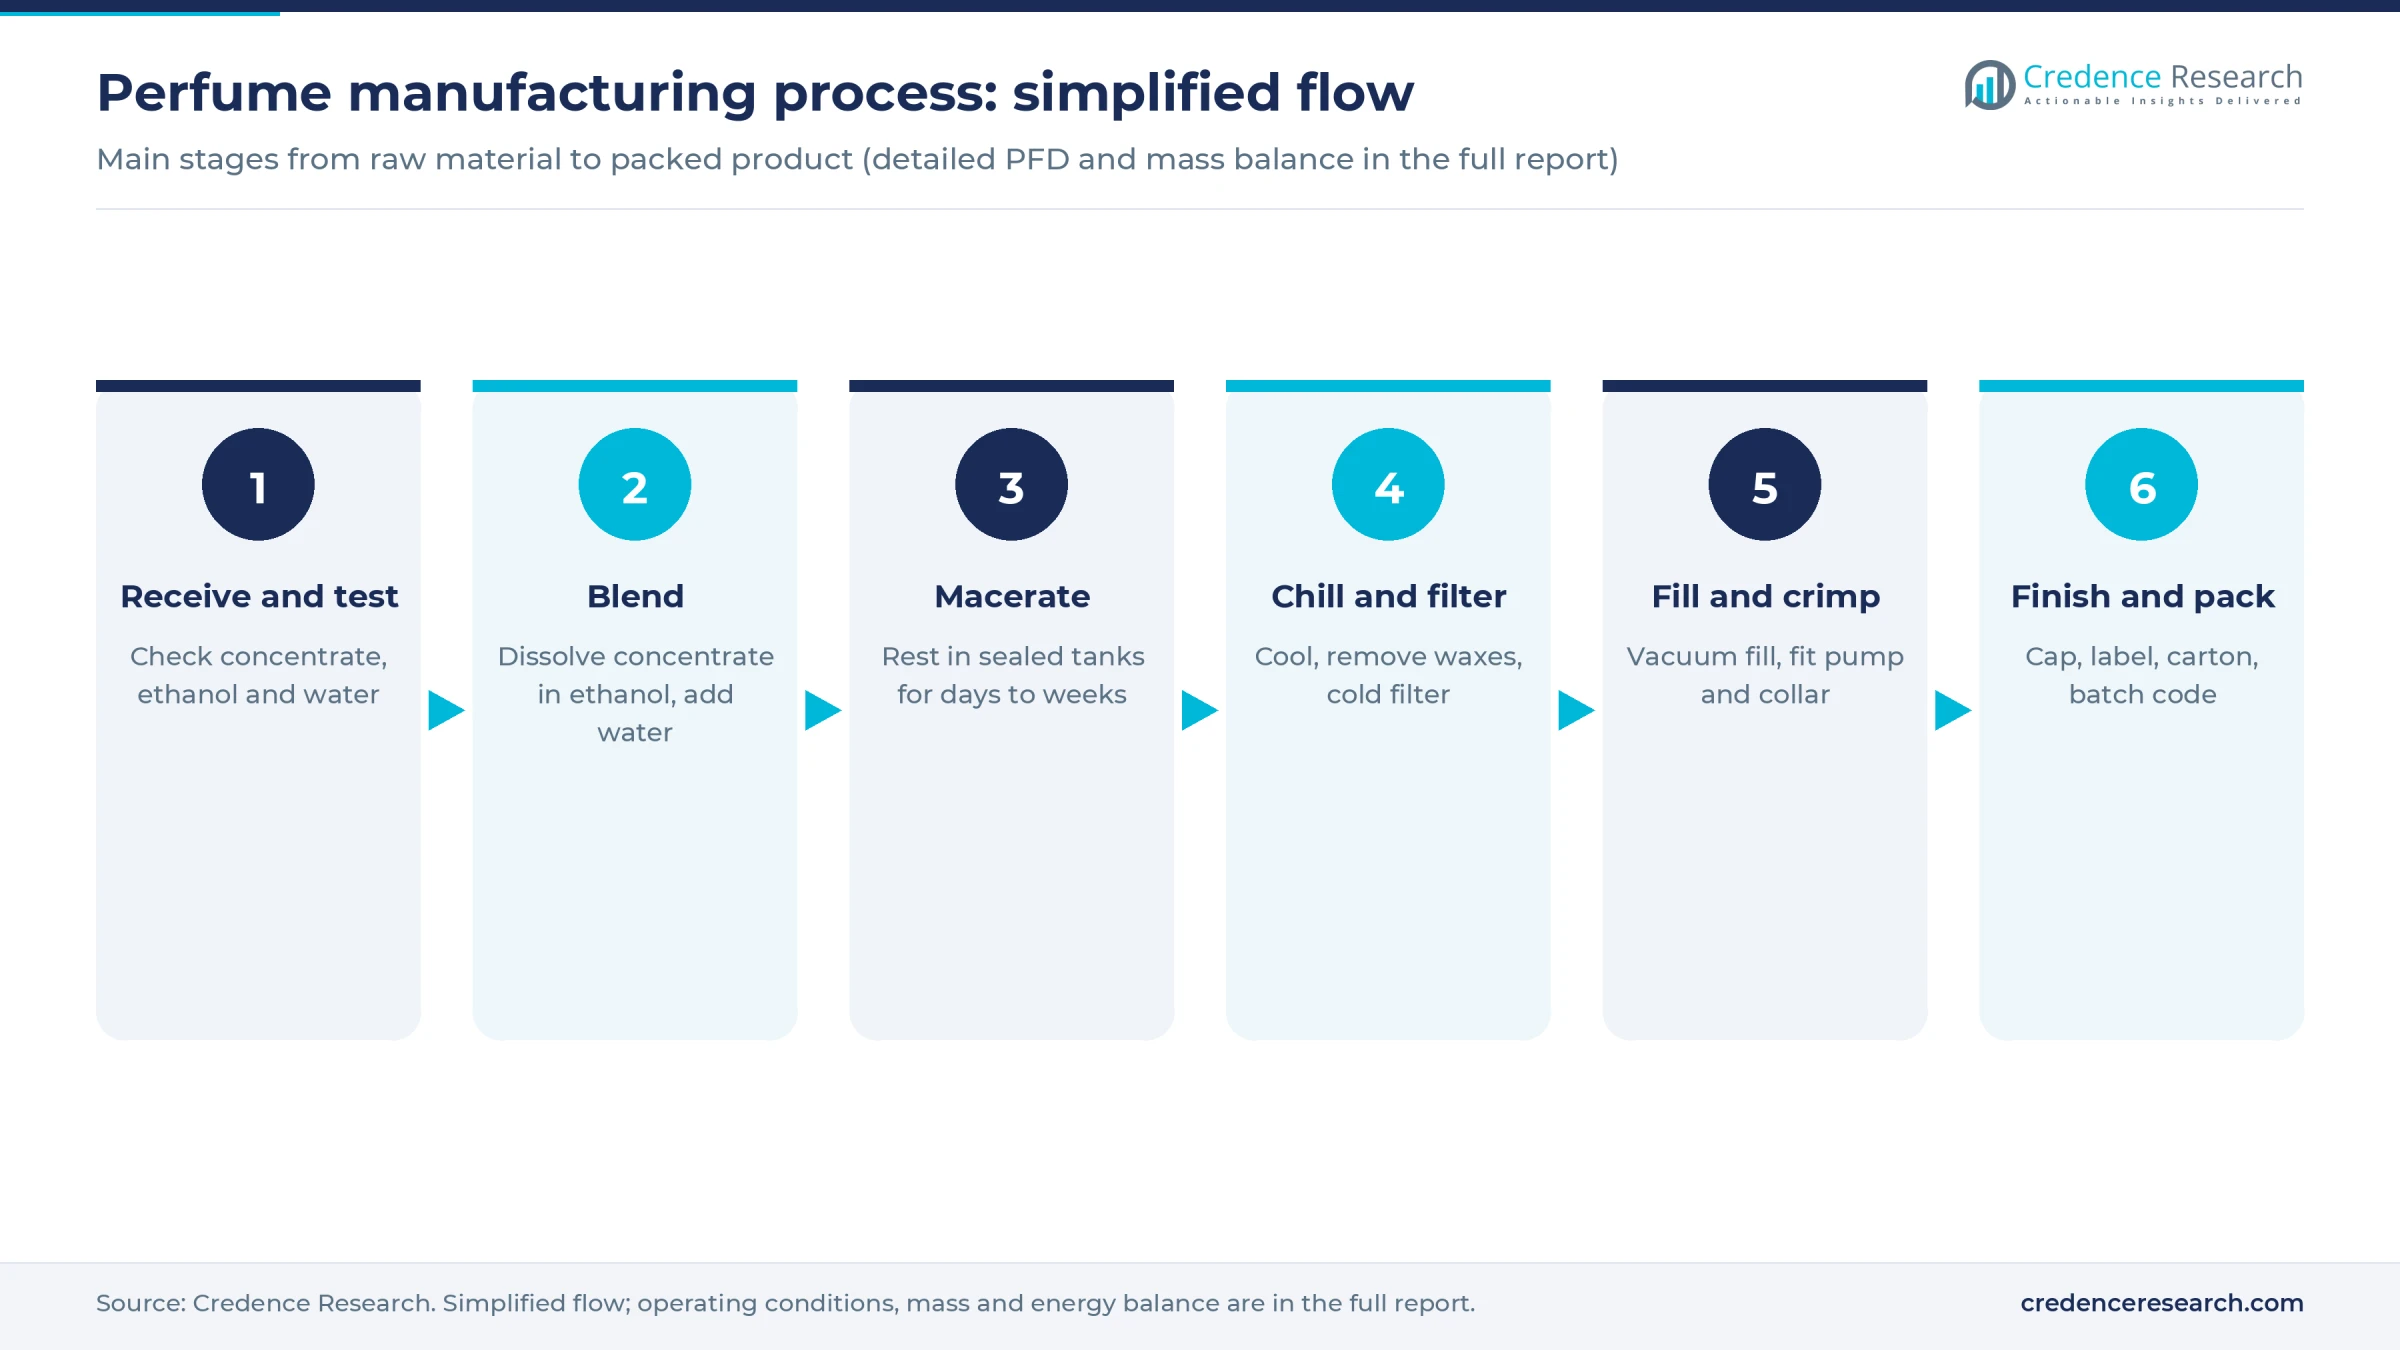
- Receiving and testing. Concentrate, ethanol and water are checked by identity, odor and, often, gas chromatography. Water is deionized or treated by reverse osmosis, because mineral traces can cloud the finished liquid.
- Compounding. If the plant makes its own concentrate, aroma materials are weighed in sequence by formula. Most mid-sized fillers buy it ready-made from a fragrance house, protecting formulas and reducing the capital needed.
- Blending. Concentrate is dissolved in ethanol in closed stainless steel vessels, and water is added slowly. Electrical equipment in this area must be rated for flammable vapor.
- Maceration. The blend rests in sealed tanks, generally for days to several weeks, so the scent can round out. Longer maturation ties up tank space and cash, which makes it a real cost decision.
- Chilling and filtration. The liquid is cooled to near or below freezing so waxes and insoluble material drop out, then filtered while cold. Skipping this step risks haze once the product is on a shelf in a cold climate.
- Filling and finishing. Bottles are rinsed, vacuum filled to a set level, and fitted with a crimped pump and a collar. Caps, labels, cartons and film follow, along with batch coding for traceability.
Yield losses are small but costly. Evaporation, line flushing and rejected glass all fall directly on margin, since the bottle and pump can cost more than the liquid. Plants serving many brands also lose time to changeovers, as lines must be cleaned between scents to avoid carryover. Finished perfume travels as a flammable liquid, so dangerous-goods packing and labeling are part of the shipping routine.
Perfume plant setup cost
This overview models a filling plant with outside-sourced concentrate, making 6 million bottles a year at an estimated CapEx of USD 8–30 million. The range is wide because a basic blending and filling hall in a low-cost park shares little with a highly automated international-standard building.
Disclosed plants frame the range. Ajmal's Dubai facility was reported at about USD 8.1 million for 50,000 bottles a day in January 2004, while an earlier company statement gave AED 17.5 million for 8 million units a year. Each scales and escalates to about USD 8 million at this capacity. L'Oréal's EUR 60 million Gauchy expansion, which doubles output to 200 million bottles, scales to about USD 11 million, but it adds to an existing site. At the top, Chanel's EUR 150 million Venette plant scales to about USD 43 million, reflecting a luxury specification that lies beyond this model. Assumed building and equipment estimates support the USD 8–30 million span.
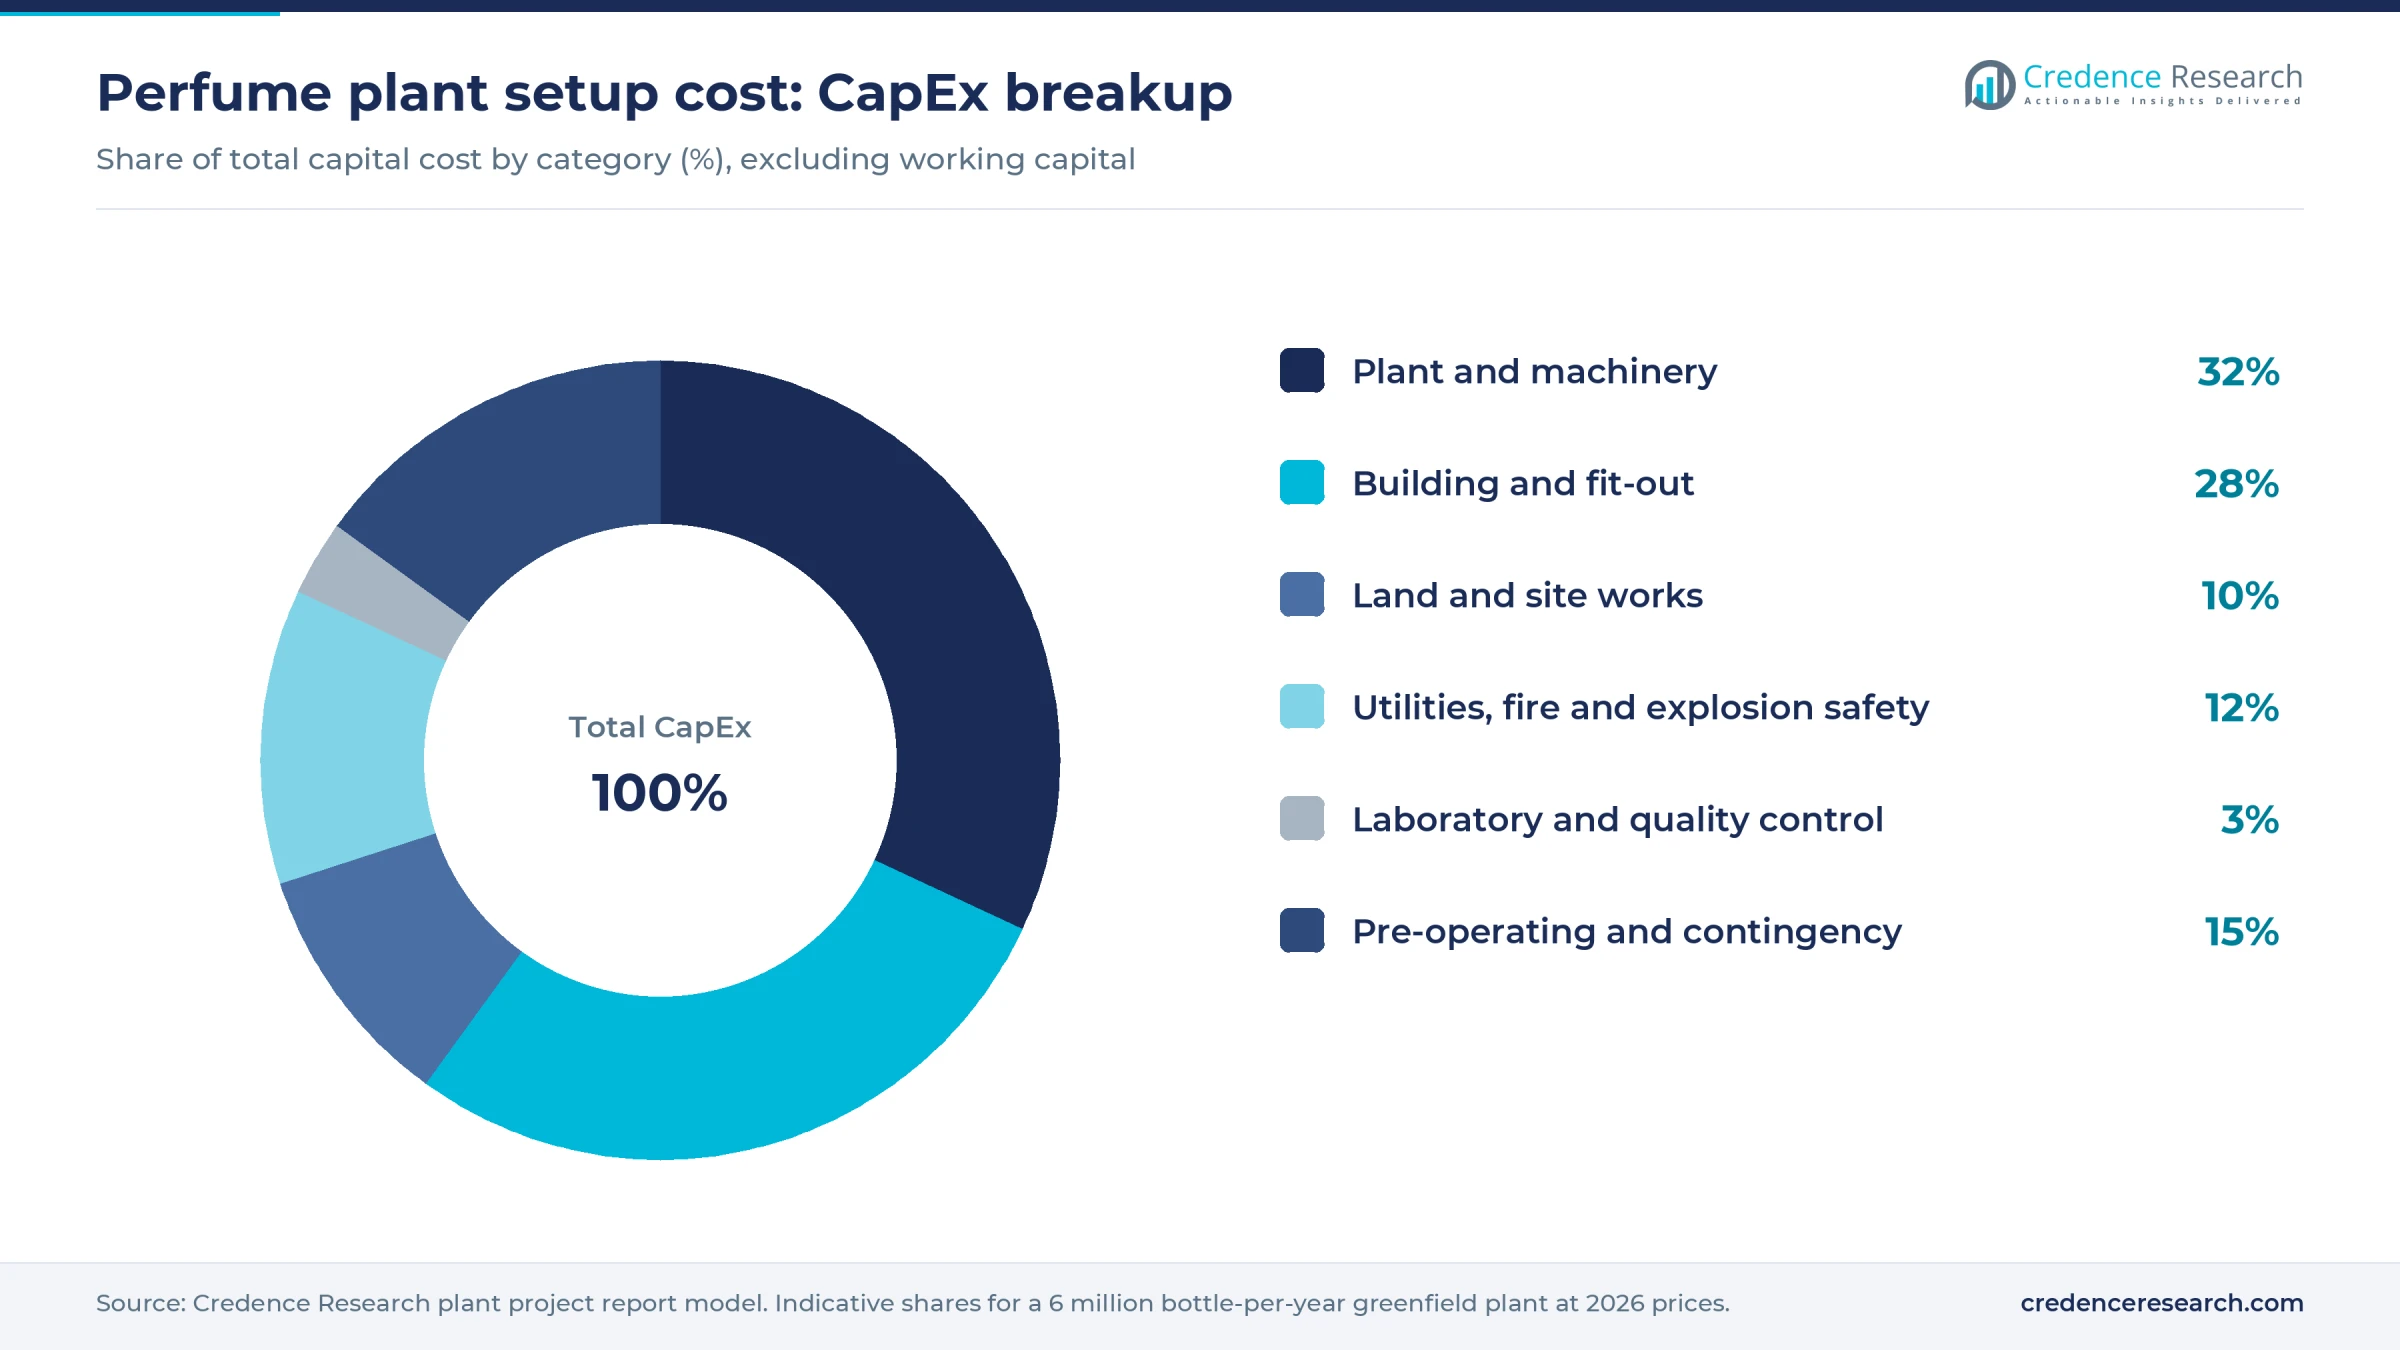
Worked example, land and site development. The model uses an assumed 10,000–14,000 square meters, leaving separation around ethanol storage. At an assumed USD 30–80 per square meter in an Asian industrial park, the plot costs about USD 0.3–1.1 million, and at an assumed USD 60–250 at a U.S. or EU site, about USD 0.6–3.5 million. Site works add an assumed USD 0.3–1 million, so this row is about 8–15% of CapEx.
Working capital is separate, and large. Glass and pump orders with long lead times, maturing stock and about 60 days of receivables tie up an estimated USD 4–8 million.
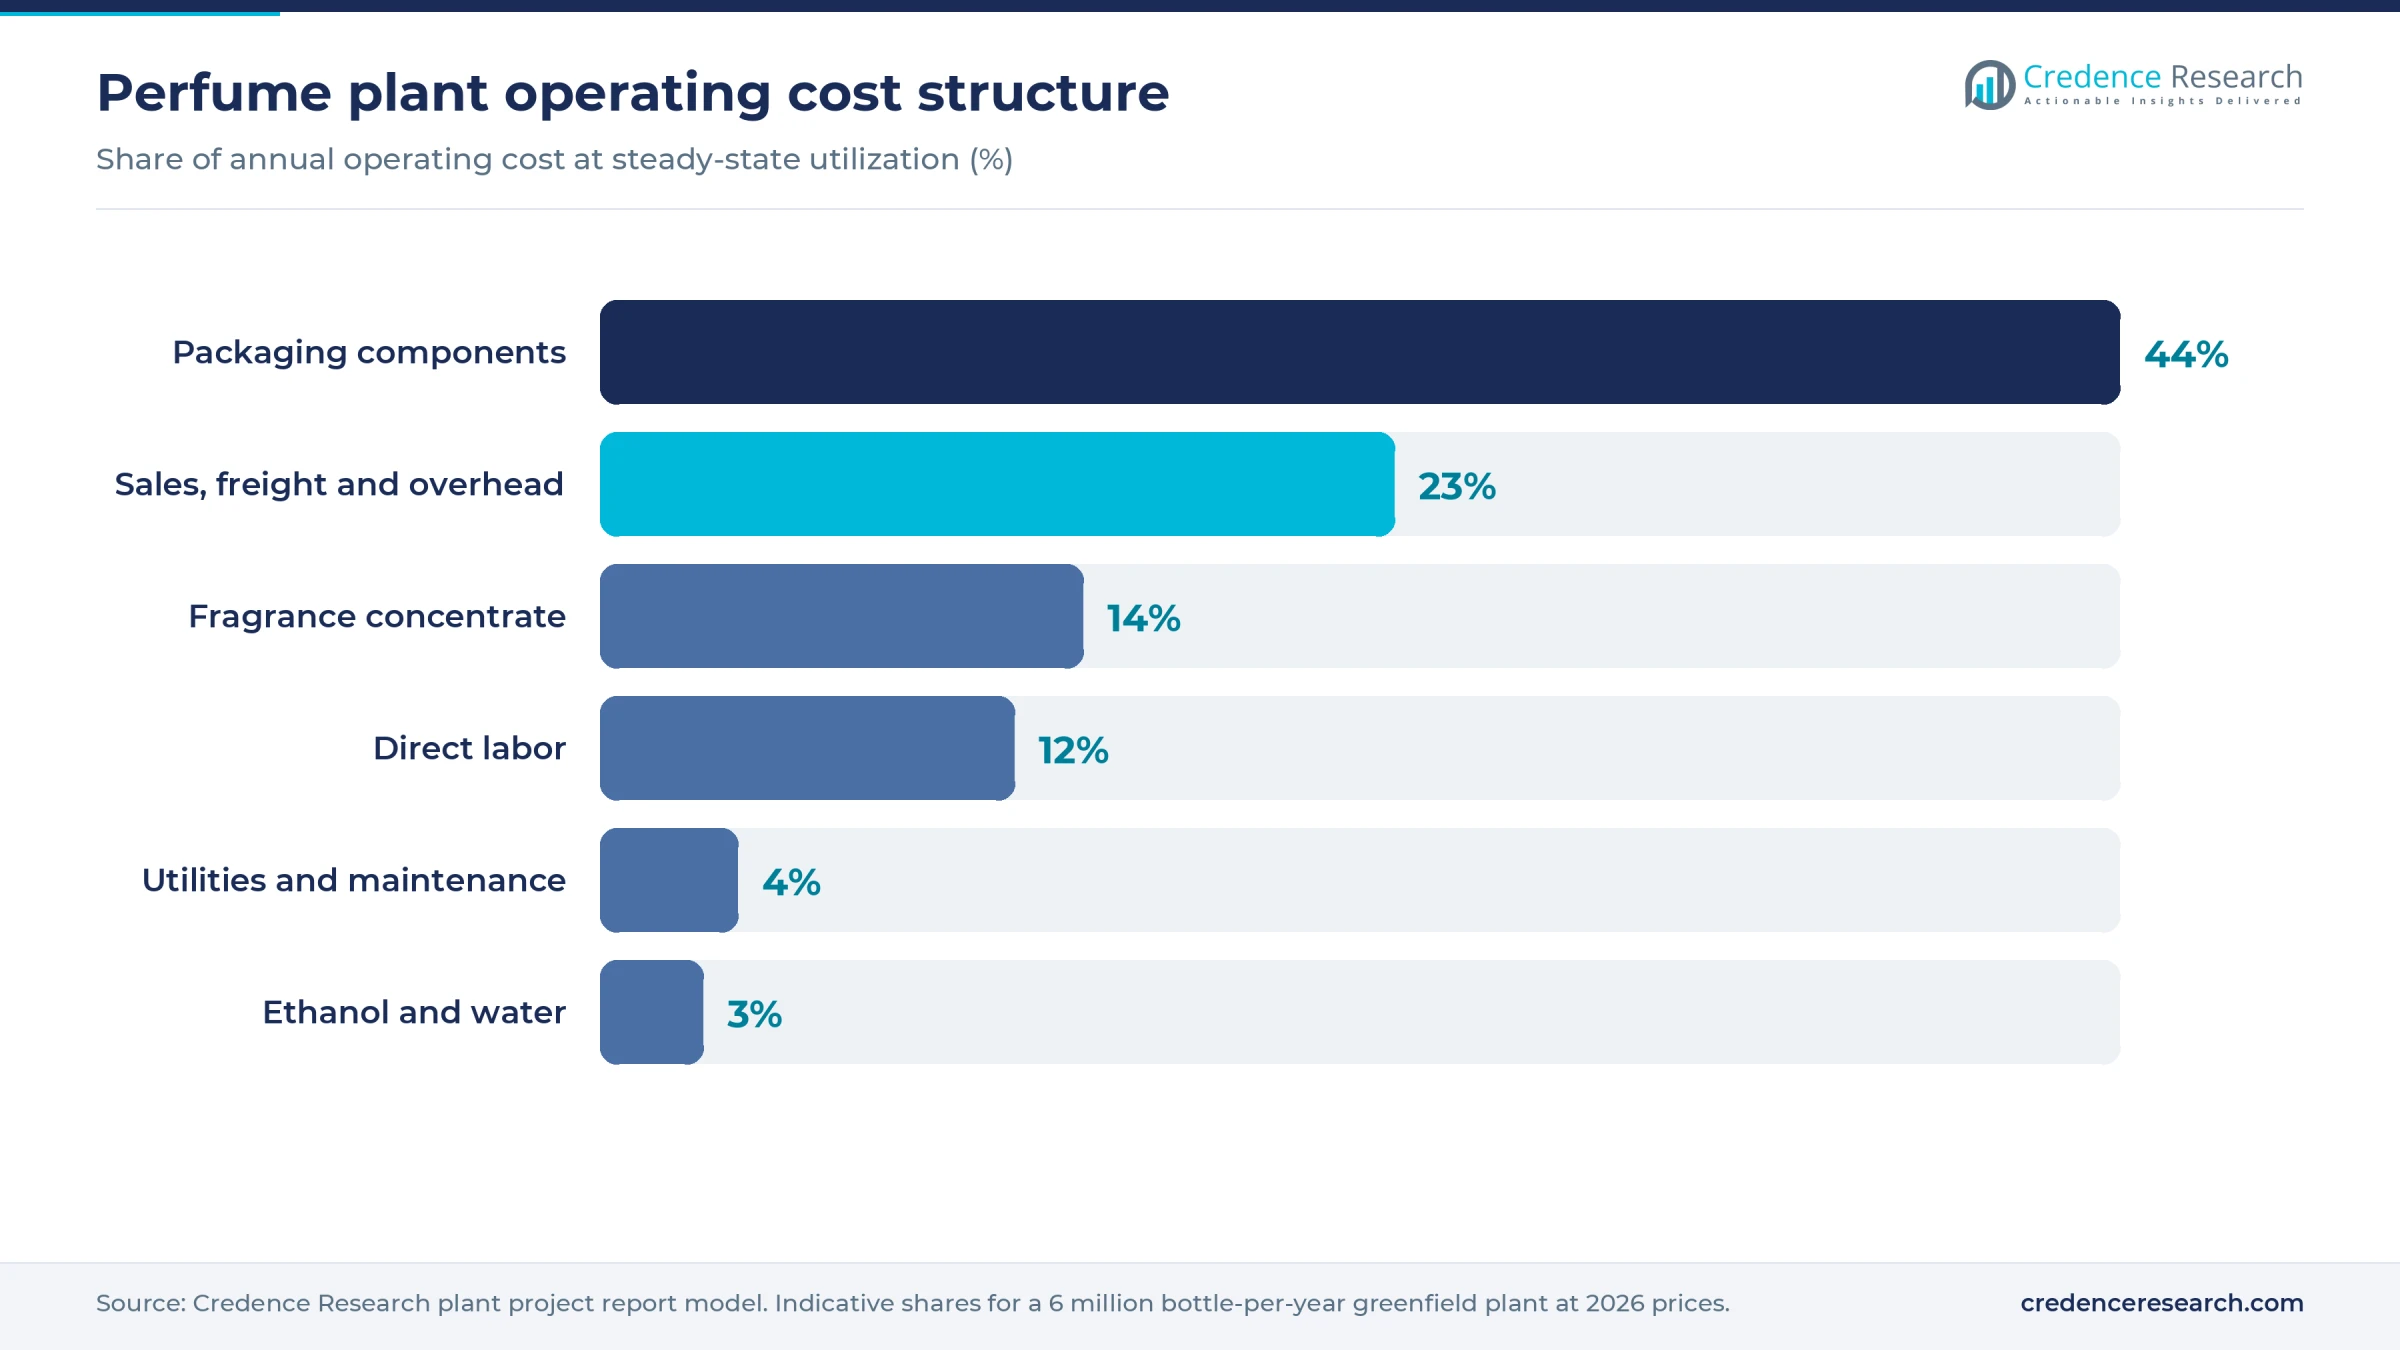
Packaging is the largest operating cost. A 10% rise in packaging prices takes about 3 points off gross margin at a mid-range selling price. The full report can be customized to any country or region.
Machinery and raw materials for a perfume plant
The core equipment list comprises ethanol storage tanks with bunding and vapor control, closed stainless steel mixing vessels, maceration tanks, a chiller and cold filtration skid, and a water treatment unit. Packing needs bottle rinsers, vacuum fillers, pump crimpers, collar and cap presses, labelers, carton and film wrappers, and coding systems. A laboratory holds gas chromatography and density and alcohol testers. Explosion-rated wiring, ventilation and fire suppression are not optional extras in the blending area.
Raw materials come from a wide map. Ethanol is commonly fermentation-based, with Brazil, the United States and India among the large producing countries, and perfumers usually prefer a neutral, highly purified grade, as covered in Credence Research's high-purity ethanol analysis. Concentrates are compounded by fragrance houses clustered in Europe, the United States and Asia.
Natural materials are concentrated by origin. Indonesia supplies most patchouli, Madagascar dominates vanilla, Bulgaria and Turkey are known for rose, Haiti and India for vetiver, and Southeast Asia for oud. Harvest swings move these prices sharply, which is one reason formulas increasingly rely on synthetics. Packaging sourcing also varies by brand. Interparfums, for example, reports components made mainly in France, the United States and Italy, with occasional third-party manufacturing in China, Poland and Turkey.
Perfume business profit margin and ROI
Margins depend on which business the plant is really in. At the modeled private-label and mid-market position, with an assumed ex-factory price of USD 3–6 per bottle and an assumed USD 1.60–3.50 of materials and direct conversion, gross margin runs about 30–45%. A private pre-feasibility study for a small unit in Kannauj, India, shows a similar pattern, at about 38% before conversion costs.
Brand owners earn far more on paper but carry the marketing. Interparfums, which owns no factories and uses third-party fillers, reported gross margins of 66.1% in its European operations and 58.3% in its U.S. operations for 2025. That gap is the price of a brand, not a filling advantage, and advertising absorbs much of it.
At 85% utilization, the plant sells about 5.1 million bottles. Estimated post-tax cash generation of about USD 3–6.5 million supports a payback of about 4–8 years, including about 18 months of ramp-up and customer qualification. A top-of-range build sold at the low-end price would not reach payback inside that window, so capital should follow confirmed contracts. Main risks are a lost anchor client, glass cost increases and slow changeovers.
| Metric | Value |
|---|---|
| IRR | Available in report |
| NPV | Available in report |
| ROI | Available in report |
| DSCR | Available in report |
How to start a perfume business, licenses and approvals
A perfume plant needs approvals in six areas in most jurisdictions. These are business and tax registration; land use, zoning and building permits; an environmental permit covering ethanol vapor and wash water; fire and occupational safety approval for flammable liquid storage; cosmetic product registration and safety documentation; and customs registration with dangerous-goods shipping capability. Alcohol controls deserve early attention, because holding ethanol without the right permit can stop production altogether.
| Market | Product | Alcohol, environment and safety |
|---|---|---|
| United States | FDA cosmetic facility registration, renewed every two years, plus product listing and safety substantiation under the Modernization of Cosmetics Regulation Act of 2022 | TTB Industrial Alcohol User Permit to use specially denatured spirits; state air permit for volatile organic compounds; OSHA flammable liquid rules |
| European Union | Regulation (EC) No 1223/2009, requiring a Responsible Person, safety report, product notification through the CPNP and manufacture under good manufacturing practice, commonly shown through ISO 22716 | National excise authorization for denatured alcohol; national environmental permit; ATEX rules on explosive atmospheres |
| India | Cosmetics Rules, 2020, with a manufacturing license applied for on Form COS-5 and granted on Form COS-8 by the State Licensing Authority | State excise permission for ethanol; state pollution control board consents; factory license and fire clearance |
EU labeling is tightening. Regulation (EU) 2023/1545 expanded the fragrance allergen list to more than 80 substances for products placed on the market from July 31, 2026, while existing stock may stay on sale until July 31, 2028. Brands also commonly require compliance with International Fragrance Association standards.
Key perfume manufacturers and recent developments
Production splits between groups that own plants and brands that outsource. L'Oréal, Chanel, LVMH, Estée Lauder, Coty and Puig lead globally, while Ajmal and other Gulf houses, along with Asian private-label makers, add regional depth. Fragrance houses such as Givaudan, dsm-firmenich, IFF and Symrise supply the concentrate behind many of them.
- March 2026. L'Oréal completed its purchase of Kering Beauté, including House of Creed, and signed 50-year exclusive fragrance and beauty licenses for Bottega Veneta and Balenciaga. A Gucci license starts when the current arrangement with Coty expires.
- April 2026. Givaudan broke ground on a greenfield compounding factory at Pedro Escobedo, Mexico, part of a combined investment above USD 160 million, targeting 20,000–25,000 tonnes of capacity by 2029.
- June 2026. Chanel started production at Venette, in northern France, consolidating its fragrance range in a 30,000-square-meter building.
Consolidation talks do not always conclude. Estée Lauder and Puig ended merger discussions in May 2026. Upstream shifts also matter, and the fragrance ingredients sector is a useful guide to the input costs a filler will face.
What's inside the Perfume project report PDF
The report runs to 21 chapters. Open a chapter to see its sections.
1. Preface
2. Scope and Methodology
- 2.1 Objectives of the Study
- 2.2 Stakeholders
- 2.3 Research Methodology
- 2.4 Data Sources and Key Assumptions
3. Executive Summary
- 3.1 Market Snapshot
- 3.2 Project at a Glance (Capacity, CapEx, OpEx)
- 3.3 Key Financial Indicators (IRR, NPV, Payback, Break-even)
- 3.4 Feasibility Verdict
4. Product Overview
- 4.1 Perfume Definition and Properties
- 4.2 Grades and Specifications (BIS / ISO / ASTM)
- 4.3 HS Code and Classification
- 4.4 Key Applications
- 4.5 Substitutes
5. Global Perfume Market
- 5.1 Market Overview
- 5.2 Historical and Current Market Performance (Volume and Value)
- 5.3 Market Breakup by Grade / Type
- 5.4 Market Breakup by End-Use Industry
- 5.5 Market Breakup by Region
- 5.6 Market Drivers, Restraints and Trends
- 5.7 Value Chain Analysis
- 5.8 Market Forecast
6. Target Country Perfume Market Analysis
- 6.1 Demand and Supply Analysis
- 6.2 Installed Capacity vs Demand Gap
- 6.3 Import Dependence
- 6.4 Demand Forecast by End-Use
7. Trade Analysis
- 7.1 Imports by Volume, Value and Country
- 7.2 Exports by Volume, Value and Country
- 7.3 Trade Balance and Opportunities
8. Price Analysis
- 8.1 Historical Perfume Price Trends by Region
- 8.2 Raw Material / Feedstock Price Trends and Linkage
- 8.3 Price Forecast
- 8.4 Margins Across the Value Chain
9. Competitive Landscape
- 9.1 Market Structure
- 9.2 Key Players and Installed Capacities
- 9.3 Profiles of Key Players
- 9.4 Recent Developments (Expansions, M&A, New Plants)
10. Manufacturing Process and Technology
- 10.1 Comparison of Technology Routes
- 10.2 Selected Route and Process Flow Diagram
- 10.3 Unit Operations Involved
- 10.4 Chemical Reactions Involved
- 10.5 Mass Balance and Raw Material Requirements
- 10.6 Energy Balance
- 10.7 Quality Assurance Criteria and Technical Tests
- 10.8 By-products and Waste Handling
- 10.9 Technology Licensors / Providers
11. Project Details, Requirements and Costs
- 11.1 Land, Location and Site Development
- 11.1.1 Site Selection Criteria
- 11.1.2 Location Analysis
- 11.1.3 Land Requirement and Costs
- 11.1.4 Site Development Costs
- 11.2 Plant Layout
- 11.2.1 Layout Principles
- 11.2.2 Proposed Layout
- 11.2.3 Factors Influencing Layout
- 11.3 Civil Works and Buildings
- 11.4 Plant Machinery
- 11.4.1 Machinery Requirements and Specifications
- 11.4.2 Machinery Costs
- 11.4.3 Machinery Suppliers
- 11.5 Raw Materials
- 11.5.1 Requirements per Tonne of Output
- 11.5.2 Procurement and Sourcing
- 11.5.3 Costs
- 11.5.4 Suppliers
- 11.6 Packaging
- 11.6.1 Packaging Requirements
- 11.6.2 Packaging Costs
- 11.6.3 Packaging Suppliers
- 11.7 Storage and Material Handling
- 11.8 Transportation Requirements and Costs
- 11.9 Utilities
- 11.9.1 Power Requirements and Costs
- 11.9.2 Water Requirements and Costs
- 11.9.3 Steam, Fuel and Other Utilities
- 11.10 Manpower Requirements and Wages
12. Environment, Health, Safety and Sustainability
- 12.1 Effluent and Emissions Management
- 12.2 Hazard Classification and Safety Measures
- 12.3 Carbon Footprint
- 12.4 Green / Low-Carbon Process Options
13. Regulatory Procedures, Approvals and Certifications
- 13.1 Licences and Registrations
- 13.2 Environmental Clearances
- 13.3 Product Certifications (BIS, REACH, etc.)
- 13.4 Approval Timeline
14. Project Implementation Schedule
15. Project Economics
- 15.1 Capital Cost of the Project
- 15.2 Techno-Economic Parameters
- 15.3 Capacity Utilization and Ramp-up
- 15.4 Product Pricing and Margins
- 15.5 Income Projections
- 15.6 Expenditure Projections
- 15.7 Working Capital Requirement
- 15.8 Taxation
- 15.9 Depreciation
16. Financial Analysis
- 16.1 Projected Profit and Loss Account
- 16.2 Projected Cash Flow Statement
- 16.3 Projected Balance Sheet
- 16.4 Liquidity Analysis
- 16.5 Profitability Analysis (Payback, NPV, IRR, ROI)
- 16.6 Break-even Analysis
- 16.7 Debt Service Coverage Ratio (DSCR)
- 16.8 Sensitivity Analysis
- 16.9 Scenario and Uncertainty Analysis
17. Funding and Incentives
- 17.1 Means of Finance and Debt-Equity Structure
- 17.2 Loans and Financial Assistance
- 17.3 Government Schemes and Subsidies (PLI, State Policies)
18. Risk Assessment
- 18.1 Key Success Factors
- 18.2 Key Risk Factors
- 18.3 Risk Mitigation
19. Strategic Recommendations
20. Case Study of a Successful Venture
21. Appendix
- 21.1 Detailed Assumptions
- 21.2 Abbreviations
- 21.3 List of Tables and Figures
- 21.4 Sources
This page vs. the full report
| Data point | On this page (free) | In the full report |
|---|---|---|
| Total CapEx | One rounded range at one capacity | Exact figure at three capacities with a line-item breakup |
| CapEx breakup | Category shares (%) only | Cost, quantity and supplier for every machine |
| Operating cost | Share of raw materials, utilities and labor | Per-unit cost sheet with each input price and consumption |
| Profitability | Gross margin range and payback band | Exact IRR, NPV, ROI, break-even and DSCR |
| Financial statements | List of what is included | 10-year P&L, cash flow, balance sheet and Excel model |
| Sensitivity | One directional line | Full sensitivity and scenario tables |
| Process | Simplified flow diagram | Detailed process flow, mass and energy balance, operating conditions |
| Machinery | Names of the main machines | Specifications, capacity, cost and supplier list |
| Market | Headline size, growth and India demand trend | Segment, region, trade and price forecast tables |
| Suppliers and buyers | Supplier types and sourcing hubs | Named suppliers and buyers |
Perfume project report: FAQs
How much does it cost to set up a perfume plant?
What gross margin can a perfume manufacturer expect?
How long is the payback on a perfume factory?
Does a perfume plant need to make its own fragrance concentrate?
Which license matters most for perfume manufacturing?
What is the largest cost in making perfume?

About the analyst
Rajdeep Kumar Deb, Lead Analyst - Consumer & Finance
Rajdeep brings a decade of consumer goods and financial services insight to strategic market analysis.
Related market research
- Fragrance Concentrates Market Size, Growth and Forecast 2032
- Fragrance Ingredients Market Size, Share and Growth Report 2032
- Perfume Packaging Market Size, Growth and Forecast 2032
- Cosmetics Perfumery Glass Bottle Market Size, Growth and Forecast 2032
- Essential Oils Market Size, Share, Growth and Forecast 2032.
- Solid Perfume Market Size, Growth, Share and Forecast 2032
More plant project reports
- Paper Cups Manufacturing Plant Project Report (DPR) 2026
- Cigarette Manufacturing Plant Project Report (DPR) 2026
- Ceiling Fan Manufacturing Plant Project Report (DPR) 2026
- Avocado Oil Processing Plant Project Report (DPR) 2026
- Aluminium Cans Manufacturing Plant Project Report (DPR) 2026
- Aloe Vera Gel Manufacturing Plant Project Report (DPR) 2026