
Quick answer
A green beans processing plant, modeled here as an IQF frozen cut-bean line producing 3 tonnes per hour (about 9,000 tonnes a season), costs about USD 7–11 million to build at an emerging-market industrial site in 2026, including land, a frozen store and ammonia refrigeration. Gross margin is estimated at 25–38%, driven by pod cost, export price and season length, and simple payback is 4–7 years at 75–85% utilization.
Feasible where contract growers can supply a long or double bean season and the freezer also runs peas, sweet corn or okra; weak as a single-crop plant tied to a three-month campaign.
Green Beans plant: key highlights
| Parameter | Indicative value | Note |
|---|---|---|
| Plant capacity | 3 t/h frozen green beans | About 9,000 tonnes over a 150-day, 20-hour season |
| Total CapEx | USD 7–11 million | Greenfield, emerging-market industrial park; U.S. or EU sites cost roughly three to four times as much |
| Raw material share of operating cost | 40–48% | Contract fresh pods at about 80% recovery |
| Gross margin | 25–38% | At USD 0.95–1.10 per kg ex-factory, bulk cut beans |
| Payback period | 4–7 years | Simple, pre-tax, at 75–85% utilization |
| IRR | Available in report | Post-tax, 10-year model |
| Break-even | Available in report | Capacity utilization basis |
Ranges assume a 3 t/h greenfield IQF frozen green bean plant (about 9,000 tonnes over a 150-day, 20-hour season), an emerging-market industrial park cost region, 2026 prices, 75–85% utilization, 80% recovery from fresh pods, pods at an assumed USD 0.20–0.28 per kg delivered and an ex-factory price of USD 0.95–1.10 per kg. The full report can be customized to any country.
What is green beans processing?
Green beans are the immature pods of the common bean, Phaseolus vulgaris, harvested before the seeds swell and sold as snap beans, string beans or French beans (haricots verts). A processing plant turns field-fresh pods into shelf-stable products. This overview models the form that dominates international trade and new investment, individually quick frozen (IQF) cut and whole green beans, on a line producing 3 tonnes of finished product per hour. Canned green beans remain a large, mature segment in North America, Europe and Japan, but most new capacity elsewhere is frozen.
Products are graded by pod diameter (extra fine below about 6.5 mm, fine, and medium or bobby beans above 8–9 mm) and by cut: whole, cut lengths of 2–4 cm, or French-style slices. Frozen green beans are classified under HS 0710.22 (beans of Vigna or Phaseolus species, uncooked or cooked by steaming or boiling, frozen), while canned unshelled beans fall under HS 2005.59. Buyers are retail private-label packers, food-service distributors, ready-meal and mixed-vegetable blenders, and importers in Europe, North America, Japan and the Gulf.
Green beans market overview and global demand
Credence Research estimates the global IQF fruits and vegetables market at about USD 7.1 billion in 2025, based on its USD 6.87 billion for 2024 and a 3.3% CAGR, with the market reaching about USD 8.9 billion by 2032. The shelf-stable alternative is larger: Credence Research values the canned vegetables market at USD 24.17 billion in 2024, growing 4.2% a year, and green beans are among its highest-volume items in the United States.
Trade in frozen beans is modest in value but concentrated. World exports under HS 0710.22 were about USD 444 million in 2023, with Belgium supplying 33%, followed by France, Canada, Spain and China, according to UN Comtrade data compiled by TrendEconomy. The United States was the largest importer, taking about 20% of world imports, ahead of France, Germany, Japan and the United Kingdom. In 2024, Belgium shipped about 120,000 tonnes worth USD 149 million, an implied unit value of about USD 1.24 per kg, while transaction prices from China, India and Egypt ran USD 1.04–1.14 per kg in May 2026.
Raw material for processing is grown in a few regional belts. In the United States, Wisconsin alone harvested 209,059 tons of snap beans for processing in 2024 at USD 130 per short ton, USDA NASS data show, out of a national processing crop of about 410,000 tons. Europe's processing belts lie in Belgium, northern France, Poland and Spain. Demand grows with retail freezer space, ready meals and food service, while the main risks are price pressure from lower-cost Asian and North African exporters and a short field season that caps plant utilization.
Frozen green beans manufacturing process
Green bean quality falls quickly after picking, so the line is built to move pods from field to freezer within about 6–12 hours. The steps below describe a plant producing 3 tonnes per hour of finished IQF beans from about 3.7–4 tonnes per hour of raw pods.
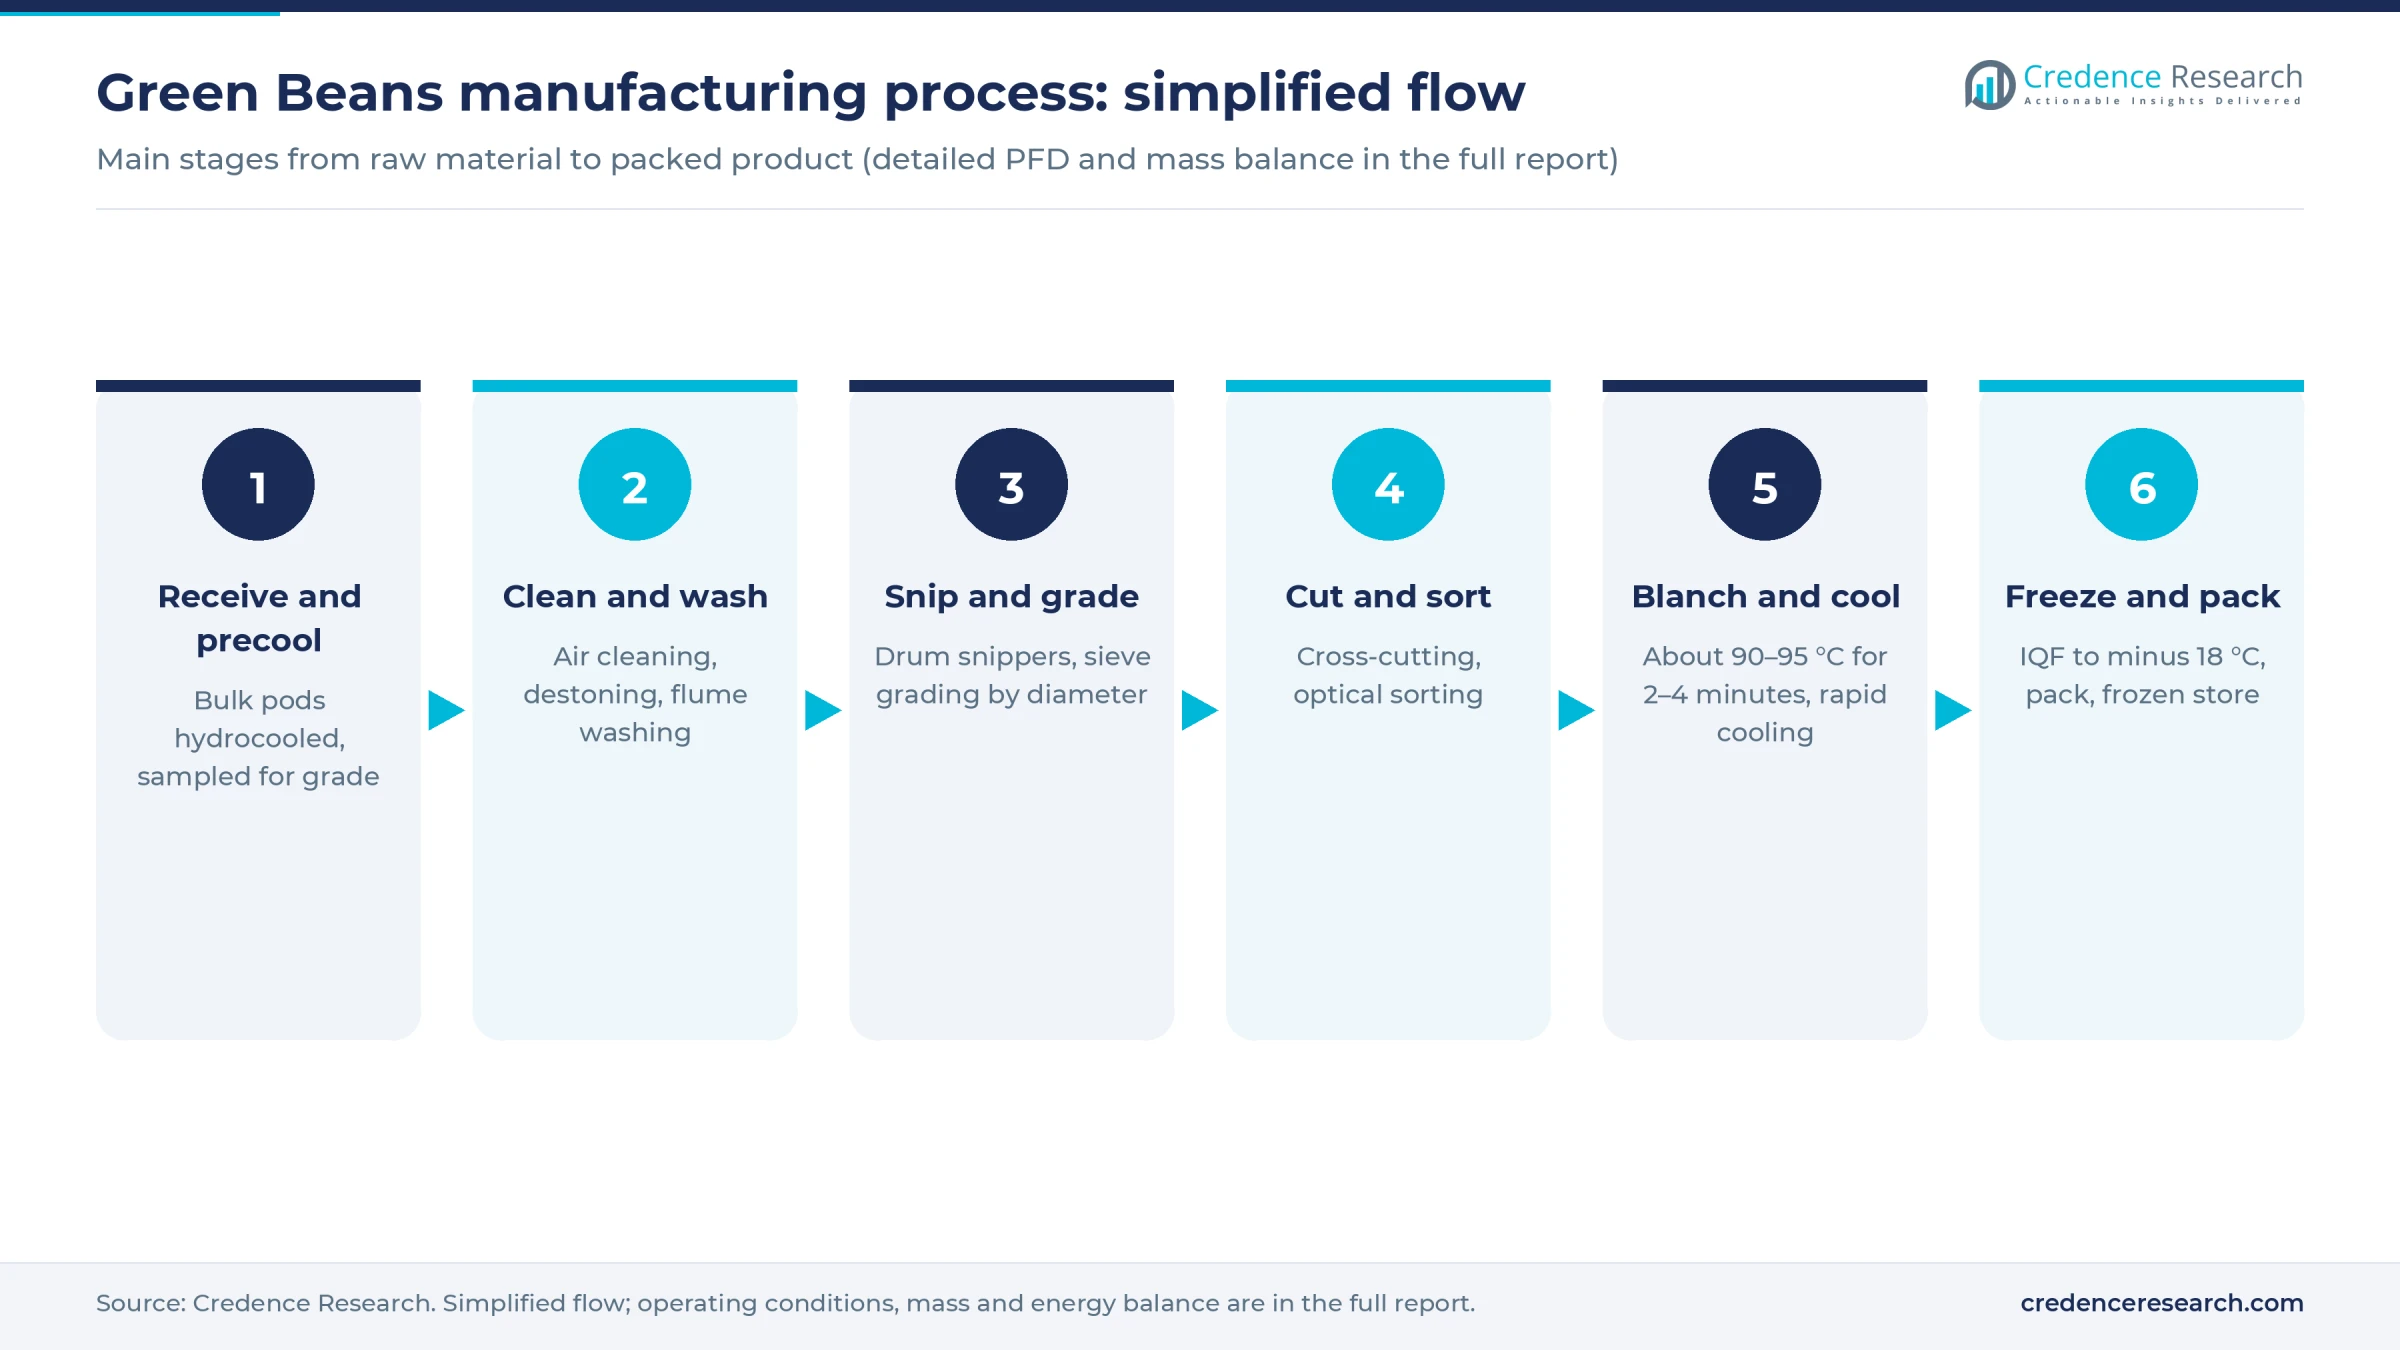
- Receiving and precooling. Machine-harvested pods arrive in bulk trucks or bins and are hydrocooled or held in a chilled reception area. Each load is sampled for size, fiber, defects and foreign material, which sets the grower price.
- Cleaning. Air separators and destoners remove leaves, stems, soil and stones, followed by flume washing.
- Snipping and grading. Rotating drum snippers trim stem and tip ends, and sieve graders split pods into diameter grades. The grade mix drives value, since extra-fine beans sell at a clear premium.
- Cutting and sorting. Cross-cutters slice pods to 2–4 cm lengths or French-style strips, a short-piece separator removes fines, and optical sorters reject discolored, rusted or broken pieces and any remaining foreign matter.
- Blanching and cooling. A steam or hot-water blancher heats beans to about 90–95 °C for roughly 2–4 minutes to inactivate peroxidase and other enzymes that would cause off-flavors and color loss in storage, followed by rapid water or air cooling.
- IQF freezing, packing and storage. Dewatered beans pass through a fluidized-bed tunnel freezer that freezes each piece separately to a core temperature of minus 18 °C, then pass metal detection, are packed in 10–20 kg bulk cartons or retail bags and held at minus 20 to minus 25 °C.
Overall recovery runs about 75–85% of raw pod weight, with losses from ends, culls and short pieces. Because the field season lasts only three to five months in most temperate regions, many plants pack the year's volume into bulk cartons and repack into retail or mixed-vegetable formats later, or run peas, sweet corn, okra or broccoli through the same freezer to raise utilization. Trimmings and culls go to animal feed or compost.
Green beans processing plant setup cost
For a greenfield plant producing 3 tonnes of frozen green beans per hour, about 9,000 tonnes over a 150-day, 20-hour season, with its own frozen store, total capital cost is estimated at USD 7–11 million at 2026 prices in an Asian, North African or Latin American industrial park. The benchmark is a disclosed project: Del Monte Kenya spent about USD 4 million on a 3.6 tonne-per-hour IQF pineapple line installed inside its existing cannery, Food Business Africa reported in February 2026. Scaled to 3 tonnes per hour, with snipping, grading and cutting equipment added, process and freezing equipment is put at USD 3.6–4.8 million, and a greenfield site adds land, buildings, a frozen store, utilities and contingency. U.S. or EU sites cost three to four times as much per tonne; Conagra's USD 300 million Birds Eye vegetable plant in Minnesota, opened in 2022, works out to about USD 3,600 per annual tonne against USD 780–1,220 here. The full report can be customized to any country.
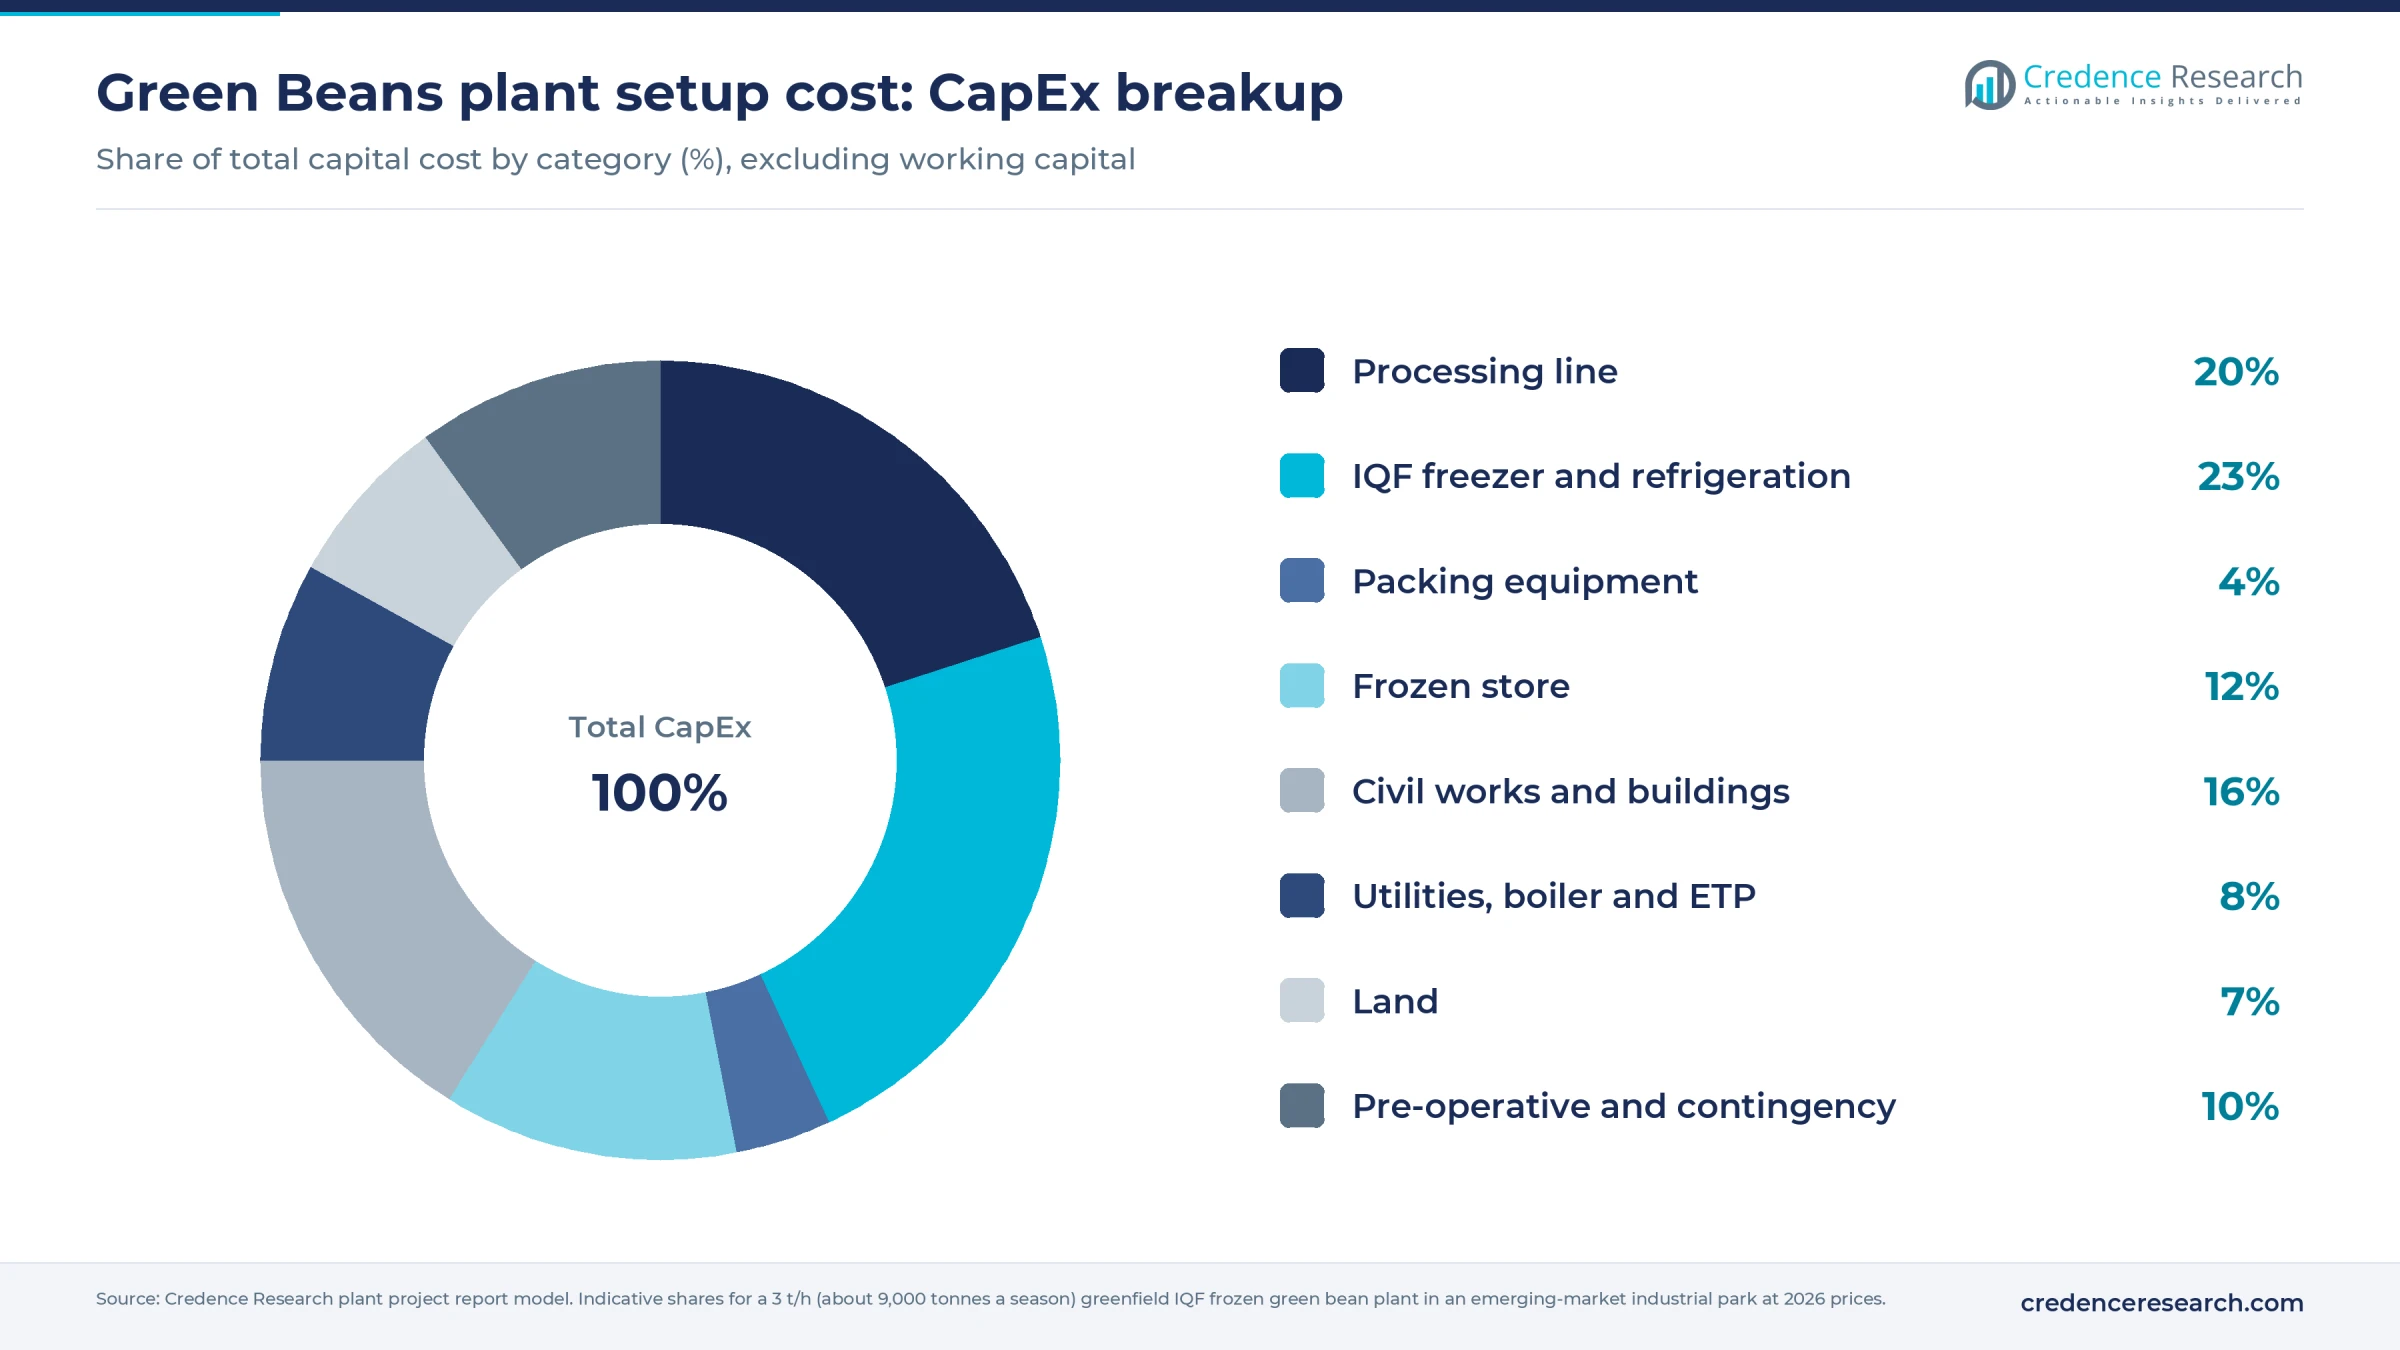
Land is the clearest worked example. A plant with raw reception, the processing hall, a 3,000-tonne frozen store, an effluent plant and truck yards needs about 2 hectares, or 20,000 square meters. At an assumed USD 20–50 per square meter for a serviced plot in an emerging-market industrial park, land costs USD 0.4–1.0 million, about 6–9% of project cost. At an assumed USD 50–150 per square meter for a U.S. or EU site, the same plot would cost USD 1.0–3.0 million. The frozen store is budgeted at an assumed USD 300–450 per tonne of capacity, or USD 0.9–1.35 million.
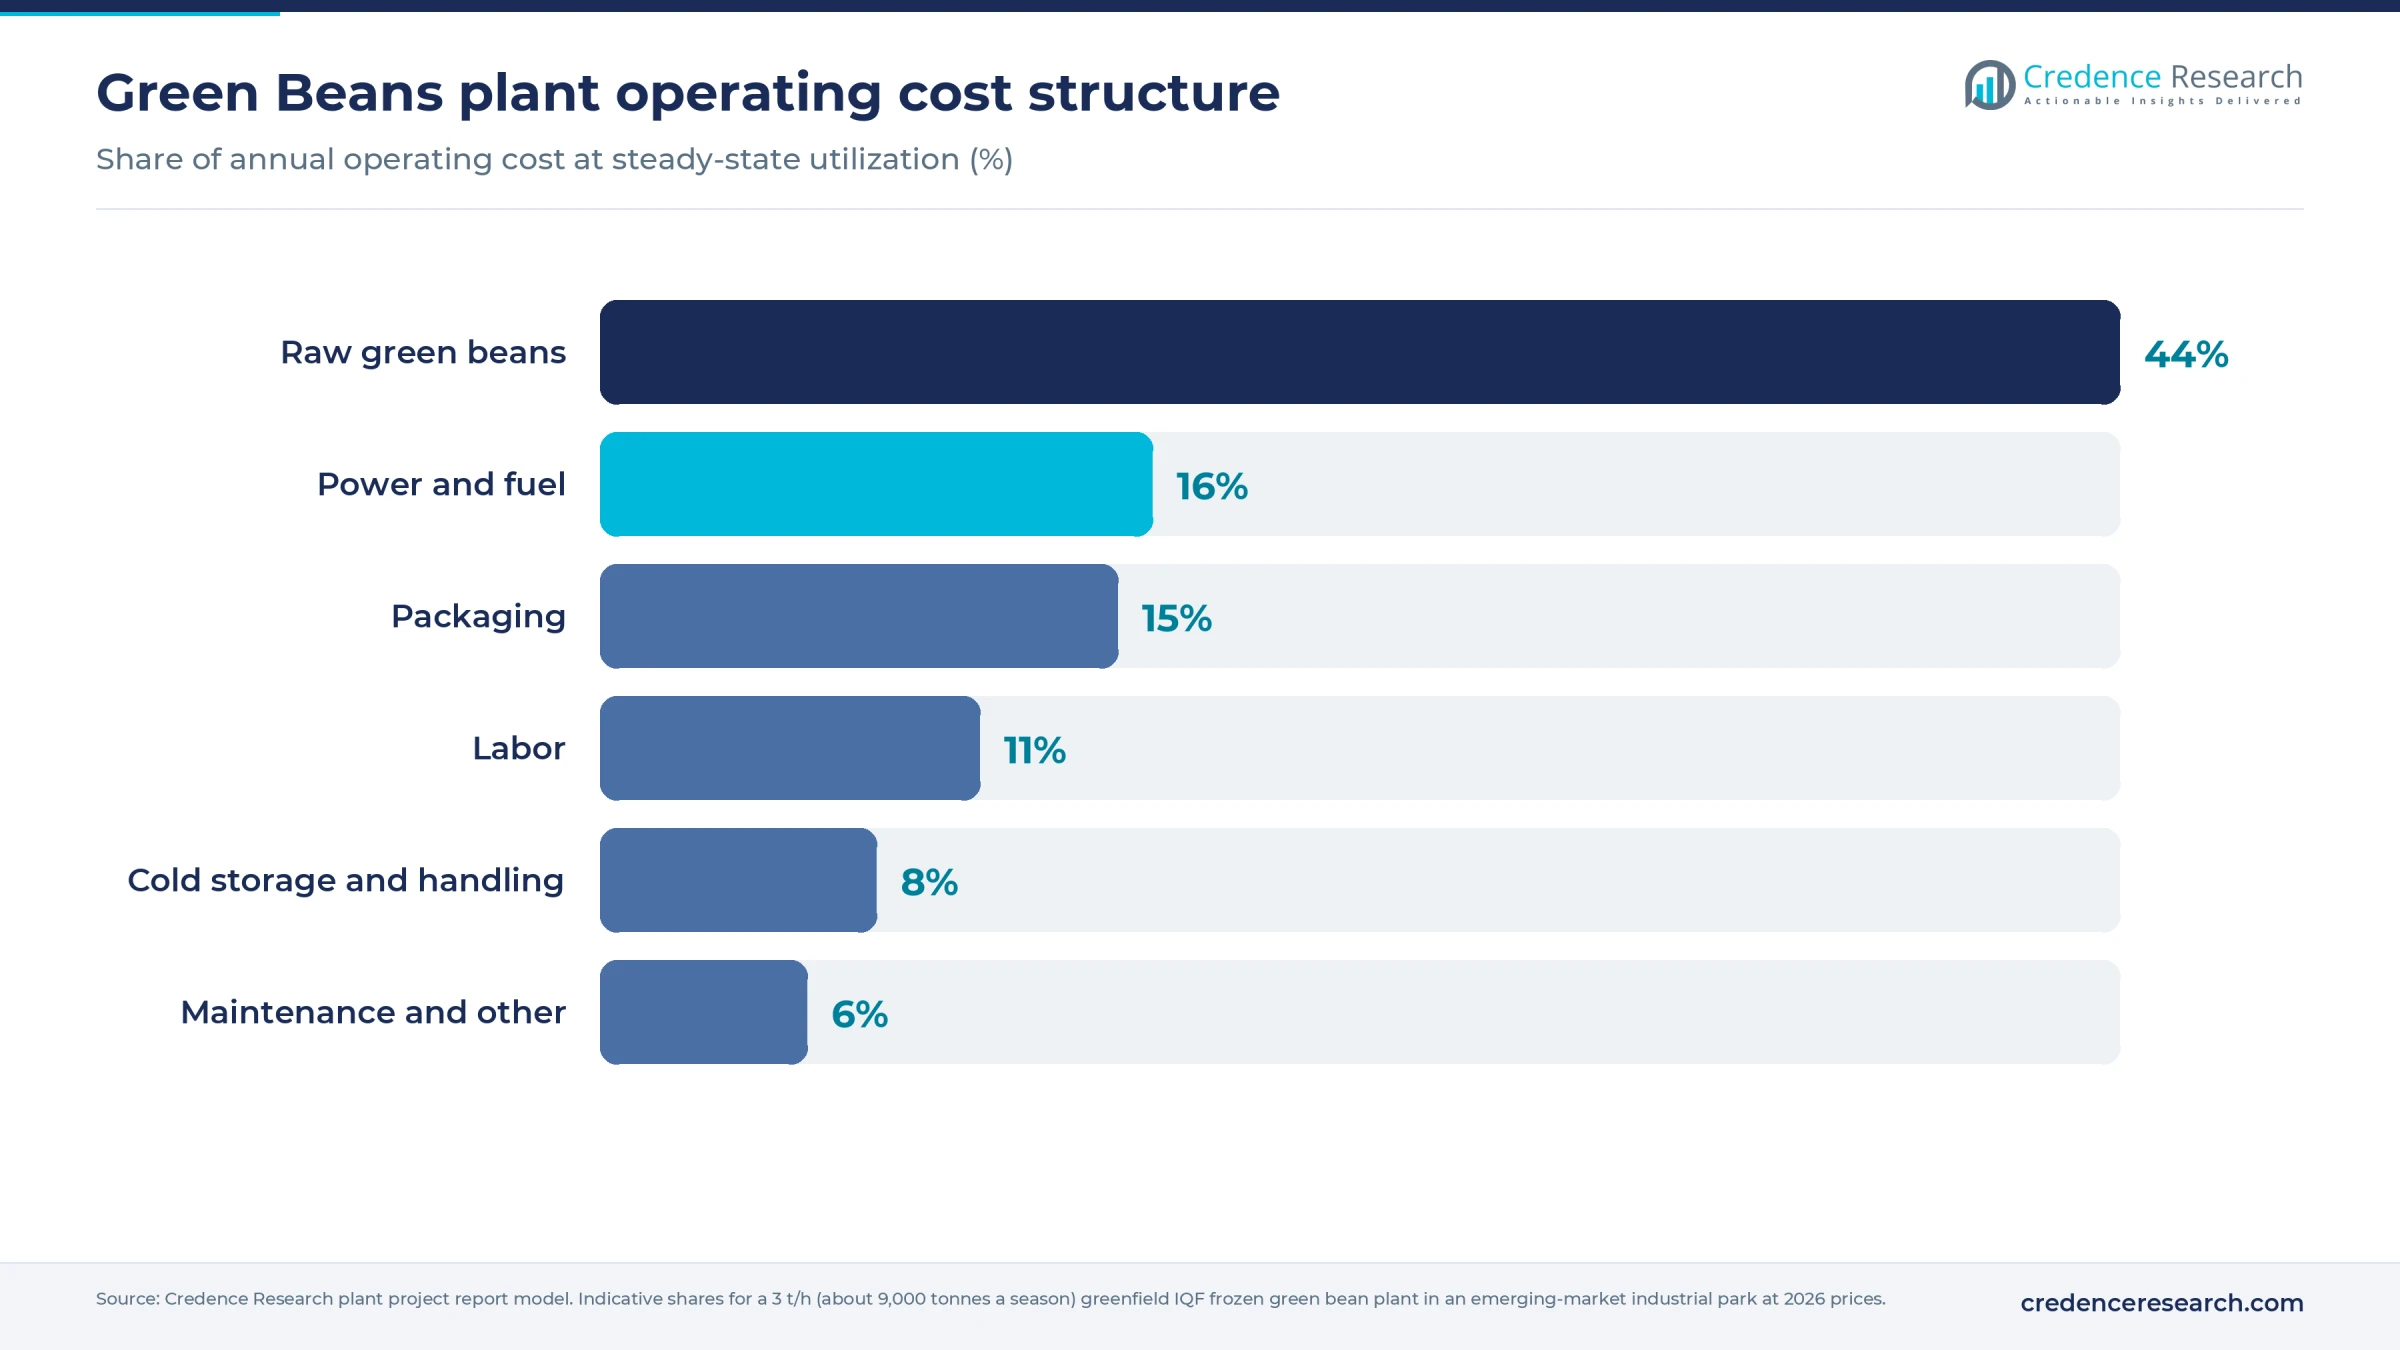
Operating cost is led by raw pods, followed by power and fuel for blanching, refrigeration and frozen storage, then packaging and seasonal labor.
Machine-wise costs, the construction schedule and working capital, which must finance several months of frozen inventory after each season, are available in the full report.
Machinery and raw materials for a green beans processing plant
Main plant machinery
- Receiving hoppers, hydrocooler and bulk holding bins
- Air cleaner, destoner and flume washer
- Drum snippers and sieve graders
- Cross-cutters or French-style slicers and a short-piece separator
- Optical sorters and inspection belts
- Steam or hot-water blancher with cooler and dewatering shaker
- Fluidized-bed IQF tunnel freezer with ammonia refrigeration plant
- Metal detectors, multihead weighers, baggers and carton packers
- Frozen store, boiler, water treatment and effluent treatment plant
Raw materials and sourcing regions
A plant of this size needs about 8,400–9,600 tonnes of fresh pods a year at 75–85% utilization and 80% recovery, which at 8–12 tonnes per hectare means roughly 700–1,200 hectares under contract. Processing beans come mainly from Wisconsin, New York, Oregon and Michigan in the United States; Belgium, northern France, the Netherlands, Poland and Spain in Europe; Egypt, Morocco and Kenya in Africa; eastern China; and India, Guatemala and Mexico. Processors usually supply seed of uniform, low-fiber bush varieties, stagger plantings so pods arrive at a steady rate and pay growers by grade. Other inputs are water, steam, ammonia refrigerant, polyethylene bags, corrugated cartons and, for blends, other vegetables.
Green beans business profit margin and ROI
Revenue depends on the export price of frozen cut beans. Belgium, the largest exporter, averaged about USD 1.24 per kg in 2024, and Chinese, Indian and Egyptian suppliers traded at USD 1.04–1.14 per kg in May 2026. A new plant outside Europe is modeled at USD 0.95–1.10 per kg ex-factory for bulk cut beans. At 75–85% utilization, it would sell 6,750–7,650 tonnes a year for about USD 6.4–8.4 million. At an assumed delivered pod price of USD 0.20–0.28 per kg, compared with about USD 0.14 per kg paid to Wisconsin growers in 2024, raw material costs USD 0.25–0.35 per kg of finished product. Adding energy, packaging, labor, cold storage and maintenance, total production cost is about USD 0.59–0.77 per kg, so gross margin is estimated at 25–38% in most combinations, falling below 20% if high pod costs coincide with low prices. After selling, freight and overhead costs of 7–9% of revenue, simple payback falls in the 4–7 year range.
Utilization is the biggest swing factor. Running the freezer on a second crop spreads fixed cost over more tonnes, while a short or rain-hit bean season raises cost per kilogram sharply. Each USD 0.05 per kg change in selling price moves gross margin by about 3 percentage points.
| Metric | Indicative value |
|---|---|
| Gross margin | 25–38% |
| Payback period | 4–7 years |
| Project IRR | Available in report |
| NPV | Available in report |
| ROI | Available in report |
| DSCR | Available in report |
| Break-even utilization | Available in report |
How to start a green beans processing business, licenses and approvals
A frozen green bean plant typically needs business and tax registration, land-use and building permits, an environmental permit covering wastewater from washing and blanching, food business registration or licensing with the national food safety authority, occupational safety compliance for ammonia refrigeration and boilers, and export registration where product is shipped abroad. Importing markets also enforce pesticide residue limits on the beans themselves, so grower spray records matter as much as plant hygiene.
Examples by market
| Market | Key regulator and permits |
|---|---|
| United States | FDA food facility registration and the FSMA preventive controls rule (21 CFR Part 117); EPA or state NPDES permit or local pretreatment permit for wastewater; OSHA Process Safety Management where ammonia exceeds 10,000 lb. A canned bean line would also need FDA low-acid canned food registration and process filing under 21 CFR Parts 108 and 113 |
| European Union | Food business operator registration under Regulation (EC) No 852/2004; quick-frozen food rules under Directive 89/108/EEC, which set minus 18 °C and labeling; pesticide limits under Regulation (EC) No 396/2005; national environmental and water discharge permits |
| India | FSSAI central or state license; state pollution control board consent to establish and operate; APEDA registration-cum-membership certificate for exports of processed vegetables |
No mandatory product certification applies beyond food safety rules, though retail and food-service buyers usually require audited schemes such as BRCGS or FSSC 22000.
Key green beans processing companies and recent developments
Global processed green bean supply is led by Bonduelle of France, Greenyard Frozen and Ardo of Belgium, Seneca Foods and Conagra's Birds Eye in the United States, and Nortera in Canada and the United States, with Del Monte a leading U.S. canned brand. Regional exporters include frozen vegetable processors in China, Egypt, Poland, Spain and India.
- March 2026: Fresh Del Monte Produce completed its USD 285 million purchase of Del Monte Foods' vegetable business, including the Del Monte and S&W packaged vegetable brands and several U.S. and Mexican plants.
- March 2026: Seneca Foods acquired B&G Foods' U.S. Green Giant frozen vegetable manufacturing operations in Yuma, Arizona, while B&G kept its Irapuato, Mexico plant and agreed to co-pack certain products for Seneca.
- February 2026: Greenyard completed a strategic alliance with French cooperative Eureden that combines Eureden's Gelagri Bretagne frozen vegetable business with Greenyard Frozen France across four Brittany sites, with Greenyard as majority shareholder.
Consolidation among Western leaders shows that grower networks, freezer capacity and retail contracts, more than equipment, now decide which processors gain share.
What's inside the Green Beans project report PDF
The report runs to 21 chapters. Open a chapter to see its sections.
1. Preface
2. Scope and Methodology
- 2.1 Objectives of the Study
- 2.2 Stakeholders
- 2.3 Research Methodology
- 2.4 Data Sources and Key Assumptions
3. Executive Summary
- 3.1 Market Snapshot
- 3.2 Project at a Glance (Capacity, CapEx, OpEx)
- 3.3 Key Financial Indicators (IRR, NPV, Payback, Break-even)
- 3.4 Feasibility Verdict
4. Product Overview
- 4.1 Green Beans Definition and Properties
- 4.2 Grades and Specifications (BIS / ISO / ASTM)
- 4.3 HS Code and Classification
- 4.4 Key Applications
- 4.5 Substitutes
5. Global Green Beans Market
- 5.1 Market Overview
- 5.2 Historical and Current Market Performance (Volume and Value)
- 5.3 Market Breakup by Grade / Type
- 5.4 Market Breakup by End-Use Industry
- 5.5 Market Breakup by Region
- 5.6 Market Drivers, Restraints and Trends
- 5.7 Value Chain Analysis
- 5.8 Market Forecast
6. Target Country Green Beans Market Analysis
- 6.1 Demand and Supply Analysis
- 6.2 Installed Capacity vs Demand Gap
- 6.3 Import Dependence
- 6.4 Demand Forecast by End-Use
7. Trade Analysis
- 7.1 Imports by Volume, Value and Country
- 7.2 Exports by Volume, Value and Country
- 7.3 Trade Balance and Opportunities
8. Price Analysis
- 8.1 Historical Green Beans Price Trends by Region
- 8.2 Raw Material / Feedstock Price Trends and Linkage
- 8.3 Price Forecast
- 8.4 Margins Across the Value Chain
9. Competitive Landscape
- 9.1 Market Structure
- 9.2 Key Players and Installed Capacities
- 9.3 Profiles of Key Players
- 9.4 Recent Developments (Expansions, M&A, New Plants)
10. Manufacturing Process and Technology
- 10.1 Comparison of Technology Routes
- 10.2 Selected Route and Process Flow Diagram
- 10.3 Unit Operations Involved
- 10.4 Chemical Reactions Involved
- 10.5 Mass Balance and Raw Material Requirements
- 10.6 Energy Balance
- 10.7 Quality Assurance Criteria and Technical Tests
- 10.8 By-products and Waste Handling
- 10.9 Technology Licensors / Providers
11. Project Details, Requirements and Costs
- 11.1 Land, Location and Site Development
- 11.1.1 Site Selection Criteria
- 11.1.2 Location Analysis
- 11.1.3 Land Requirement and Costs
- 11.1.4 Site Development Costs
- 11.2 Plant Layout
- 11.2.1 Layout Principles
- 11.2.2 Proposed Layout
- 11.2.3 Factors Influencing Layout
- 11.3 Civil Works and Buildings
- 11.4 Plant Machinery
- 11.4.1 Machinery Requirements and Specifications
- 11.4.2 Machinery Costs
- 11.4.3 Machinery Suppliers
- 11.5 Raw Materials
- 11.5.1 Requirements per Tonne of Output
- 11.5.2 Procurement and Sourcing
- 11.5.3 Costs
- 11.5.4 Suppliers
- 11.6 Packaging
- 11.6.1 Packaging Requirements
- 11.6.2 Packaging Costs
- 11.6.3 Packaging Suppliers
- 11.7 Storage and Material Handling
- 11.8 Transportation Requirements and Costs
- 11.9 Utilities
- 11.9.1 Power Requirements and Costs
- 11.9.2 Water Requirements and Costs
- 11.9.3 Steam, Fuel and Other Utilities
- 11.10 Manpower Requirements and Wages
12. Environment, Health, Safety and Sustainability
- 12.1 Effluent and Emissions Management
- 12.2 Hazard Classification and Safety Measures
- 12.3 Carbon Footprint
- 12.4 Green / Low-Carbon Process Options
13. Regulatory Procedures, Approvals and Certifications
- 13.1 Licences and Registrations
- 13.2 Environmental Clearances
- 13.3 Product Certifications (BIS, REACH, etc.)
- 13.4 Approval Timeline
14. Project Implementation Schedule
15. Project Economics
- 15.1 Capital Cost of the Project
- 15.2 Techno-Economic Parameters
- 15.3 Capacity Utilization and Ramp-up
- 15.4 Product Pricing and Margins
- 15.5 Income Projections
- 15.6 Expenditure Projections
- 15.7 Working Capital Requirement
- 15.8 Taxation
- 15.9 Depreciation
16. Financial Analysis
- 16.1 Projected Profit and Loss Account
- 16.2 Projected Cash Flow Statement
- 16.3 Projected Balance Sheet
- 16.4 Liquidity Analysis
- 16.5 Profitability Analysis (Payback, NPV, IRR, ROI)
- 16.6 Break-even Analysis
- 16.7 Debt Service Coverage Ratio (DSCR)
- 16.8 Sensitivity Analysis
- 16.9 Scenario and Uncertainty Analysis
17. Funding and Incentives
- 17.1 Means of Finance and Debt-Equity Structure
- 17.2 Loans and Financial Assistance
- 17.3 Government Schemes and Subsidies (PLI, State Policies)
18. Risk Assessment
- 18.1 Key Success Factors
- 18.2 Key Risk Factors
- 18.3 Risk Mitigation
19. Strategic Recommendations
20. Case Study of a Successful Venture
21. Appendix
- 21.1 Detailed Assumptions
- 21.2 Abbreviations
- 21.3 List of Tables and Figures
- 21.4 Sources
This page vs. the full report
| Data point | On this page (free) | In the full report |
|---|---|---|
| Total CapEx | One rounded range at one capacity | Exact figure at three capacities with a line-item breakup |
| CapEx breakup | Category shares (%) only | Cost, quantity and supplier for every machine |
| Operating cost | Share of raw materials, utilities and labor | Per-unit cost sheet with each input price and consumption |
| Profitability | Gross margin range and payback band | Exact IRR, NPV, ROI, break-even and DSCR |
| Financial statements | List of what is included | 10-year P&L, cash flow, balance sheet and Excel model |
| Sensitivity | One directional line | Full sensitivity and scenario tables |
| Process | Simplified flow diagram | Detailed process flow, mass and energy balance, operating conditions |
| Machinery | Names of the main machines | Specifications, capacity, cost and supplier list |
| Market | Headline size, growth and global demand | Segment, region, trade and price forecast tables |
| Suppliers and buyers | Supplier types and sourcing hubs | Named suppliers and buyers |
Green Beans project report: FAQs
How much does it cost to set up a green beans processing plant?
Which HS code applies to processed green beans?
What is the profit margin in a green beans processing business?
How many green beans does a 3 tonne-per-hour plant need?
Which licenses are needed to start a green beans processing business?
What is the payback period for a frozen green bean plant?
Which countries export the most frozen green beans?

About the analyst
Priyanka Mor, Senior Consultant
Senior Consultant at Credence Research Inc directing strategic market advisory, cross-border commercial due diligence and enterprise intelligence frameworks for global B2B clients. Combines quantitative modeling with executive advisory, translating macroeconomic variables and supply chain data into go-to-market blueprints, M&A screenings and competitive war-gaming strategies.
Related market research
- IQF Fruits and Vegetables Market Size, Growth & Forecast 2032
- Frozen Fruits And Vegetables Market Size, Share & Forecast 2032
- Canned Vegetables Market Size, Growth and Forecast 2032
- Processed Fruits and Vegetables Market Size, Share and Forecast 2032
- Fruit and Vegetable Processing Equipment Market Size, Growth and Forecast 2032
- Frozen Foods Market Size, Growth, Share and Forecast 2032
More plant project reports
- Peanut Butter Manufacturing Plant Project Report (DPR) 2026
- Banana Powder Manufacturing Plant Project Report (DPR) 2026
- Instant Noodles Manufacturing Plant Project Report (DPR) 2026
- Cashew Processing Plant Project Report (DPR) 2026
- Ginger Processing Plant Project Report (DPR) 2026
- Pre Packaged Soup Manufacturing Plant Project Report (DPR) 2026