
Quick answer
A pre-packaged soup plant cooks vegetables, meat and stock in steam kettles, fills cans or pouches and sterilizes them in retorts for shelf-stable sale. This overview models a greenfield plant making 10,000 tonnes a year, with estimated CapEx of USD 9–24 million depending on cost region. Gross margin is estimated at 22–40%, with payback at 3–8 years, because selling price, ingredients and can costs drive most of the economics.
Viable for a plant with a private-label or foodservice contract within regional freight range, but risky as a new branded launch in mature canned soup markets dominated by a few large groups.
Pre Packaged Soup plant: key highlights
| Parameter | Indicative value | Note |
|---|---|---|
| Plant capacity | 10,000 tonnes a year | About 7,500 tonnes sold at 75% utilization, two shifts on 300 days |
| Total CapEx | USD 9–24 million | Greenfield retort plant, excludes USD 1.5–2.5 million working capital |
| Raw material share of operating cost | 30–38% | Vegetables, meat, dairy, starch and seasonings; packaging adds about 25% |
| Gross margin | 22–40% | After ingredients, packaging and direct conversion |
| Payback period | 3–8 years | Includes about one year of ramp-up; depends on site cost and label mix |
| IRR | Available in report | Post-tax, 10-year model |
| Break-even | Available in report | Capacity utilization basis |
Ranges assume a 10,000-tonne-a-year greenfield plant making shelf-stable ready-to-serve soup in cans and retort pouches, two shifts on 300 days, 75% utilization and 2026 prices, in an Asian industrial park at the low end and a U.S. or EU site at the high end. EUR converted at an assumed USD 1.14. The net price of USD 2.00–2.60 per kg and all ingredient, packaging, wage and land rates are assumed. The full report can be customized to any country or region.
What is pre-packaged soup?
Pre-packaged soup is soup made in a factory and sold sealed, either ready to heat or ready to mix with water, with a shelf life set by how it was processed. The main formats are shelf-stable ready-to-serve and condensed soups in steel cans, retort pouches or aseptic cartons; dry soup mixes and instant cup soups; chilled soups in tubs or pouches; and frozen soups for retail and foodservice. Broths and stocks are usually counted in the same category and now supply much of its volume growth.
Most ready-to-serve soups are low-acid foods with a pH above 4.6, so a sealed can or pouch must be heated in a retort long enough to destroy Clostridium botulinum spores. That single requirement shapes the plant layout, the regulator's interest and the cost base. Tomato and some acidified vegetable soups can be hot-filled instead, and dry mixes rely on low moisture rather than heat for stability.
For customs, soups, broths and their preparations fall under Harmonized System subheading 2104.10, which covers liquid, condensed and dry soups as well as bouillon cubes and powders. Buyers include supermarket chains and their own-label ranges, discounters, foodservice distributors, institutional caterers, the military and online grocers.
Pre-packaged soup market overview and global demand
Credence Research values the global packaged soup market at USD 16.04 billion in 2024 and projects USD 27.35 billion by 2032, a 6.9% CAGR. Carried forward at that rate, the market would be about USD 17.1 billion in 2025, a figure derived from the 2024 base rather than separately reported. Chilled and frozen formats form a smaller, faster-growing slice, which Credence Research puts at USD 2.82 billion in 2024 with an 8.3% CAGR in its refrigerated and frozen soup market report.
Trade figures show where production sits. UN Comtrade data show 122 reporting countries exported USD 3.59 billion of goods under HS 2104.10 in 2024, about 1.26 million tonnes, for an average unit value near USD 2.85 per kg. The United States led with USD 913 million and about 315,000 tonnes, followed by Canada at USD 243 million, Spain at USD 200 million and Germany at USD 178 million. Senegal ranked fifth and Ivory Coast 12th because the code also covers bouillon cubes, which West African plants ship across the region, a trade covered in the bouillon cube market report.
Demand patterns differ sharply by region, and North America and Western Europe buy mostly canned, carton and chilled ready-to-serve soup, and the category is mature there, with growth coming from broth, premium and higher-protein lines. Japan, South Korea and much of Southeast Asia favor instant cup soups and miso. Africa, the Middle East and South Asia lean toward bouillon and dry mixes, which travel cheaply and need no cold chain. Retail soup sales in the Northern Hemisphere peak in autumn and winter, so plants build stock over the summer.
For a new plant, format choice matters more than the headline growth rate. A can that is mostly water rarely justifies long-distance freight, so ready-to-serve plants sell regionally while dry mix plants can export.
Pre-packaged soup manufacturing process
The modeled plant makes shelf-stable ready-to-serve soup in steel cans and retort pouches, about 10,000 tonnes a year on two shifts. Condensed soup runs on the same equipment with less water, while dry mixes need a separate blending and packing hall with dust control.
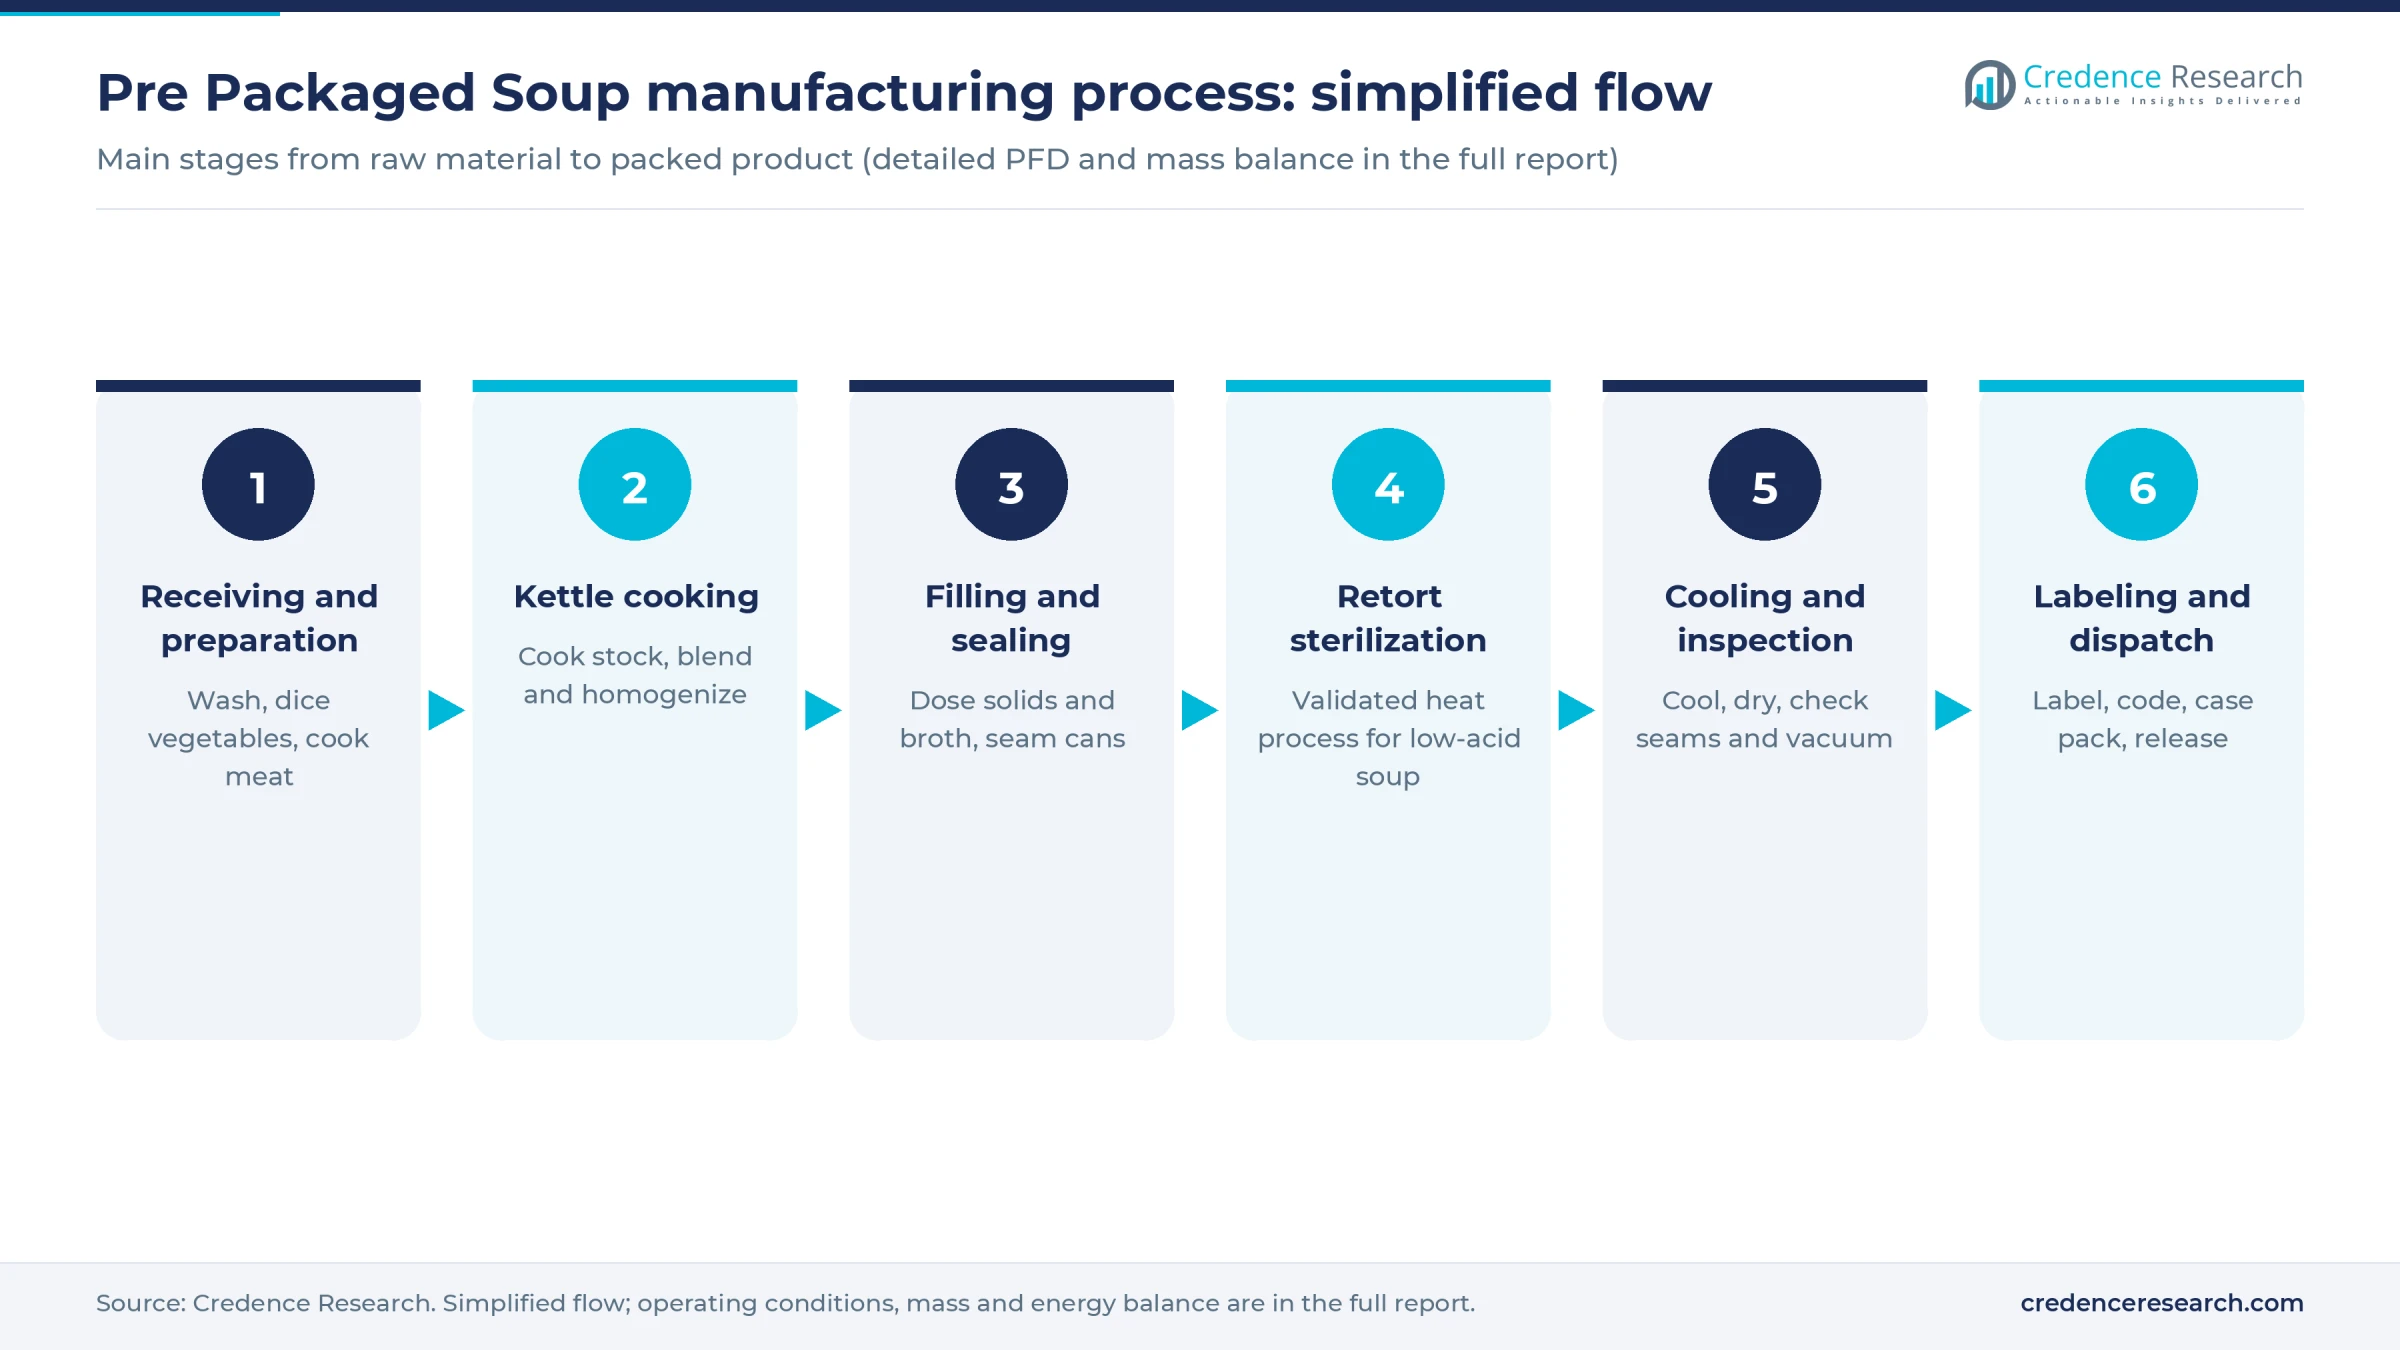
- Receiving and preparation. Fresh, frozen and dehydrated vegetables are washed, peeled and diced, while chicken and beef are cooked and diced in-house or bought precooked. Noodles, rice, beans, cream, starch and spices are weighed into batch kits, and allergens such as wheat, milk and celery are kept apart.
- Kettle cooking and blending. Stocks and sauces are cooked in steam-jacketed kettles of 1,000–4,000 liters, with roux or modified starch for body, and cream soups are homogenized. Each batch is checked for solids, salt and viscosity, because the thermal process is validated for a fixed recipe.
- Filling and sealing. A particulate filler doses vegetables and meat into each can, then a liquid filler tops it with broth. Cans pass through a double seamer and pouches through a heat sealer. Fill weight and headspace are held within tight limits, since both change how heat reaches the center of the pack.
- Retort sterilization. Sealed packs go into batch or continuous rotary retorts at about 116–121°C for a time set by a process authority. Temperature records for every load are kept as legal documents.
- Cooling and inspection. Packs are cooled in chlorinated water, dried and checked for seam defects, vacuum and fill.
- Labeling and dispatch. Cans are labeled, coded, case packed and held for release after quality checks.
The retort is both the bottleneck and the main food safety control point, since an underprocessed batch of low-acid soup is a botulism risk. Larger brands increasingly add aseptic lines, which sterilize soup in a heat exchanger before it is filled into sterile cartons. Flavor and texture improve, but the equipment costs far more and needs tighter validation. Process schedules, yields and batch recipes are in the full report.
Pre-packaged soup plant setup cost
This overview models a greenfield plant rated at 10,000 tonnes a year, roughly 22 million pounds, running two shifts on 300 days and selling about 7,500 tonnes at 75% utilization. Estimated CapEx is USD 9–24 million before about USD 1.5–2.5 million of working capital. The low end reflects an Asian industrial park and the high end a U.S. or EU site with more automation.
The range is checked against a disclosed European soup plant. PepsiCo's Alvalle gazpacho factory in Murcia, Spain, opened in June 2020 at a cost of EUR 31 million and makes more than 30 million liters a year. At an assumed USD 1.14 per euro, that is about USD 35 million for roughly 31,000 tonnes. Scaled down to 10,000 tonnes by the six-tenths rule and raised an assumed 22% for cost inflation since 2020, it implies about USD 22 million, near the high end. The Alvalle plant makes chilled soup with no retorts, so the comparison is approximate. In the United States, Blount Fine Foods reported spending more than USD 25 million in 2020 on an 80,000-square-foot soup plant in Portland, Oregon. The model assumes USD 3.8–7.5 million for kettles, fillers, seamers and retorts, a judgment rather than a quoted price.
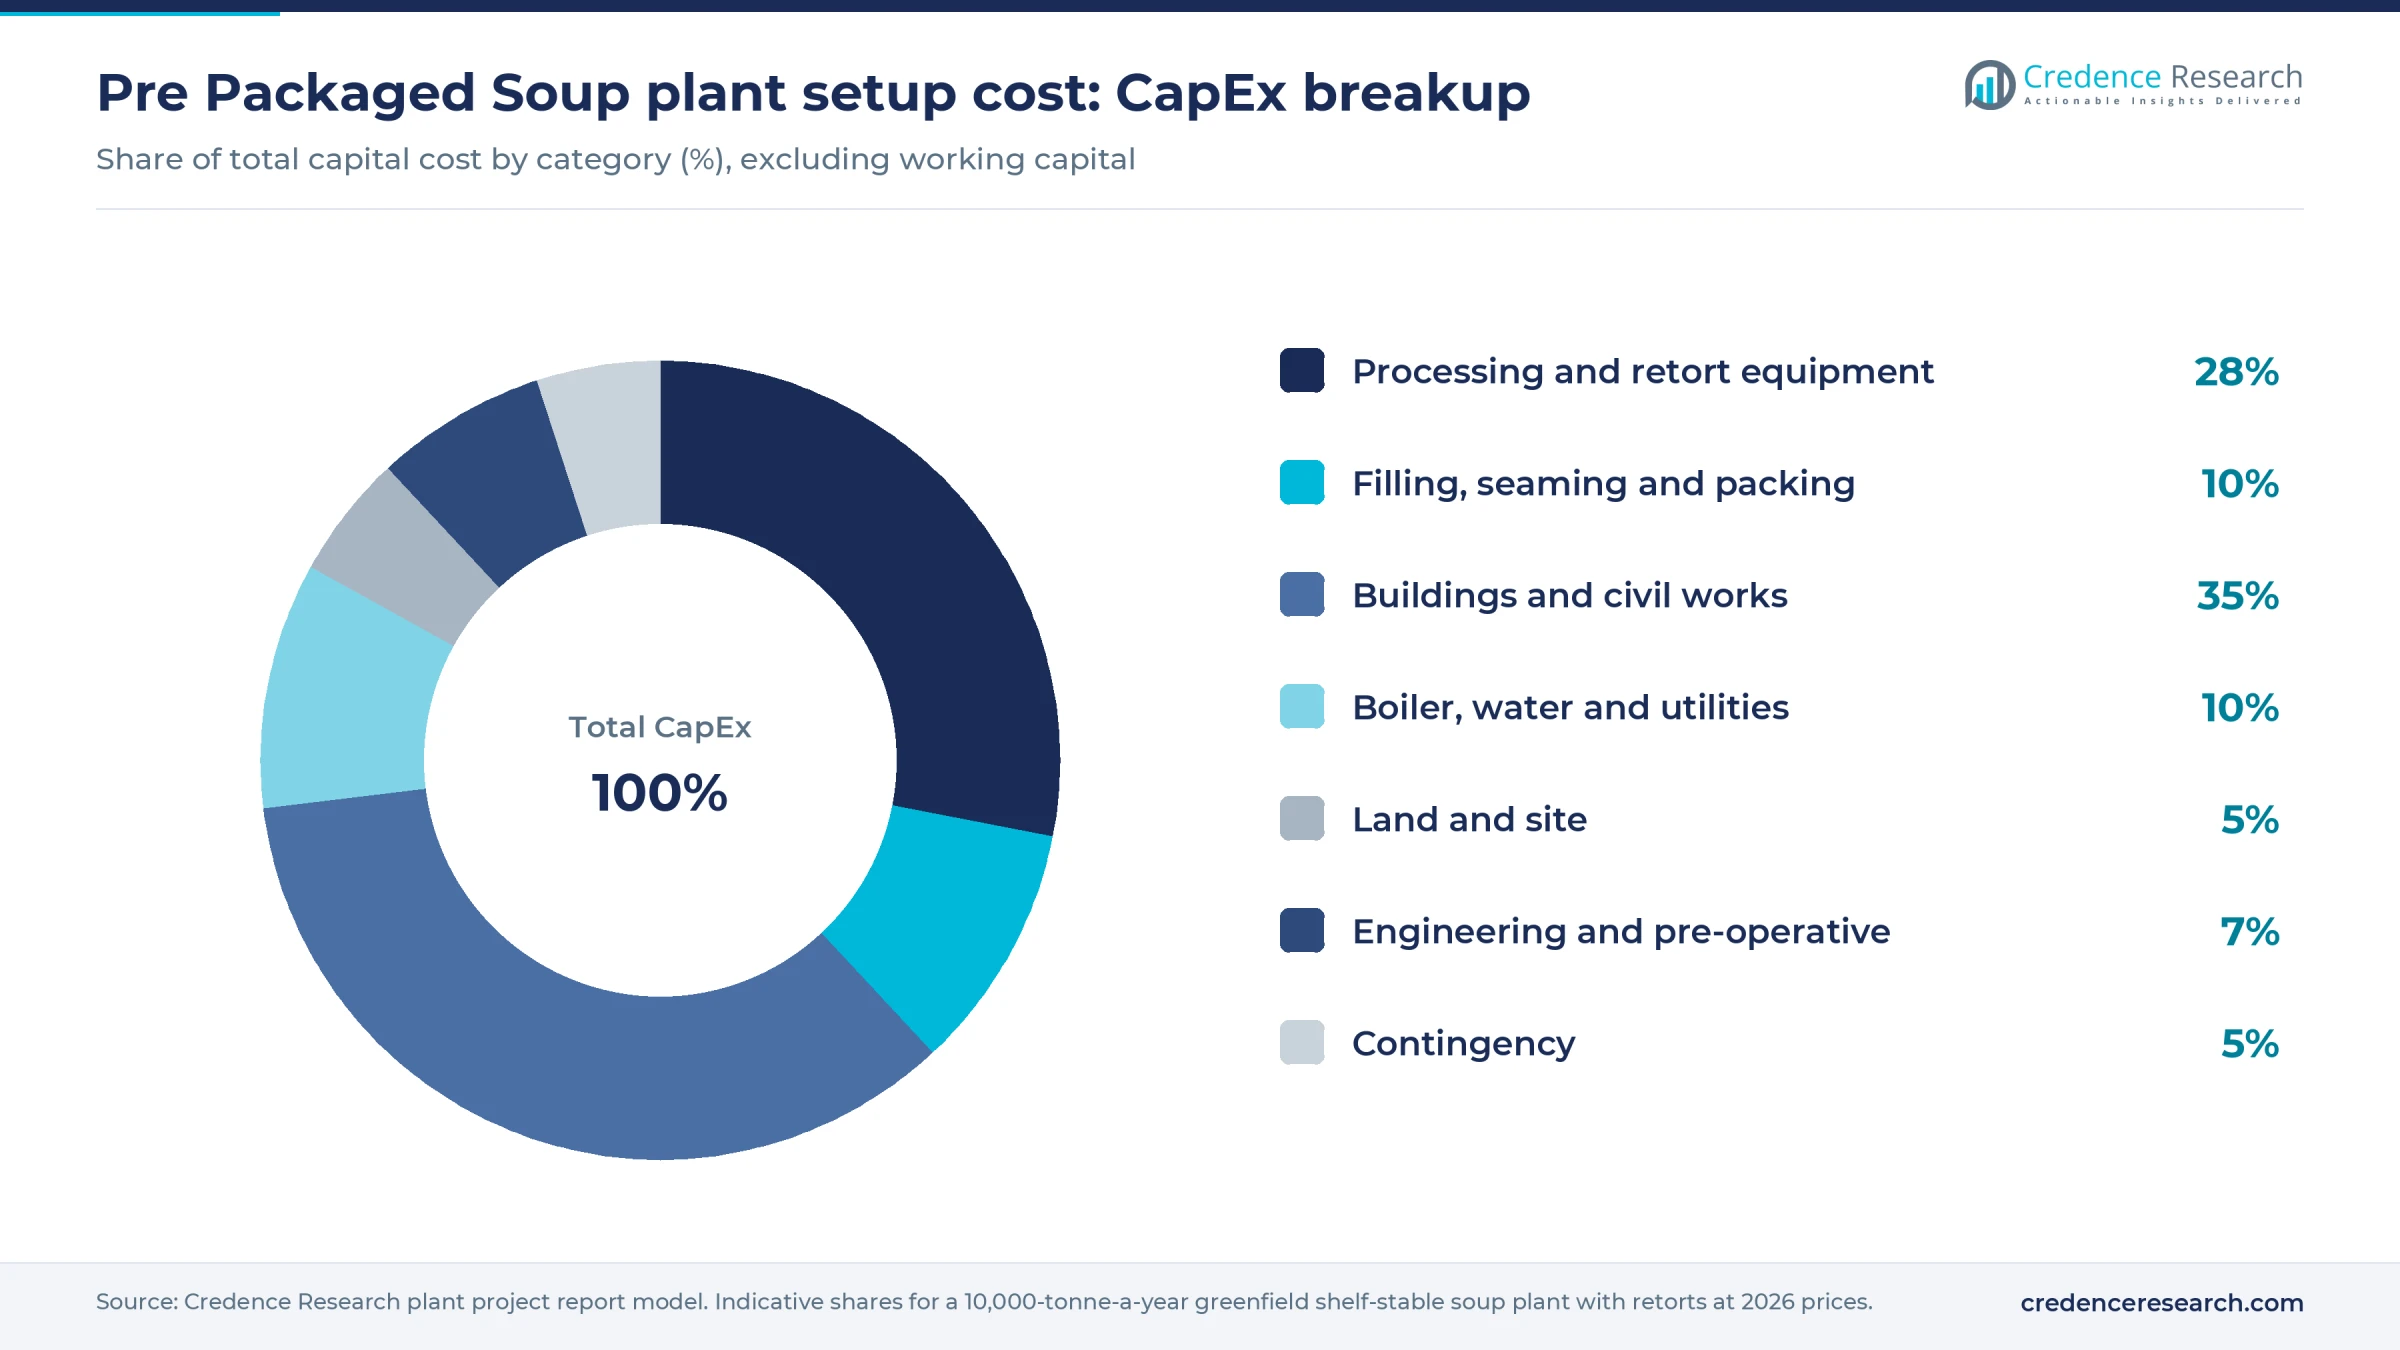
Process and packing equipment take 38% of CapEx and buildings 35%. Land shows how location moves the total. At an assumed 15,000 square meters, a plot costs about USD 450,000–900,000 at an assumed USD 30–60 per square meter in an Asian industrial park, and USD 900,000–1.8 million at an assumed USD 60–120 on a U.S. or EU site.
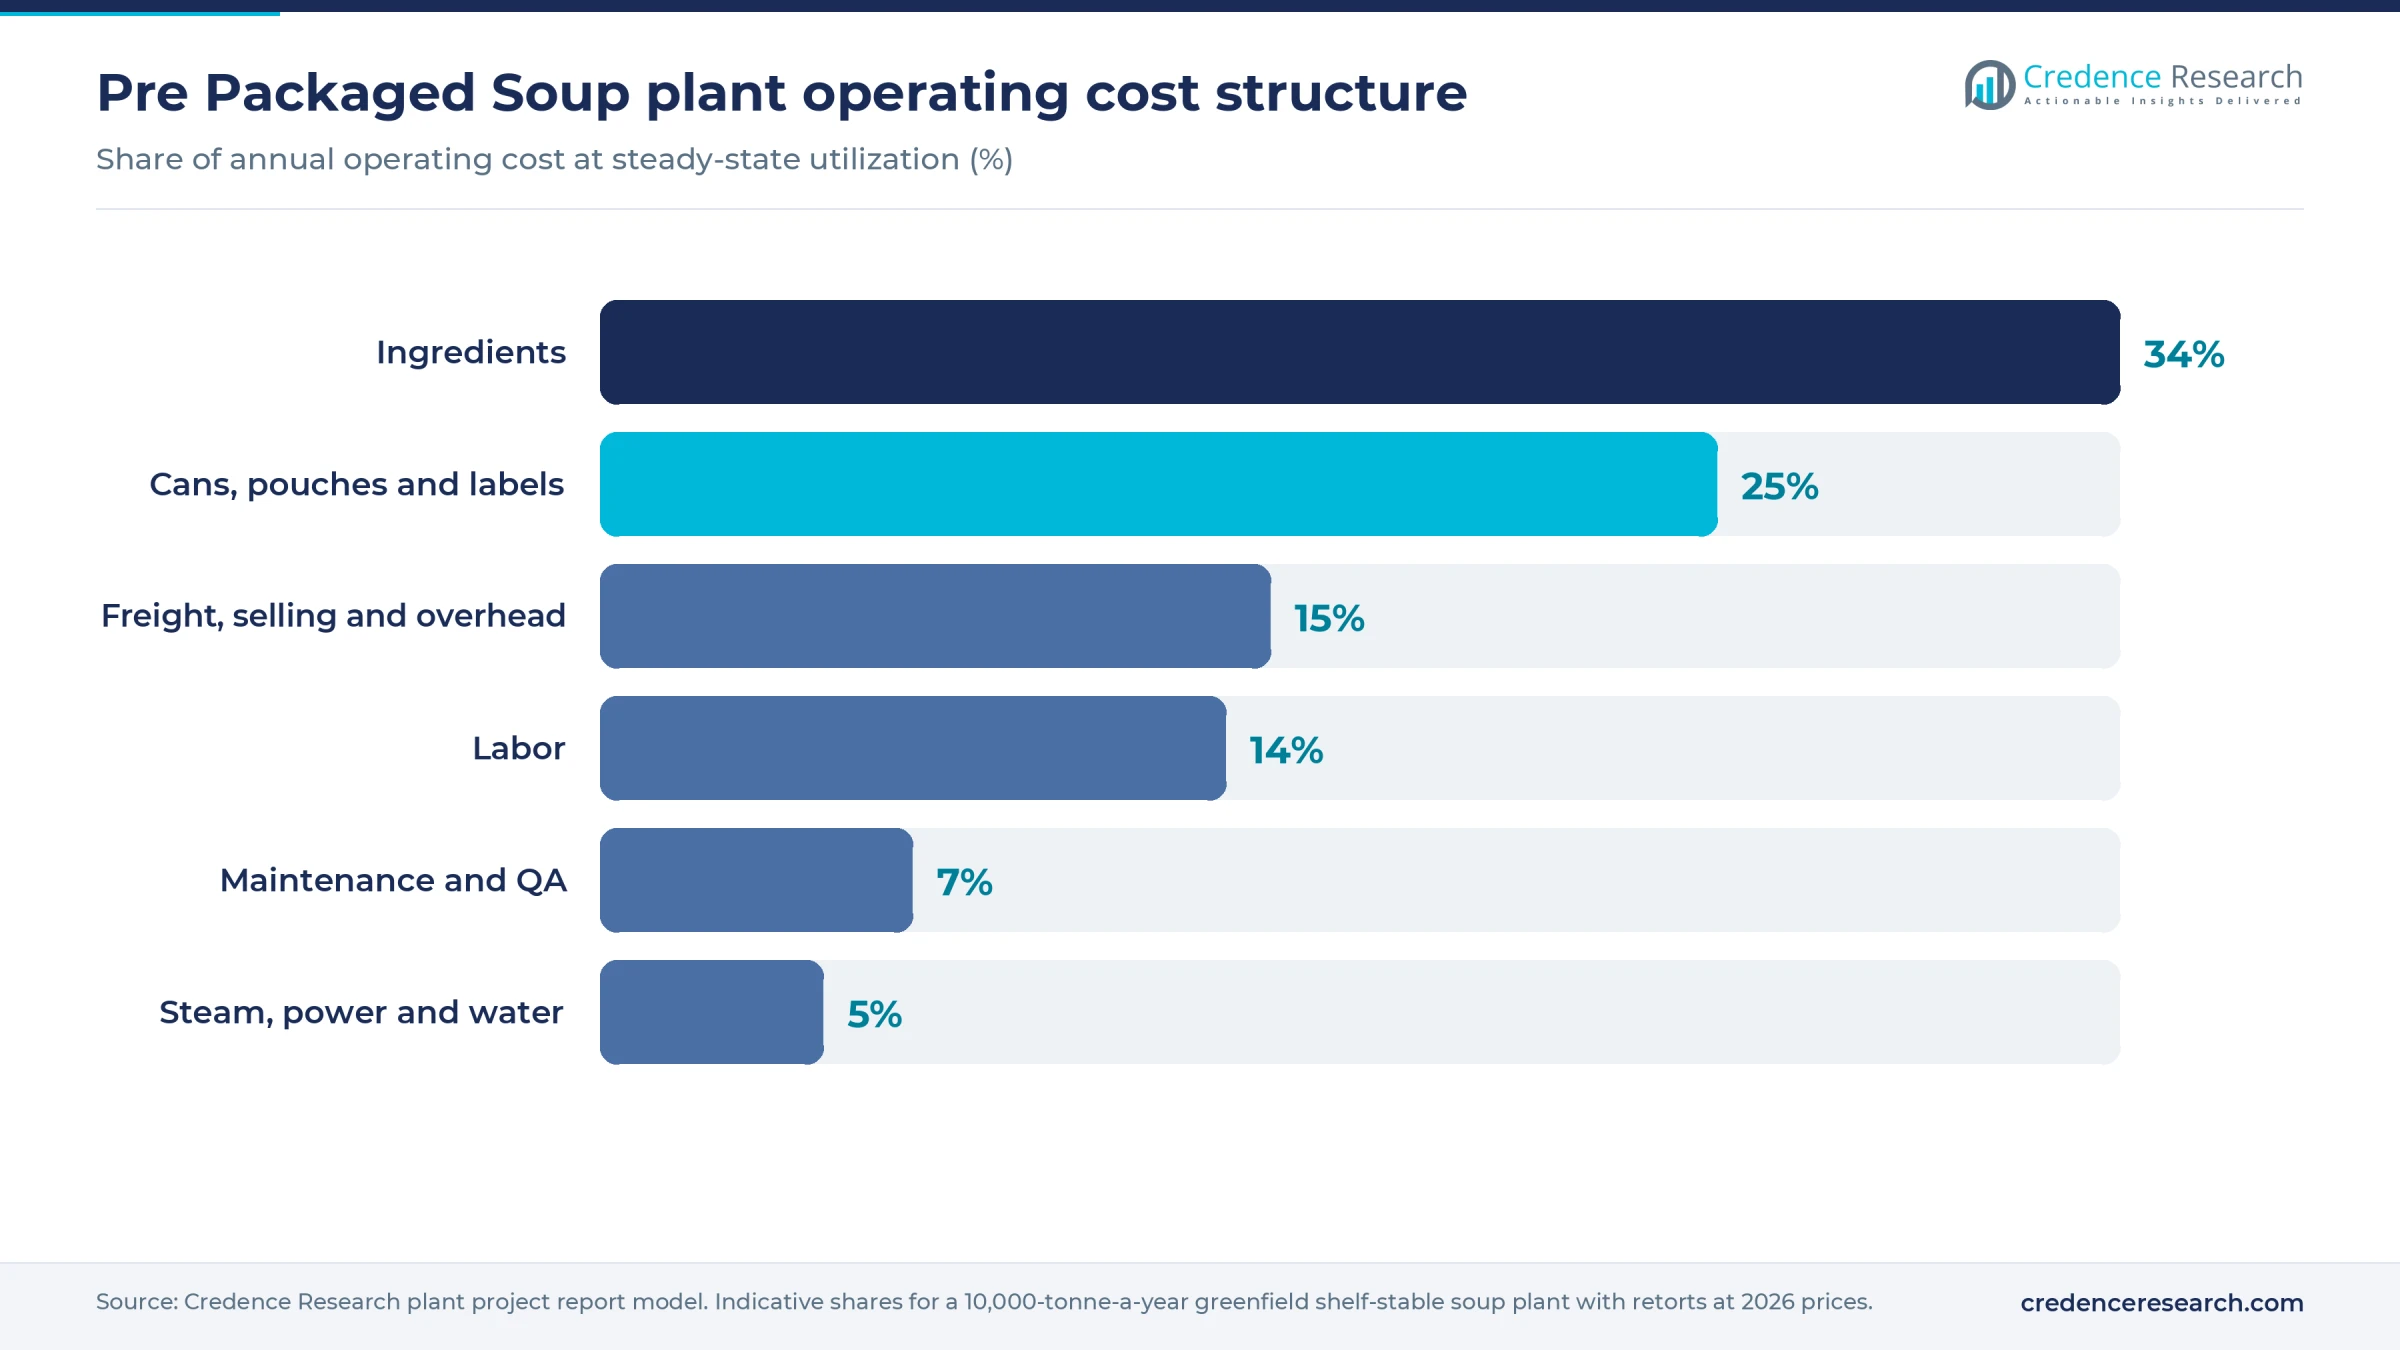
Ingredients are the largest operating cost, followed by packaging, because a steel can and label cost about three-quarters as much as the soup inside in the modeled recipe mix. The full report can be customized to any country or region.
Machinery and raw materials for a pre-packaged soup plant
The core machinery for a retort soup line includes:
- Vegetable washers, peelers, dicers and a blancher, plus a meat cooker and dicer
- Steam-jacketed kettles with agitators, a homogenizer and batch weighing stations
- Can depalletizer and rinser, particulate and liquid fillers, double seamer and pouch sealer
- Batch or continuous rotary retorts with temperature recorders
- Can dryer, seam inspection, checkweigher, labeler, case packer and palletizer
- Boiler, water treatment, cooling tower, clean-in-place system and effluent treatment
Machine costs and specifications are in the full report. Retort choice is the main trade-off. Batch retorts cost less and handle short runs of many can sizes, while continuous rotary retorts shorten cook times and cut steam use on long runs of one size.
Raw material sourcing is global, but most inputs are bulky, so plants buy close to home where they can. Tomato paste, the base of many soups, comes mainly from California, China, Italy, Spain and Turkey. Dehydrated onion, garlic and vegetables are shipped largely from China, India and Egypt. Chicken and beef come from the United States, Brazil, the EU and Australia, and cream and dairy powders from the EU, New Zealand and the United States. Tinplate for cans is rolled in China, Japan, South Korea, Europe and the United States, a supply chain covered in the canned food packaging market report.
Pre-packaged soup business profit margin and ROI
Soup margins depend on format and label. Branded condensed and premium soups earn the most per kilogram, while private-label ready-to-serve cans compete on prices retailers set. The model assumes a blended net ex-factory price of USD 2.00–2.60 per kg, below the 2024 world export unit value of about USD 2.85 per kg, which is lifted by higher-value bouillon and dry mixes. That yields about USD 15.0–19.5 million of sales on 7,500 tonnes.
Assumed direct cost is about USD 1.55 per kg, covering ingredients near USD 0.62, cans, pouches and labels near USD 0.45, and labor, steam, power and quality control near USD 0.48. That gives an estimated gross margin of 22–40%. After overheads, selling cost and freight at about 12% of sales, cash profit is an estimated USD 1.6–5.5 million a year.
Payback is estimated at 3–8 years including about a year of ramp-up. A high-cost site earning only the low-end margin would take far longer, one reason many new soup brands start with co-packers before building their own plant.
Selling price is the most sensitive variable. A 10% price cut takes about 7–9 percentage points from gross margin, while a 20% rise in can prices takes about 3 points.
| Metric | Value |
|---|---|
| IRR | Available in report |
| NPV | Available in report |
| ROI | Available in report |
| DSCR | Available in report |
How to start a pre-packaged soup business, licenses and approvals
Starting a soup plant follows a similar sequence in most countries: register the business and tax accounts, confirm zoning and building permits, and obtain an environmental permit or discharge consent for wash water and retort cooling water. Next come safety and pressure vessel approvals for the boiler, kettles and retorts, food facility registration or licensing, a hazard-based food safety plan, a thermal process validated by a recognized process authority for each low-acid product, allergen and nutrition labeling, and import-export registration for shipments abroad.
| Market | Food and product rules | Site and other permits |
|---|---|---|
| United States | FDA food facility registration; food canning establishment registration and a process filing for each low-acid soup under 21 CFR Parts 108 and 113; preventive controls under 21 CFR Part 117; USDA FSIS inspection instead of FDA for soups with 2% or more cooked meat or poultry or more than 3% raw meat | Local zoning and building permits; wastewater pretreatment permit from the local utility; OSHA rules |
| European Union | Food business registration under Regulation (EC) No 852/2004, plus approval under Regulation (EC) No 853/2004 if the plant handles raw meat or other unprocessed animal products; labeling under Regulation (EU) No 1169/2011; can and pouch materials under Regulation (EC) No 1935/2004 | National environmental and building permits; national pressure equipment and worker safety rules |
| India | FSSAI license under the Food Safety and Standards Act, 2006; Legal Metrology packer registration | State pollution control board consents to establish and operate; factory license; boiler registration with the state boiler inspectorate; Import Export Code for exports |
Retailers usually also require GFSI-benchmarked certification such as BRCGS, FSSC 22000 or SQF, plus halal or kosher certification where relevant. Requirements vary locally, and the full report lists the steps for a chosen country.
Key pre-packaged soup manufacturers and recent developments
Global supply is led by a few branded groups. The Campbell's Company makes Campbell's, Swanson and Pacific Foods soups and broths, with large plants in Maxton, North Carolina, and Napoleon, Ohio. General Mills owns Progresso, Unilever sells Knorr soups and bouillon worldwide, Nestlé makes Maggi, and Ajinomoto produces Knorr cup soups in Japan. GBfoods owns Gallina Blanca in Spain, Kraft Heinz makes Heinz soups in the UK, and Baxters Food Group makes canned soups in Scotland. Own-label soups are often made by co-packers.
Three developments from the past year show where the industry is investing:
- December 2025. Unilever announced a PLN 90 million investment in the dry foods unit of its Poznan, Poland, plant, which makes Knorr and Amino products, adding an automated line for Polish and export markets.
- January 2026. The Compleat Food Group completed its purchase of Greencore's sauces and soups business, a Bristol plant of about 50,000 square feet that makes own-label chilled soups for UK retailers.
- June 2026. The Campbell's Company opened an 88,000-square-foot expansion at Maxton with two aseptic filling lines, raising the site's soup and broth capacity by 20%.
What's inside the Pre Packaged Soup project report PDF
The report runs to 21 chapters. Open a chapter to see its sections.
1. Preface
2. Scope and Methodology
- 2.1 Objectives of the Study
- 2.2 Stakeholders
- 2.3 Research Methodology
- 2.4 Data Sources and Key Assumptions
3. Executive Summary
- 3.1 Market Snapshot
- 3.2 Project at a Glance (Capacity, CapEx, OpEx)
- 3.3 Key Financial Indicators (IRR, NPV, Payback, Break-even)
- 3.4 Feasibility Verdict
4. Product Overview
- 4.1 Pre Packaged Soup Definition and Properties
- 4.2 Grades and Specifications (BIS / ISO / ASTM)
- 4.3 HS Code and Classification
- 4.4 Key Applications
- 4.5 Substitutes
5. Global Pre Packaged Soup Market
- 5.1 Market Overview
- 5.2 Historical and Current Market Performance (Volume and Value)
- 5.3 Market Breakup by Grade / Type
- 5.4 Market Breakup by End-Use Industry
- 5.5 Market Breakup by Region
- 5.6 Market Drivers, Restraints and Trends
- 5.7 Value Chain Analysis
- 5.8 Market Forecast
6. Target Country Pre Packaged Soup Market Analysis
- 6.1 Demand and Supply Analysis
- 6.2 Installed Capacity vs Demand Gap
- 6.3 Import Dependence
- 6.4 Demand Forecast by End-Use
7. Trade Analysis
- 7.1 Imports by Volume, Value and Country
- 7.2 Exports by Volume, Value and Country
- 7.3 Trade Balance and Opportunities
8. Price Analysis
- 8.1 Historical Pre Packaged Soup Price Trends by Region
- 8.2 Raw Material / Feedstock Price Trends and Linkage
- 8.3 Price Forecast
- 8.4 Margins Across the Value Chain
9. Competitive Landscape
- 9.1 Market Structure
- 9.2 Key Players and Installed Capacities
- 9.3 Profiles of Key Players
- 9.4 Recent Developments (Expansions, M&A, New Plants)
10. Manufacturing Process and Technology
- 10.1 Comparison of Technology Routes
- 10.2 Selected Route and Process Flow Diagram
- 10.3 Unit Operations Involved
- 10.4 Chemical Reactions Involved
- 10.5 Mass Balance and Raw Material Requirements
- 10.6 Energy Balance
- 10.7 Quality Assurance Criteria and Technical Tests
- 10.8 By-products and Waste Handling
- 10.9 Technology Licensors / Providers
11. Project Details, Requirements and Costs
- 11.1 Land, Location and Site Development
- 11.1.1 Site Selection Criteria
- 11.1.2 Location Analysis
- 11.1.3 Land Requirement and Costs
- 11.1.4 Site Development Costs
- 11.2 Plant Layout
- 11.2.1 Layout Principles
- 11.2.2 Proposed Layout
- 11.2.3 Factors Influencing Layout
- 11.3 Civil Works and Buildings
- 11.4 Plant Machinery
- 11.4.1 Machinery Requirements and Specifications
- 11.4.2 Machinery Costs
- 11.4.3 Machinery Suppliers
- 11.5 Raw Materials
- 11.5.1 Requirements per Tonne of Output
- 11.5.2 Procurement and Sourcing
- 11.5.3 Costs
- 11.5.4 Suppliers
- 11.6 Packaging
- 11.6.1 Packaging Requirements
- 11.6.2 Packaging Costs
- 11.6.3 Packaging Suppliers
- 11.7 Storage and Material Handling
- 11.8 Transportation Requirements and Costs
- 11.9 Utilities
- 11.9.1 Power Requirements and Costs
- 11.9.2 Water Requirements and Costs
- 11.9.3 Steam, Fuel and Other Utilities
- 11.10 Manpower Requirements and Wages
12. Environment, Health, Safety and Sustainability
- 12.1 Effluent and Emissions Management
- 12.2 Hazard Classification and Safety Measures
- 12.3 Carbon Footprint
- 12.4 Green / Low-Carbon Process Options
13. Regulatory Procedures, Approvals and Certifications
- 13.1 Licences and Registrations
- 13.2 Environmental Clearances
- 13.3 Product Certifications (BIS, REACH, etc.)
- 13.4 Approval Timeline
14. Project Implementation Schedule
15. Project Economics
- 15.1 Capital Cost of the Project
- 15.2 Techno-Economic Parameters
- 15.3 Capacity Utilization and Ramp-up
- 15.4 Product Pricing and Margins
- 15.5 Income Projections
- 15.6 Expenditure Projections
- 15.7 Working Capital Requirement
- 15.8 Taxation
- 15.9 Depreciation
16. Financial Analysis
- 16.1 Projected Profit and Loss Account
- 16.2 Projected Cash Flow Statement
- 16.3 Projected Balance Sheet
- 16.4 Liquidity Analysis
- 16.5 Profitability Analysis (Payback, NPV, IRR, ROI)
- 16.6 Break-even Analysis
- 16.7 Debt Service Coverage Ratio (DSCR)
- 16.8 Sensitivity Analysis
- 16.9 Scenario and Uncertainty Analysis
17. Funding and Incentives
- 17.1 Means of Finance and Debt-Equity Structure
- 17.2 Loans and Financial Assistance
- 17.3 Government Schemes and Subsidies (PLI, State Policies)
18. Risk Assessment
- 18.1 Key Success Factors
- 18.2 Key Risk Factors
- 18.3 Risk Mitigation
19. Strategic Recommendations
20. Case Study of a Successful Venture
21. Appendix
- 21.1 Detailed Assumptions
- 21.2 Abbreviations
- 21.3 List of Tables and Figures
- 21.4 Sources
This page vs. the full report
| Data point | On this page (free) | In the full report |
|---|---|---|
| Total CapEx | One rounded range at one capacity | Exact figure at three capacities with a line-item breakup |
| CapEx breakup | Category shares (%) only | Cost, quantity and supplier for every machine |
| Operating cost | Share of raw materials, utilities and labor | Per-unit cost sheet with each input price and consumption |
| Profitability | Gross margin range and payback band | Exact IRR, NPV, ROI, break-even and DSCR |
| Financial statements | List of what is included | 10-year P&L, cash flow, balance sheet and Excel model |
| Sensitivity | One directional line | Full sensitivity and scenario tables |
| Process | Simplified flow diagram | Detailed process flow, mass and energy balance, operating conditions |
| Machinery | Names of the main machines | Specifications, capacity, cost and supplier list |
| Market | Headline size, growth and global demand | Segment, region, trade and price forecast tables |
| Suppliers and buyers | Supplier types and sourcing hubs | Named suppliers and buyers |
Pre Packaged Soup project report: FAQs
How much does a pre-packaged soup plant cost?
What is the profit margin in soup manufacturing?
How long is the payback for a soup plant?
Why do canned soups need a retort?
Which raw materials does a soup plant need?
What licenses does a soup manufacturing plant need?

About the analyst
Priyanka Mor, Senior Consultant
Senior Consultant at Credence Research Inc directing strategic market advisory, cross-border commercial due diligence and enterprise intelligence frameworks for global B2B clients. Combines quantitative modeling with executive advisory, translating macroeconomic variables and supply chain data into go-to-market blueprints, M&A screenings and competitive war-gaming strategies.
Related market research
- Packaged Soup Market Size, Growth, Share and Forecast 2032
- Refrigerated and Frozen Soup Market Size & Forecast 2032
- Bouillon Cube Market Size, Growth and Forecast 2032
- Canned Food Packaging Market Size, Growth and Forecast 2032
- Bone Broth Protein Market Size, Share, Trends and Forecast 2032
- Ready Meals Market Size, Growth, Share and Forecast 2032
More plant project reports
- Green Beans Processing Plant Project Report (DPR) 2026
- Peanut Butter Manufacturing Plant Project Report (DPR) 2026
- Banana Powder Manufacturing Plant Project Report (DPR) 2026
- Instant Noodles Manufacturing Plant Project Report (DPR) 2026
- Cashew Processing Plant Project Report (DPR) 2026
- Ginger Processing Plant Project Report (DPR) 2026