
Quick answer
A peanut butter plant roasts, blanches and grinds shelled peanuts with salt, sugar and a stabilizer, then deaerates the paste and fills it into jars or bulk drums. This overview models a greenfield plant making 10,000 tons a year, with estimated CapEx of USD 6–20 million depending on cost region and automation. Gross margin is estimated at 22–37%, with payback in 2.5–6 years, because kernel prices set most of the economics.
Viable for a plant with secure access to certified low-aflatoxin kernels and a private-label or bulk paste contract, but risky as a branded launch against entrenched national brands.
Peanut Butter plant: key highlights
| Parameter | Indicative value | Note |
|---|---|---|
| Plant capacity | 10,000 tons a year | About 8,000 tons sold at 80% utilization, one line of about 2 tons an hour |
| Total CapEx | USD 6–20 million | Greenfield plant, excludes USD 2–3 million working capital |
| Raw material share of operating cost | 53–59% | Peanut kernels, salt, sugar and stabilizer; packaging adds about 16% |
| Gross margin | 22–37% | After ingredients, packaging and direct conversion |
| Payback period | 2.5–6 years | Includes about one year of ramp-up; depends on site cost and kernel price |
| IRR | Available in report | Post-tax, 10-year model |
| Break-even | Available in report | Capacity utilization basis |
Ranges assume a 10,000-ton-a-year greenfield peanut butter plant with one 2-ton-an-hour line, two shifts on 300 days, 80% utilization and 2026 prices, in an Asian industrial park at the low end and a U.S. or EU site at the high end. Kernels are priced near spring 2026 U.S. broker quotes; the USD 2.50–3.10 per kg selling price and all packaging, wage, building and land rates are assumed. The full report can be customized to any country or region.
What is peanut butter?
Peanut butter is a paste made by grinding shelled, roasted peanuts, usually blanched to remove the skins, with small amounts of salt, sugar and an oil stabilizer that keeps the natural oil from separating. Plants make creamy and crunchy jars, natural no-stir products without hydrogenated fat, reduced-fat and flavored spreads, and bulk paste in drums and totes for bakeries, confectioners and snack makers.
Rules shape the recipe. Under the U.S. standard of identity in 21 CFR 164.150, seasonings and stabilizers may make up no more than 10% of the finished weight, fat may not exceed 55%, and artificial sweeteners, preservatives and colors are not allowed, so products outside those limits are sold as peanut butter spreads. India's food regulator sets its own standard, including at least 25% protein and 40% fat on a dry basis.
For customs, peanut butter falls under Harmonized System subheading 2008.11, ground-nuts prepared or preserved, and the UK tariff gives it a separate commodity code 2008 11 10. Buyers are supermarkets, many of them buying own-label, along with food manufacturers, school and institutional caterers, and aid agencies that buy peanut-based therapeutic pastes.
Peanut butter market overview and global demand
Credence Research does not publish a stand-alone peanut butter market report. It values the broader global sweet spread market, the shelf where peanut butter competes with jams, honey and chocolate spreads, at USD 30.13 billion in 2024 and projects USD 42.65 billion by 2032, a 4.44% CAGR. Carried forward at that rate, the category would be about USD 31.5 billion in 2025, a figure derived from the 2024 base rather than separately reported.
The United States is the most closely measured market. USDA National Agricultural Statistics Service data show U.S. manufacturers used 1.47 billion pounds of shelled edible peanuts, about 666,000 metric tons, in peanut butter from August 2024 to July 2025. That was up 1.0% from a year earlier and about 63% of all edible-grade peanut use. Trade data suggest U.S. exports under HS 2008.11, a code that also covers other prepared peanuts, were roughly 80,000 tons in 2024, with Canada and Mexico the largest buyers.
Raw peanut supply is large but mostly consumed where it grows. USDA Foreign Agricultural Service estimates from November 2026 put world production at about 50.0 million metric tons in 2026/27, with China at 18.0 million and India at 7.5 million, while world exports are only about 4.6 million tons. University of Georgia economists rank the United States fourth among producers, with a 2025 crop of about 3.4 million tons, and fourth among exporters behind India, Argentina and China.
Outside North America, demand is growing from a lower base. Europe imports nearly all of its peanuts and relies on processors in the Netherlands and the UK, Australia and New Zealand support strong local brands, and in India peanut butter has moved from an imported niche to a protein product pushed by fitness-focused brands. For a new plant, the real test is steady access to certified low-aflatoxin kernels and a private-label or bulk paste contract.
Peanut butter manufacturing process
The modeled plant runs one continuous line of about 2 tons an hour on two shifts. The process is short, but each step controls either flavor or one of the two hazards that matter most in peanuts, aflatoxin and Salmonella.
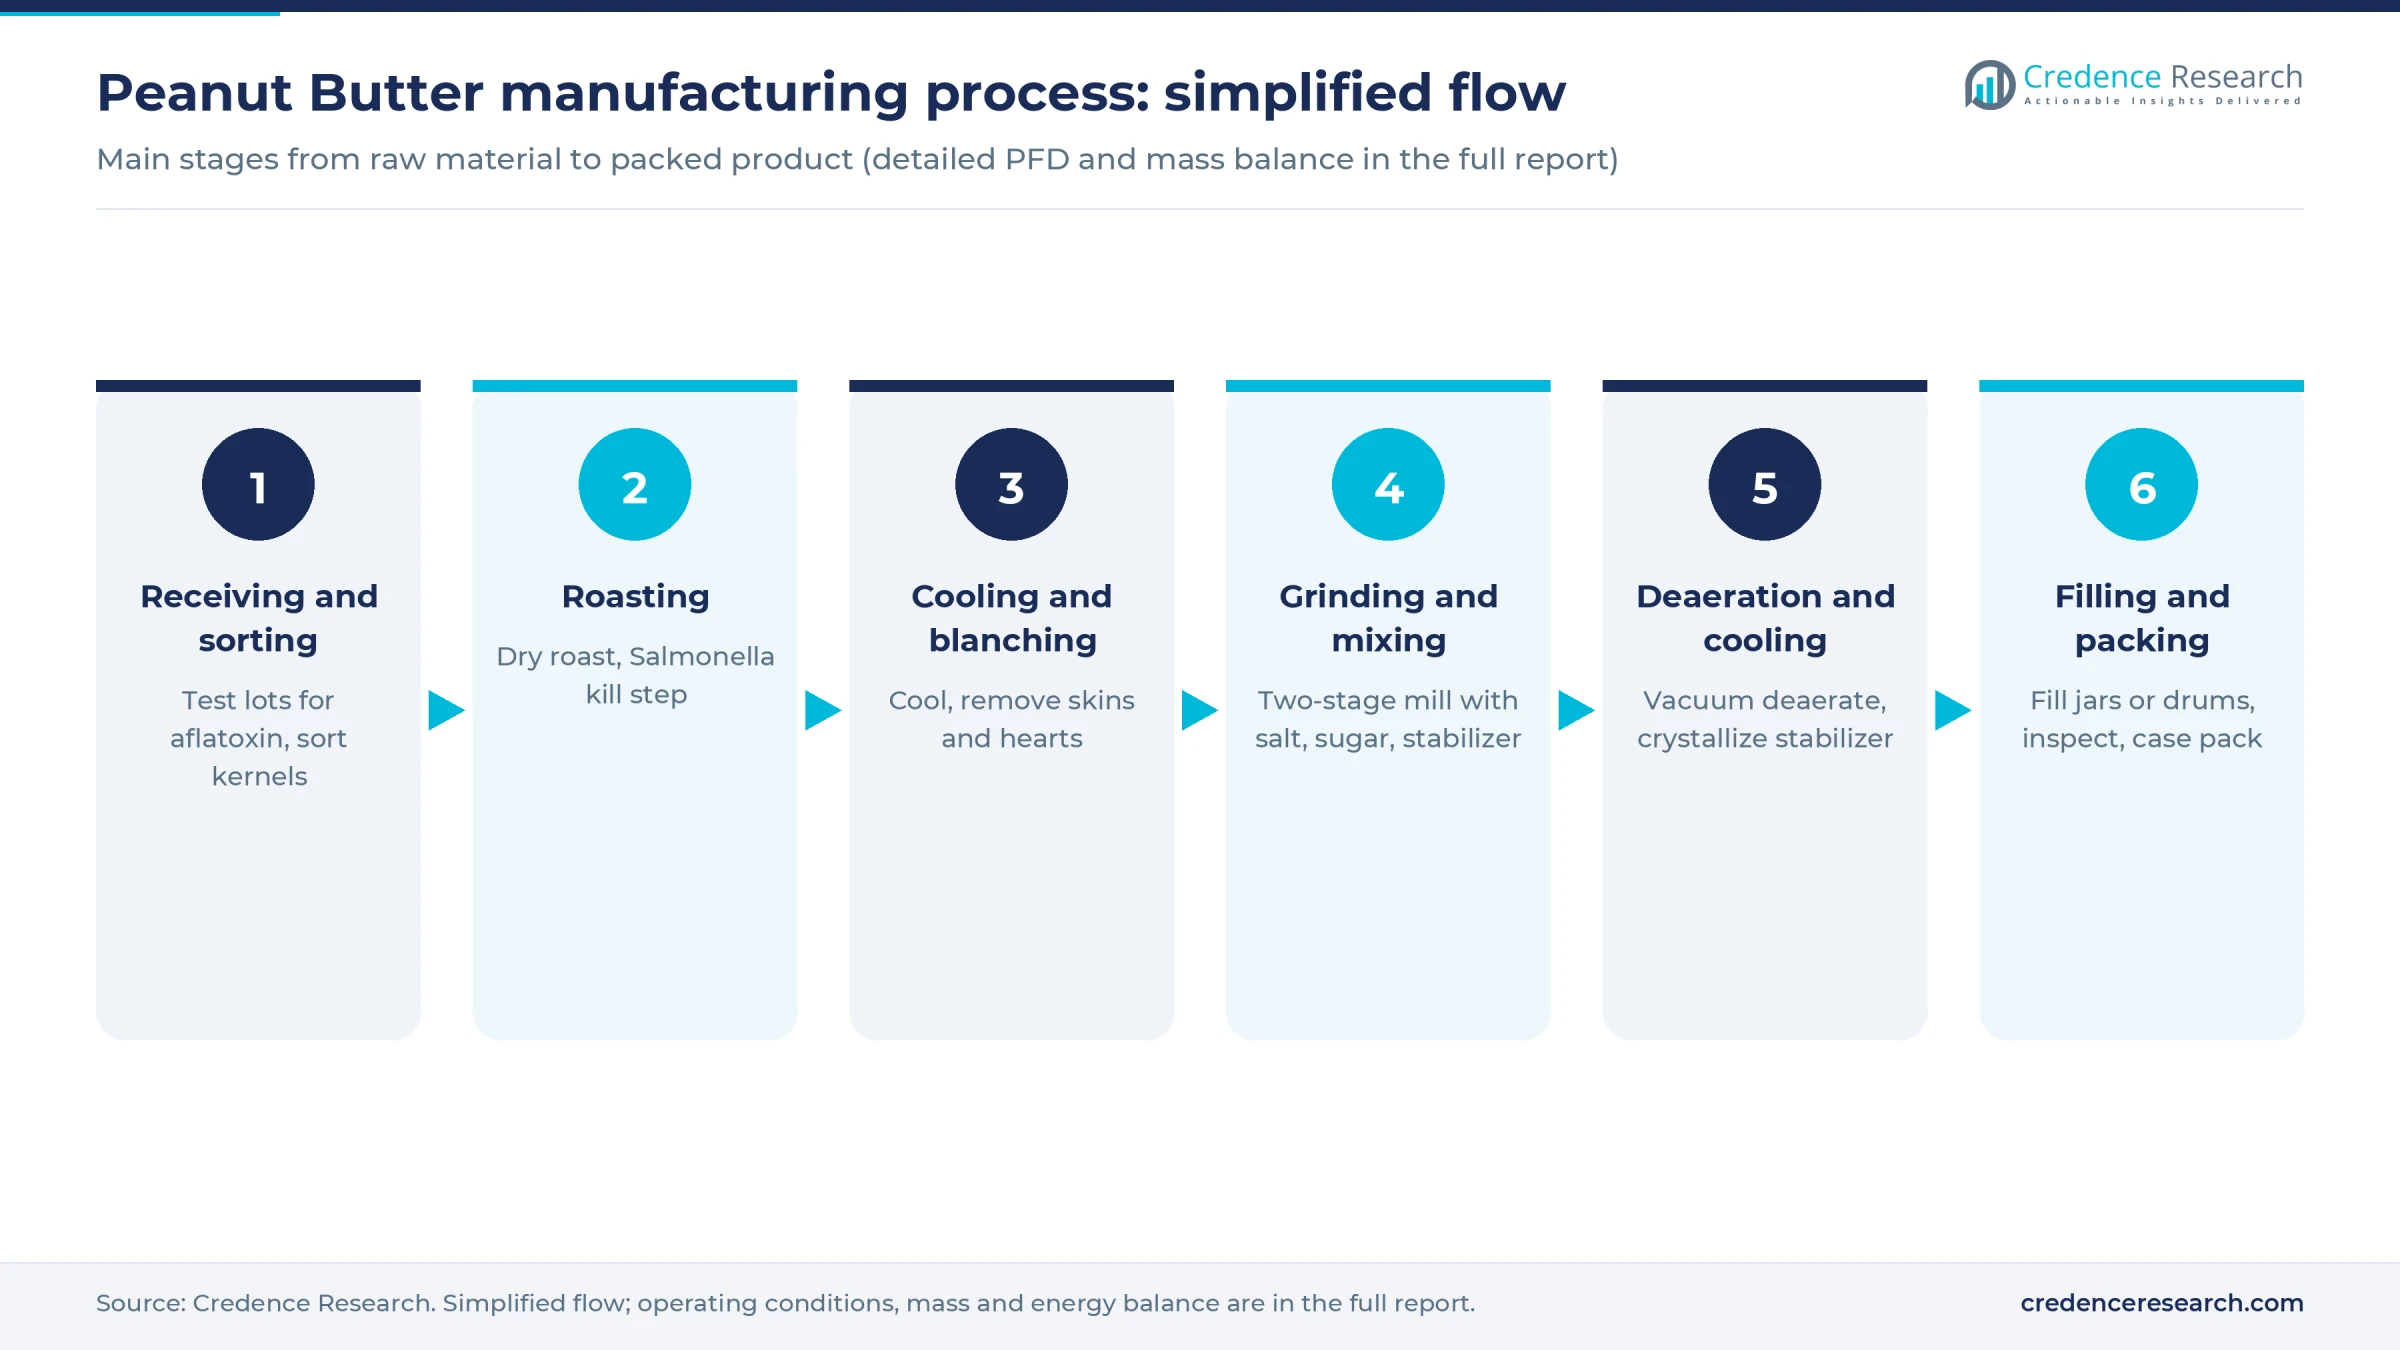
- Receiving and sorting. Shelled kernels arrive in bulk bags or totes with an aflatoxin certificate for each lot, and the plant retests. Optical color sorters and picking belts remove discolored, shriveled and moldy kernels, which carry most of the toxin.
- Roasting. Kernels are dry roasted in batch or continuous roasters, at about 160°C for 40–60 minutes in published small-plant designs, to build flavor and cut moisture to about 1%. Roasting is also the validated kill step for Salmonella.
- Cooling and blanching. Hot kernels are cooled fast to stop the roast, then blanchers rub off the red skins and split out the bitter hearts. A second sort removes scorched and skin-on pieces.
- Grinding and mixing. A two-stage mill reduces kernels to a coarse, then fine paste while salt, sugar and a stabilizer such as hydrogenated vegetable oil are dosed in. Crunchy grades get chopped roasted peanuts after grinding.
- Deaeration and cooling. The paste is deaerated under vacuum to limit oxidation and air pockets, then cooled in a scraped-surface heat exchanger so the stabilizer crystallizes and holds the oil in place.
- Filling and packing. Jars are filled, capped, induction sealed, coded and checked by metal detector or X-ray, then left to set undisturbed before case packing. Bulk paste goes into lined drums or totes.
Hygiene after roasting decides a plant's reputation. The 2008–09 Salmonella outbreak traced to a peanut processor in Blakely, Georgia, and the May 2022 Jif recall linked to the Lexington, Kentucky, plant both involved contamination after the kill step. Plants therefore separate raw and roasted zones, keep the roasted side dry and swab the environment routinely. Roast profiles, grind settings and yields are in the full report.
Peanut butter plant setup cost
This overview models a greenfield plant rated at 10,000 tons of peanut butter a year, about 22 million pounds, on one line running two shifts on 300 days and selling about 8,000 tons at 80% utilization. Estimated CapEx is USD 6–20 million before about USD 2–3 million of working capital, most of it tied up in kernel stocks. The low end reflects an Asian industrial park and the high end a U.S. or EU site with full automation and X-ray inspection.
The range is checked against a disclosed U.S. project. When private-label maker Golden Boy Foods expanded its Troy, Alabama, plant in 2020, it put USD 13.3 million into equipment while the city's industrial development board spent USD 12.5 million on land and a new 170,000-square-foot building, to lift peanut butter output by 150%. That works out to about USD 790 per square meter for land and building at 2020 prices. The model uses an assumed USD 400 per square meter in Asia and USD 1,300 in the U.S. or EU for a 5,000-square-meter hygienic building. Basic grinding lines are listed online for under USD 100,000, but a retail-grade line with sorting, deaeration, filling and inspection costs far more, so the model assumes USD 2.4–8.0 million for all process and packing equipment, a judgment rather than a quoted price.
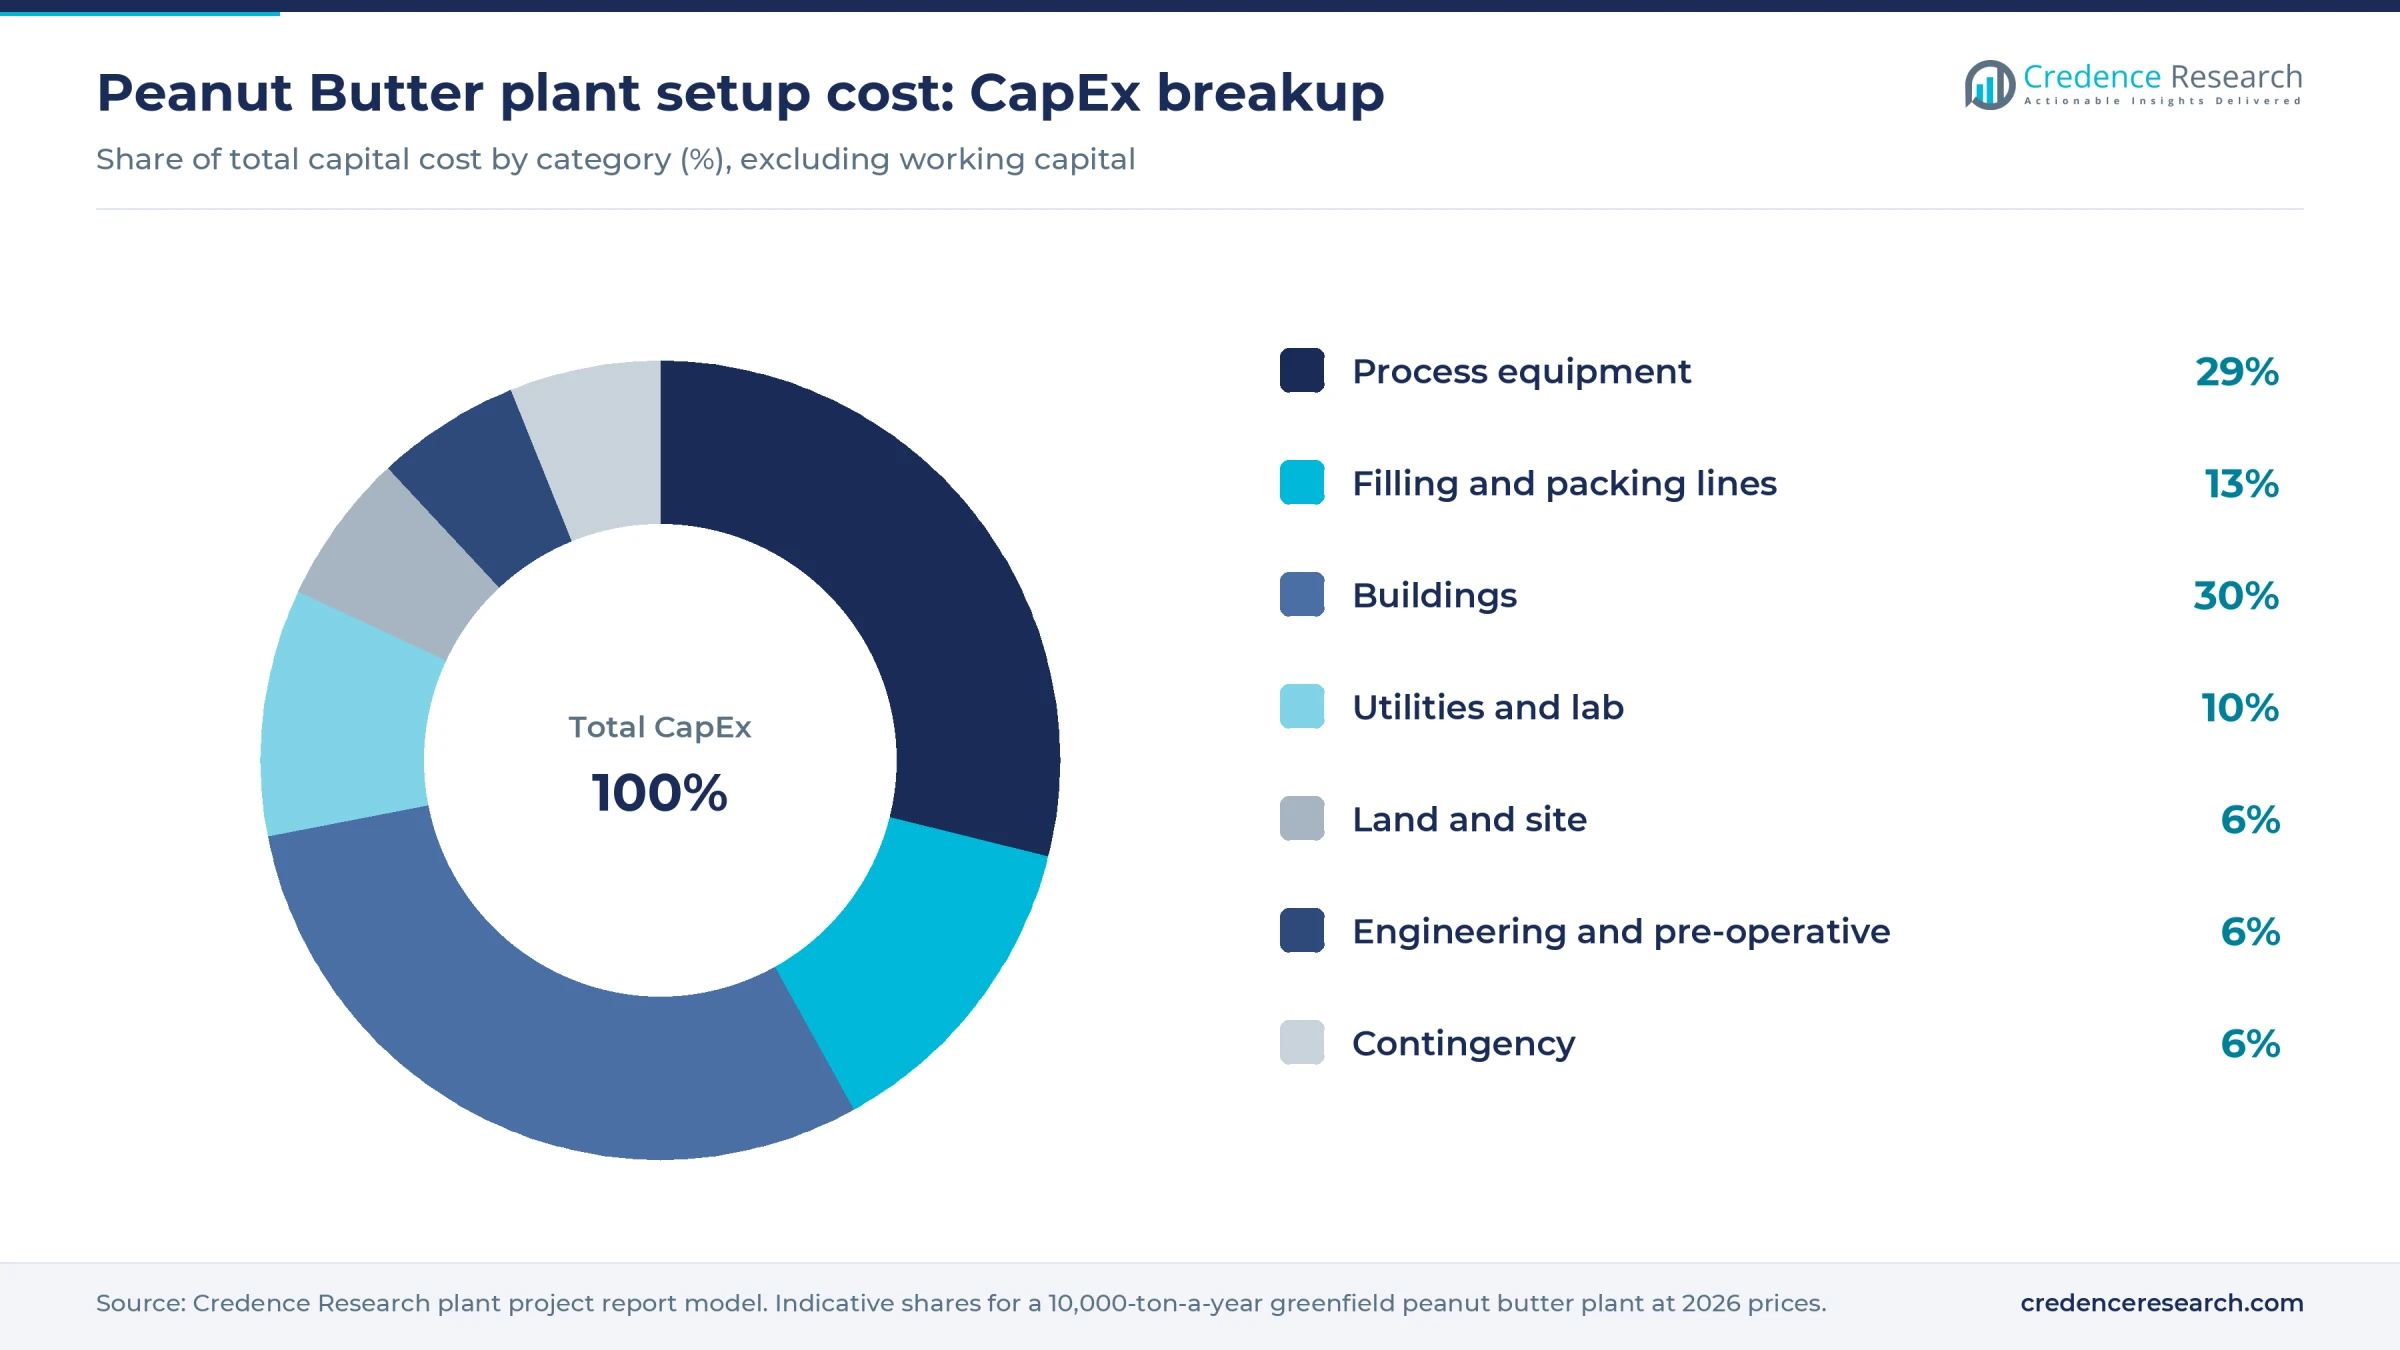
Equipment takes about 42% of CapEx and buildings about 30%. Land shows how location moves the total. At an assumed 15,000 square meters, a plot costs about USD 450,000–900,000 at an assumed USD 30–60 per square meter in an Asian industrial park, and USD 900,000–1.8 million at an assumed USD 60–120 on a U.S. or EU site.
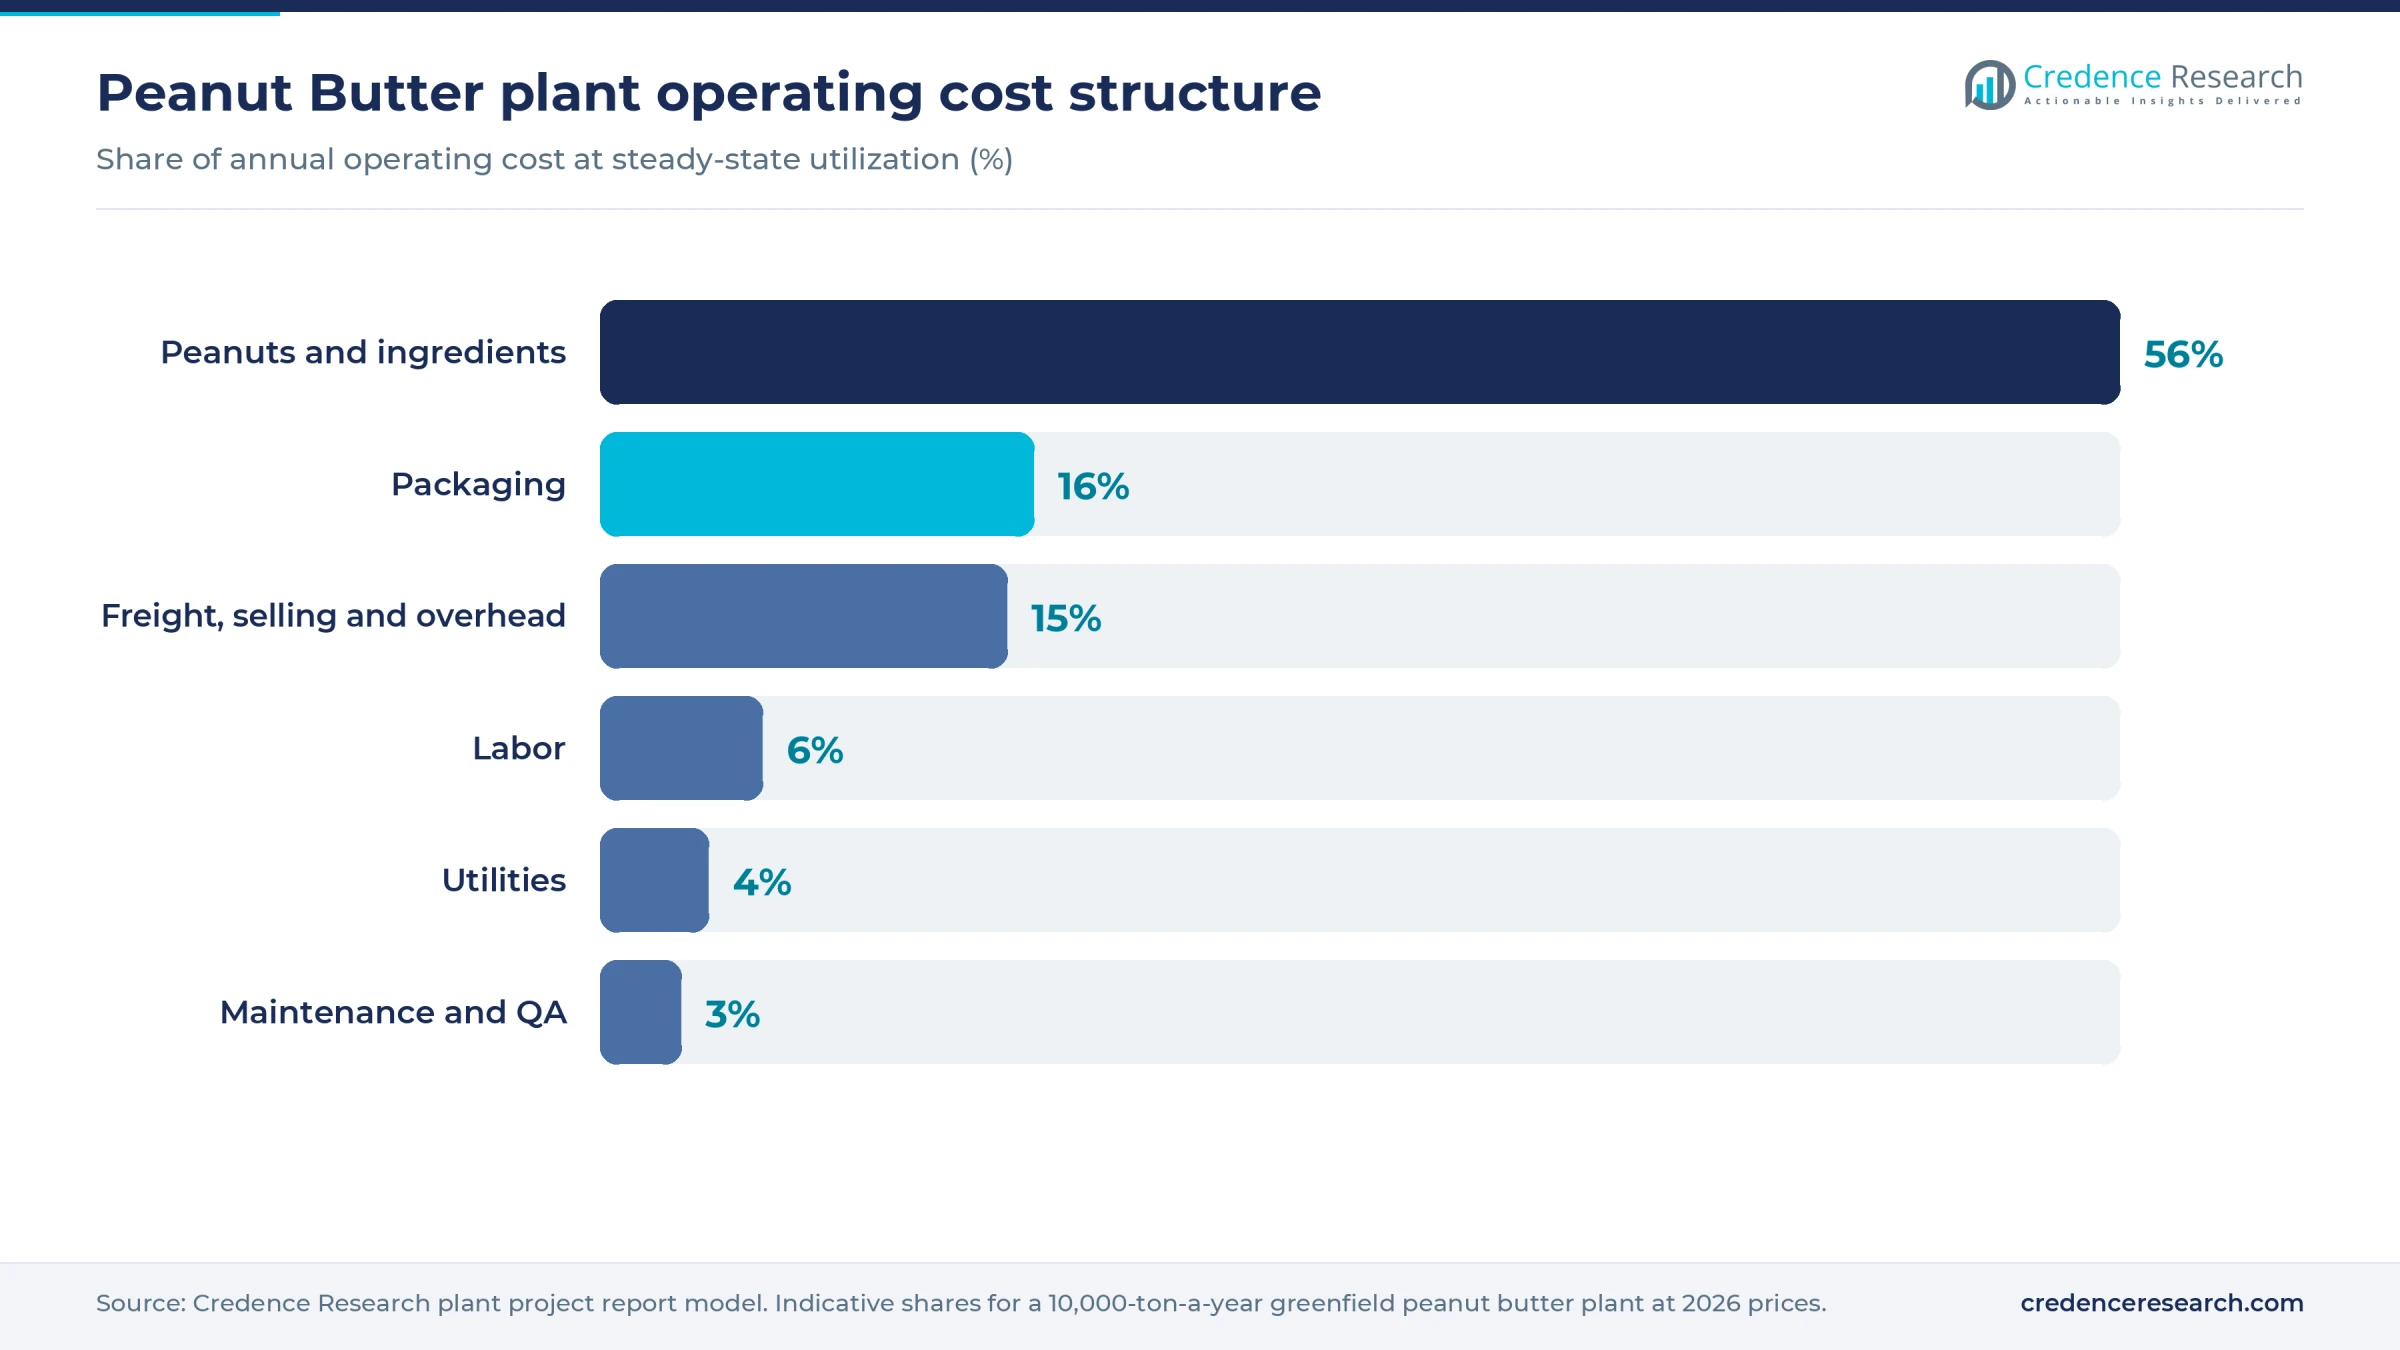
Peanut kernels dominate operating cost, so the plant's buying strategy matters more than its wage rate. Jars, lids and labels come second. The full report can be customized to any country or region.
Machinery and raw materials for a peanut butter plant
The core machinery for a 2-ton-an-hour line includes:
- Bulk bag unloaders, destoner, optical color sorter and picking table
- Batch or continuous roaster with cooler and fume control
- Blancher and heart separator
- Two-stage grinding mills, ingredient dosing and mixing tanks
- Vacuum deaerator, scraped-surface heat exchanger and paste pumps
- Jar unscrambler, filler, capper, induction sealer, labeler, metal detector or X-ray, case packer and palletizer
- Drum and tote filling for bulk paste, plus a lab for aflatoxin, moisture and microbiology tests
Machine costs and specifications are in the full report. Optical sorting and in-house aflatoxin testing look optional on paper, but export buyers and large retailers increasingly expect both.
Raw material sourcing for peanut butter is global but narrower than world output suggests, because only certified edible grades work. Runner peanuts from the U.S. Southeast, led by Georgia, and from Argentina dominate supply for premium butter, and high-oleic varieties extend shelf life. China and India grow the most peanuts but ship mainly to Asian buyers, while Brazil and Nicaragua supply smaller export volumes. U.S. runner medium kernels traded at about USD 0.48–0.55 per pound in spring 2026 broker quotes, roughly USD 1,060–1,210 per ton. Salt, sugar and stabilizers are widely traded, and jars and lids are usually bought locally, a point that matters as buyers in the plant-based spreads market push for shorter ingredient lists.
Peanut butter business profit margin and ROI
Margin in peanut butter is mostly the gap between kernel cost and what buyers pay per jar. Branded makers earn more but spend heavily on promotion, while private-label and bulk paste suppliers compete on price. The model assumes a blended net ex-factory price of USD 2.50–3.10 per kg, below an approximate U.S. export value of roughly USD 3 per kg for HS 2008.11 products in 2024, which yields about USD 20–25 million of annual sales on 8,000 tons.
Assumed direct cost is about USD 1.95 per kg, covering kernels and ingredients near USD 1.28, packaging near USD 0.37 and conversion near USD 0.30. That gives an estimated gross margin of 22–37%. After overheads, selling cost and freight at about 12% of sales, cash profit is an estimated USD 2.0–6.2 million a year.
Payback is estimated at 2.5–6 years including about a year of ramp-up. A high-cost site earning only the low-end margin would take about 11 years, one reason many entrants start with bulk paste or co-packing before launching jars.
Kernel price is the sensitive variable. A 20% rise in kernel cost takes about 8–10 percentage points from gross margin, and a 10% cut in selling price takes about 7–9 points.
| Metric | Value |
|---|---|
| IRR | Available in report |
| NPV | Available in report |
| ROI | Available in report |
| DSCR | Available in report |
How to start a peanut butter business, licenses and approvals
Starting a peanut butter plant follows a common sequence in most countries: register the business and tax accounts, confirm zoning and building permits, and obtain an environmental permit for roaster emissions, dust and wash water. Next come occupational safety approvals for dust and roasters, food facility registration or licensing, a hazard-based food safety plan with a validated Salmonella kill step, aflatoxin testing of every kernel lot, peanut allergen labeling and import-export registration if the plant ships abroad.
| Market | Food and product rules | Site and other permits |
|---|---|---|
| United States | FDA food facility registration; preventive controls under 21 CFR Part 117; standard of identity at 21 CFR 164.150; FDA aflatoxin action level of 20 ppb; peanuts a major allergen under FALCPA | Edible peanuts must test at 15 ppb or less under USDA rules in 7 CFR Part 996; local zoning, air and wastewater permits; OSHA rules |
| European Union | Food business registration under Regulation (EC) No 852/2004; aflatoxin limits under Regulation (EU) 2023/915 of 2.0 µg/kg for B1 and 4.0 µg/kg in total for direct consumption; peanuts listed as an allergen under Regulation (EU) No 1169/2011 | National environmental and building permits; extra border checks on peanuts from several origins under Regulation (EU) 2019/1793 |
| India | FSSAI license, with a product standard for peanut butter; aflatoxin limits under FSSAI contaminant rules; allergen declaration under the 2020 labeling and display rules | State pollution control board consents; factory license; Legal Metrology packer registration; APEDA registration and aflatoxin testing for groundnut exports |
Retail buyers usually also require GFSI-benchmarked certification such as BRCGS or SQF. Requirements vary locally, and the full report lists the steps for a chosen country.
Key peanut butter manufacturers and recent developments
The largest makers are U.S. consumer food groups and private-label specialists. The J.M. Smucker Co. makes Jif in Lexington, Kentucky, Hormel Foods owns Skippy, and Post Holdings owns Peter Pan and private-label maker 8th Avenue Food & Provisions, while Golden Boy Foods supplies store brands from Alabama. In Europe, Dutch processor Bredabest agreed in September 2025 to join chocolate and spreads maker Natra, and UK brands such as Whole Earth and Manilife compete with supermarket own-label. Bega Group makes peanut butter in Port Melbourne, Australia, Pic's leads in New Zealand, and India's market includes Pintola, Alpino and Dr. Oetker's FunFoods.
Two developments from 2026 show where the industry is moving:
- March 2026. Smucker launched Jif Simply Unsweetened Creamy, a three-ingredient peanut butter spread made from peanuts, salt and palm oil, at Walmart, with a wider national rollout planned.
- April 2026. Ferrero opened a USD 75 million Nutella Peanut line in Franklin Park, Illinois, creating 50 jobs. It is the first Nutella product made in the U.S. and uses peanuts from Georgia and other Southeastern states.
What's inside the Peanut Butter project report PDF
The report runs to 21 chapters. Open a chapter to see its sections.
1. Preface
2. Scope and Methodology
- 2.1 Objectives of the Study
- 2.2 Stakeholders
- 2.3 Research Methodology
- 2.4 Data Sources and Key Assumptions
3. Executive Summary
- 3.1 Market Snapshot
- 3.2 Project at a Glance (Capacity, CapEx, OpEx)
- 3.3 Key Financial Indicators (IRR, NPV, Payback, Break-even)
- 3.4 Feasibility Verdict
4. Product Overview
- 4.1 Peanut Butter Definition and Properties
- 4.2 Grades and Specifications (BIS / ISO / ASTM)
- 4.3 HS Code and Classification
- 4.4 Key Applications
- 4.5 Substitutes
5. Global Peanut Butter Market
- 5.1 Market Overview
- 5.2 Historical and Current Market Performance (Volume and Value)
- 5.3 Market Breakup by Grade / Type
- 5.4 Market Breakup by End-Use Industry
- 5.5 Market Breakup by Region
- 5.6 Market Drivers, Restraints and Trends
- 5.7 Value Chain Analysis
- 5.8 Market Forecast
6. Target Country Peanut Butter Market Analysis
- 6.1 Demand and Supply Analysis
- 6.2 Installed Capacity vs Demand Gap
- 6.3 Import Dependence
- 6.4 Demand Forecast by End-Use
7. Trade Analysis
- 7.1 Imports by Volume, Value and Country
- 7.2 Exports by Volume, Value and Country
- 7.3 Trade Balance and Opportunities
8. Price Analysis
- 8.1 Historical Peanut Butter Price Trends by Region
- 8.2 Raw Material / Feedstock Price Trends and Linkage
- 8.3 Price Forecast
- 8.4 Margins Across the Value Chain
9. Competitive Landscape
- 9.1 Market Structure
- 9.2 Key Players and Installed Capacities
- 9.3 Profiles of Key Players
- 9.4 Recent Developments (Expansions, M&A, New Plants)
10. Manufacturing Process and Technology
- 10.1 Comparison of Technology Routes
- 10.2 Selected Route and Process Flow Diagram
- 10.3 Unit Operations Involved
- 10.4 Chemical Reactions Involved
- 10.5 Mass Balance and Raw Material Requirements
- 10.6 Energy Balance
- 10.7 Quality Assurance Criteria and Technical Tests
- 10.8 By-products and Waste Handling
- 10.9 Technology Licensors / Providers
11. Project Details, Requirements and Costs
- 11.1 Land, Location and Site Development
- 11.1.1 Site Selection Criteria
- 11.1.2 Location Analysis
- 11.1.3 Land Requirement and Costs
- 11.1.4 Site Development Costs
- 11.2 Plant Layout
- 11.2.1 Layout Principles
- 11.2.2 Proposed Layout
- 11.2.3 Factors Influencing Layout
- 11.3 Civil Works and Buildings
- 11.4 Plant Machinery
- 11.4.1 Machinery Requirements and Specifications
- 11.4.2 Machinery Costs
- 11.4.3 Machinery Suppliers
- 11.5 Raw Materials
- 11.5.1 Requirements per Tonne of Output
- 11.5.2 Procurement and Sourcing
- 11.5.3 Costs
- 11.5.4 Suppliers
- 11.6 Packaging
- 11.6.1 Packaging Requirements
- 11.6.2 Packaging Costs
- 11.6.3 Packaging Suppliers
- 11.7 Storage and Material Handling
- 11.8 Transportation Requirements and Costs
- 11.9 Utilities
- 11.9.1 Power Requirements and Costs
- 11.9.2 Water Requirements and Costs
- 11.9.3 Steam, Fuel and Other Utilities
- 11.10 Manpower Requirements and Wages
12. Environment, Health, Safety and Sustainability
- 12.1 Effluent and Emissions Management
- 12.2 Hazard Classification and Safety Measures
- 12.3 Carbon Footprint
- 12.4 Green / Low-Carbon Process Options
13. Regulatory Procedures, Approvals and Certifications
- 13.1 Licences and Registrations
- 13.2 Environmental Clearances
- 13.3 Product Certifications (BIS, REACH, etc.)
- 13.4 Approval Timeline
14. Project Implementation Schedule
15. Project Economics
- 15.1 Capital Cost of the Project
- 15.2 Techno-Economic Parameters
- 15.3 Capacity Utilization and Ramp-up
- 15.4 Product Pricing and Margins
- 15.5 Income Projections
- 15.6 Expenditure Projections
- 15.7 Working Capital Requirement
- 15.8 Taxation
- 15.9 Depreciation
16. Financial Analysis
- 16.1 Projected Profit and Loss Account
- 16.2 Projected Cash Flow Statement
- 16.3 Projected Balance Sheet
- 16.4 Liquidity Analysis
- 16.5 Profitability Analysis (Payback, NPV, IRR, ROI)
- 16.6 Break-even Analysis
- 16.7 Debt Service Coverage Ratio (DSCR)
- 16.8 Sensitivity Analysis
- 16.9 Scenario and Uncertainty Analysis
17. Funding and Incentives
- 17.1 Means of Finance and Debt-Equity Structure
- 17.2 Loans and Financial Assistance
- 17.3 Government Schemes and Subsidies (PLI, State Policies)
18. Risk Assessment
- 18.1 Key Success Factors
- 18.2 Key Risk Factors
- 18.3 Risk Mitigation
19. Strategic Recommendations
20. Case Study of a Successful Venture
21. Appendix
- 21.1 Detailed Assumptions
- 21.2 Abbreviations
- 21.3 List of Tables and Figures
- 21.4 Sources
This page vs. the full report
| Data point | On this page (free) | In the full report |
|---|---|---|
| Total CapEx | One rounded range at one capacity | Exact figure at three capacities with a line-item breakup |
| CapEx breakup | Category shares (%) only | Cost, quantity and supplier for every machine |
| Operating cost | Share of raw materials, utilities and labor | Per-unit cost sheet with each input price and consumption |
| Profitability | Gross margin range and payback band | Exact IRR, NPV, ROI, break-even and DSCR |
| Financial statements | List of what is included | 10-year P&L, cash flow, balance sheet and Excel model |
| Sensitivity | One directional line | Full sensitivity and scenario tables |
| Process | Simplified flow diagram | Detailed process flow, mass and energy balance, operating conditions |
| Machinery | Names of the main machines | Specifications, capacity, cost and supplier list |
| Market | Headline size, growth and global demand | Segment, region, trade and price forecast tables |
| Suppliers and buyers | Supplier types and sourcing hubs | Named suppliers and buyers |
Peanut Butter project report: FAQs
How much does a peanut butter manufacturing plant cost?
What is the profit margin in peanut butter manufacturing?
How long is the payback for a peanut butter plant?
Which raw materials does a peanut butter plant need?
Why is aflatoxin testing so important for peanut butter?
What licenses does a peanut butter plant need?

About the analyst
Priyanka Mor, Senior Consultant
Senior Consultant at Credence Research Inc directing strategic market advisory, cross-border commercial due diligence and enterprise intelligence frameworks for global B2B clients. Combines quantitative modeling with executive advisory, translating macroeconomic variables and supply chain data into go-to-market blueprints, M&A screenings and competitive war-gaming strategies.
Related market research
- Sweet Spread Market Size, Share, Growth and Forecast 2032
- Plant Based Spreads Market Size, Trends, Share and Forecast 2032
- Jams & Spreads Market Size, Share, Growth and Forecast 2032
- Chocolate Spreads Market Size, Share Trends and Forecast 2032
- Peanut Butter Keto Snacks Market Size, Growth and Forecast 2032
- Dips And Spreads Market Size, Growth, Share and Forecast 2032
More plant project reports
- Green Beans Processing Plant Project Report (DPR) 2026
- Banana Powder Manufacturing Plant Project Report (DPR) 2026
- Instant Noodles Manufacturing Plant Project Report (DPR) 2026
- Cashew Processing Plant Project Report (DPR) 2026
- Ginger Processing Plant Project Report (DPR) 2026
- Pre Packaged Soup Manufacturing Plant Project Report (DPR) 2026