
Quick answer
A ginger processing plant washes, peels, slices and dries fresh rhizomes, then mills them into powder. This overview models a greenfield plant making 1,500 tonnes of dried ginger and powder a year from 6,000–7,500 tonnes of fresh ginger, with estimated CapEx of USD 2.5–7 million by build standard and region. Gross margin is estimated at 12–28% and payback at 4–11 years. Contracted low-cost ginger and export-grade quality decide which end applies.
Viable for processors with contracted, low-cost fresh ginger and audited export-grade powder; a plant selling bulk powder against Chinese offers will sit at the thin end of the margin range.
Ginger plant: key highlights
| Parameter | Indicative value | Note |
|---|---|---|
| Plant capacity | 1,500 tonnes of dried ginger and powder per year | About 6 tonnes a day over 250 operating days, from 6,000–7,500 tonnes of fresh ginger at full capacity |
| Total CapEx | USD 2.5–7 million | Greenfield, excluding working capital; low end an Asian build with modest finishing, high end a U.S. or EU site or full export specification |
| Raw material share of operating cost | 60–78% | Modeled at 4–5 kg of fresh ginger per kg of product |
| Gross margin | 12–28% | At an assumed USD 2.6–3.6 per kg blended price and assumed USD 0.30–0.45 per kg processing-grade ginger |
| Payback period | 4–11 years | At 80% utilization, post-tax at an assumed 20%, including a one-year ramp-up; weak price and high-CapEx pairings fall outside this band |
| IRR | Available in report | Post-tax, 10-year model |
| Break-even | Available in report | Capacity utilization basis |
Ranges assume a 1,500 tonnes-per-year greenfield plant, 250 operating days, 80% utilization and 2026 prices. The blended price of USD 2.6–3.6 per kg, fresh ginger at USD 0.30–0.45 per kg, overheads and land rates are assumed. Rupee figures convert at an assumed 88 per USD (2026) and 74 per USD (older profile). CapEx is scaled from a 2026 plant and excludes working capital. The full report can be customized to any country or region.
What is ginger processing?
Ginger processing turns the fresh rhizome of Zingiber officinale into shelf-stable forms that food, beverage and supplement makers can store and dose by weight. Drying cuts freight and gives buyers a year-round ingredient with measurable pungency.
The plant modeled here makes two core products: dried ginger slices or splits, sold whole or as crushed pieces, and ground ginger powder. Each 100 kg of fresh rhizomes yields only about 19–25 kg of dried ginger, according to an Indian government model project report, which is why sourcing dominates the economics. Larger groups also extract oleoresin and essential oil from the dried spice.
Under the Harmonized System, whole, split or sliced ginger falls under subheading 0910.11 and crushed or ground ginger under 0910.12, with national schedules adding further digits. Buyers include seasoning blenders, bakeries, tea and beverage brands, ginger beer and ready-meal makers, nutraceutical firms and retail spice packers. Their specifications usually cap moisture at 12% and set a minimum volatile oil content, because the aroma compounds are what customers pay for.
Ginger market overview and global demand
Credence Research values the global seasoning market at about USD 46.9 billion in 2025, based on its USD 44.7 billion for 2024 and a 4.9% CAGR. Its spice oils and oleoresins study puts that narrower category, a key outlet for dried ginger, at about USD 5.69 billion in 2025, based on USD 5.58 billion for 2024 and a 2.02% CAGR. No Credence Research report sizes processed ginger alone, so physical data matter more.
Supply and trade remain concentrated in Asia. A Dutch government market study updated in October 2025 names China and India as the leading producers, with Nigeria, Thailand, Peru, Brazil and Myanmar behind them. It counts about 18,000 tonnes of European dried ginger imports from developing countries in 2024, of which 12,000 tonnes were ground or crushed. Powder imports rose about 7.6% a year from 2020, while whole dried ginger declined. China supplied about half, with Peru, Nigeria and India at roughly 10–15% each.
India's trade in the crop is large but mostly fresh. Spices Board export data show ginger shipments of 146,257 tonnes worth about USD 143 million in 2025-26, up from 131,360 tonnes the year before. Chinese fresh ginger averaged USD 1,241 per tonne in January–July 2025, down about 11% from a year earlier, FreshPlaza reported.
Beverage makers add a second source of demand. Credence Research values the ginger beer market at about USD 5.6 billion in 2025, based on USD 5.28 billion for 2024 and a 6.66% CAGR. A new entrant's opening is traceable, residue-tested powder for industrial buyers.
Ginger manufacturing process
A ginger line is simple in concept and unforgiving in practice. Rhizomes arrive with soil, are about four-fifths water and begin to sprout or rot within weeks unless kept cool. Every step therefore aims to remove water fast enough to stop spoilage without driving off the volatile oil that sets the price.
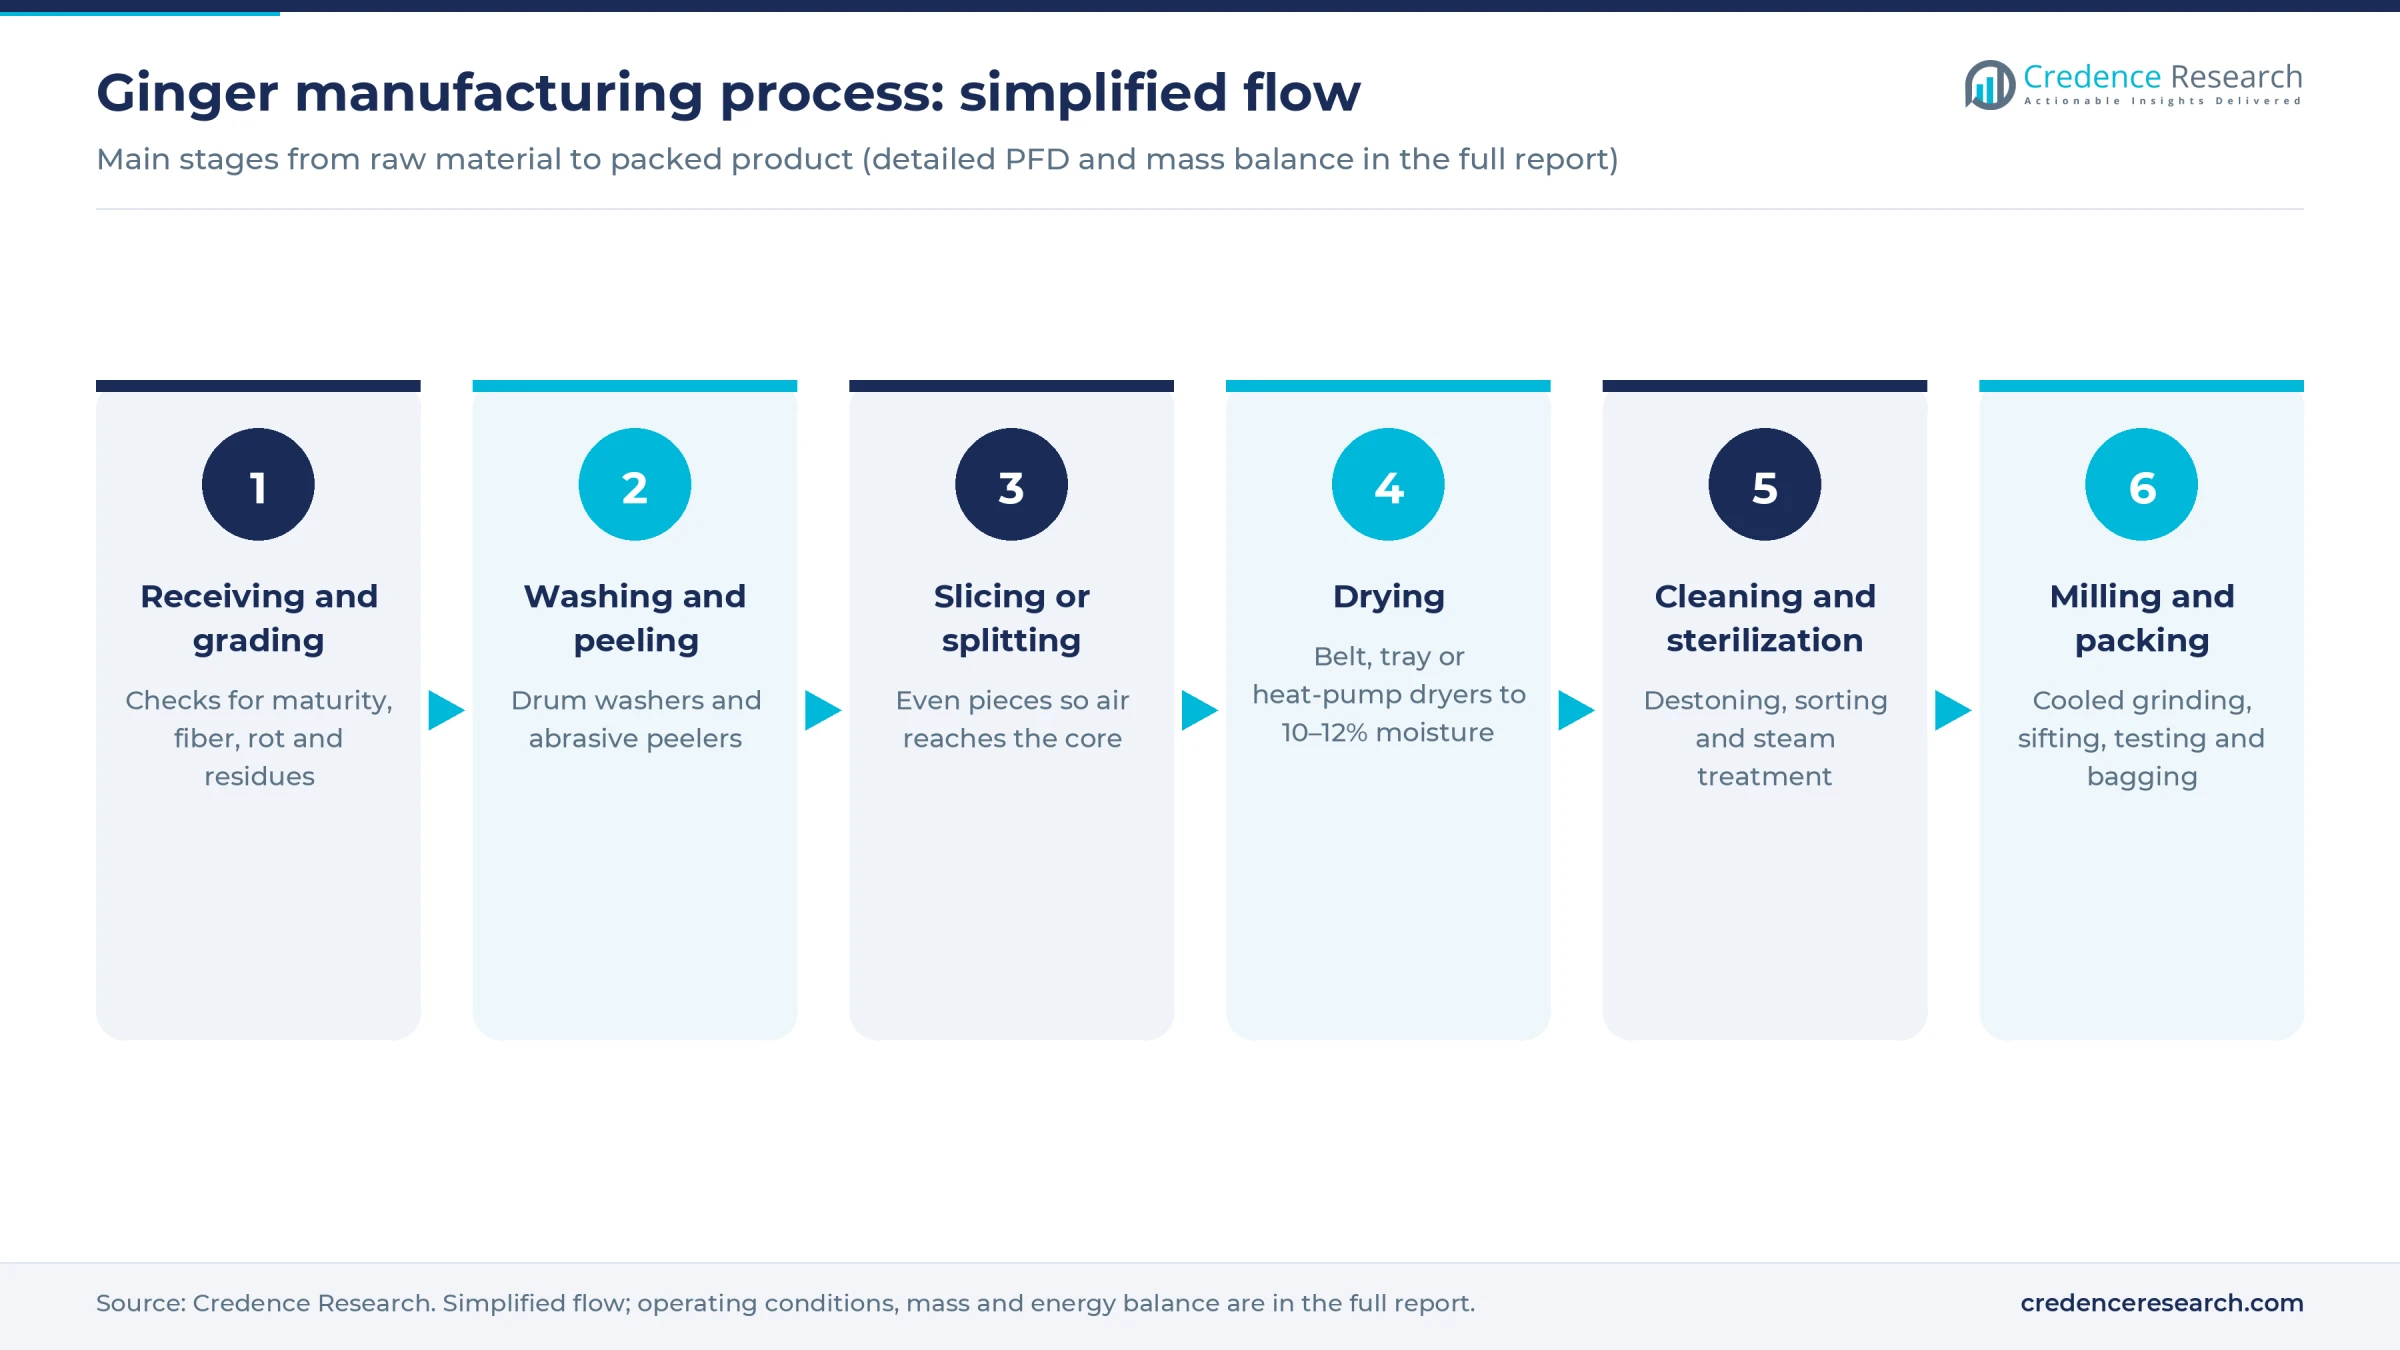
- Receiving and grading. Lots are checked for maturity, fiber, rot and pesticide residues. Fully mature rhizomes suit drying because they carry more dry matter and oil, while tender young ginger is better kept for paste, pickle and candy.
- Washing and peeling. Drum or brush washers remove soil, and abrasive peelers or hand scraping strip the skin. Peeled ginger dries faster and looks lighter, while unpeeled pieces keep more oil near the surface. Some origins still bleach with lime, a practice many buyers now avoid.
- Slicing or splitting. Rhizomes are cut into even slices or split lengthwise so that warm air reaches the core. Uneven pieces harden on the outside and stay moist inside.
- Drying. Sun drying on raised racks is still common at farm level, but export plants use belt, tray or heat-pump dryers at moderate temperatures to reach 10–12% moisture without scorching. Controlled drying also limits mold, the main source of aflatoxin risk.
- Cleaning and sterilization. Dried pieces are destoned, polished, color-sorted and often steam-treated to cut microbial counts, since European buyers require Salmonella to be absent.
- Milling and packing. Slices are kibbled or ground in cooled mills, sifted to mesh, tested for moisture, oil, ash and microbes, and packed into lined bags or retail jars.
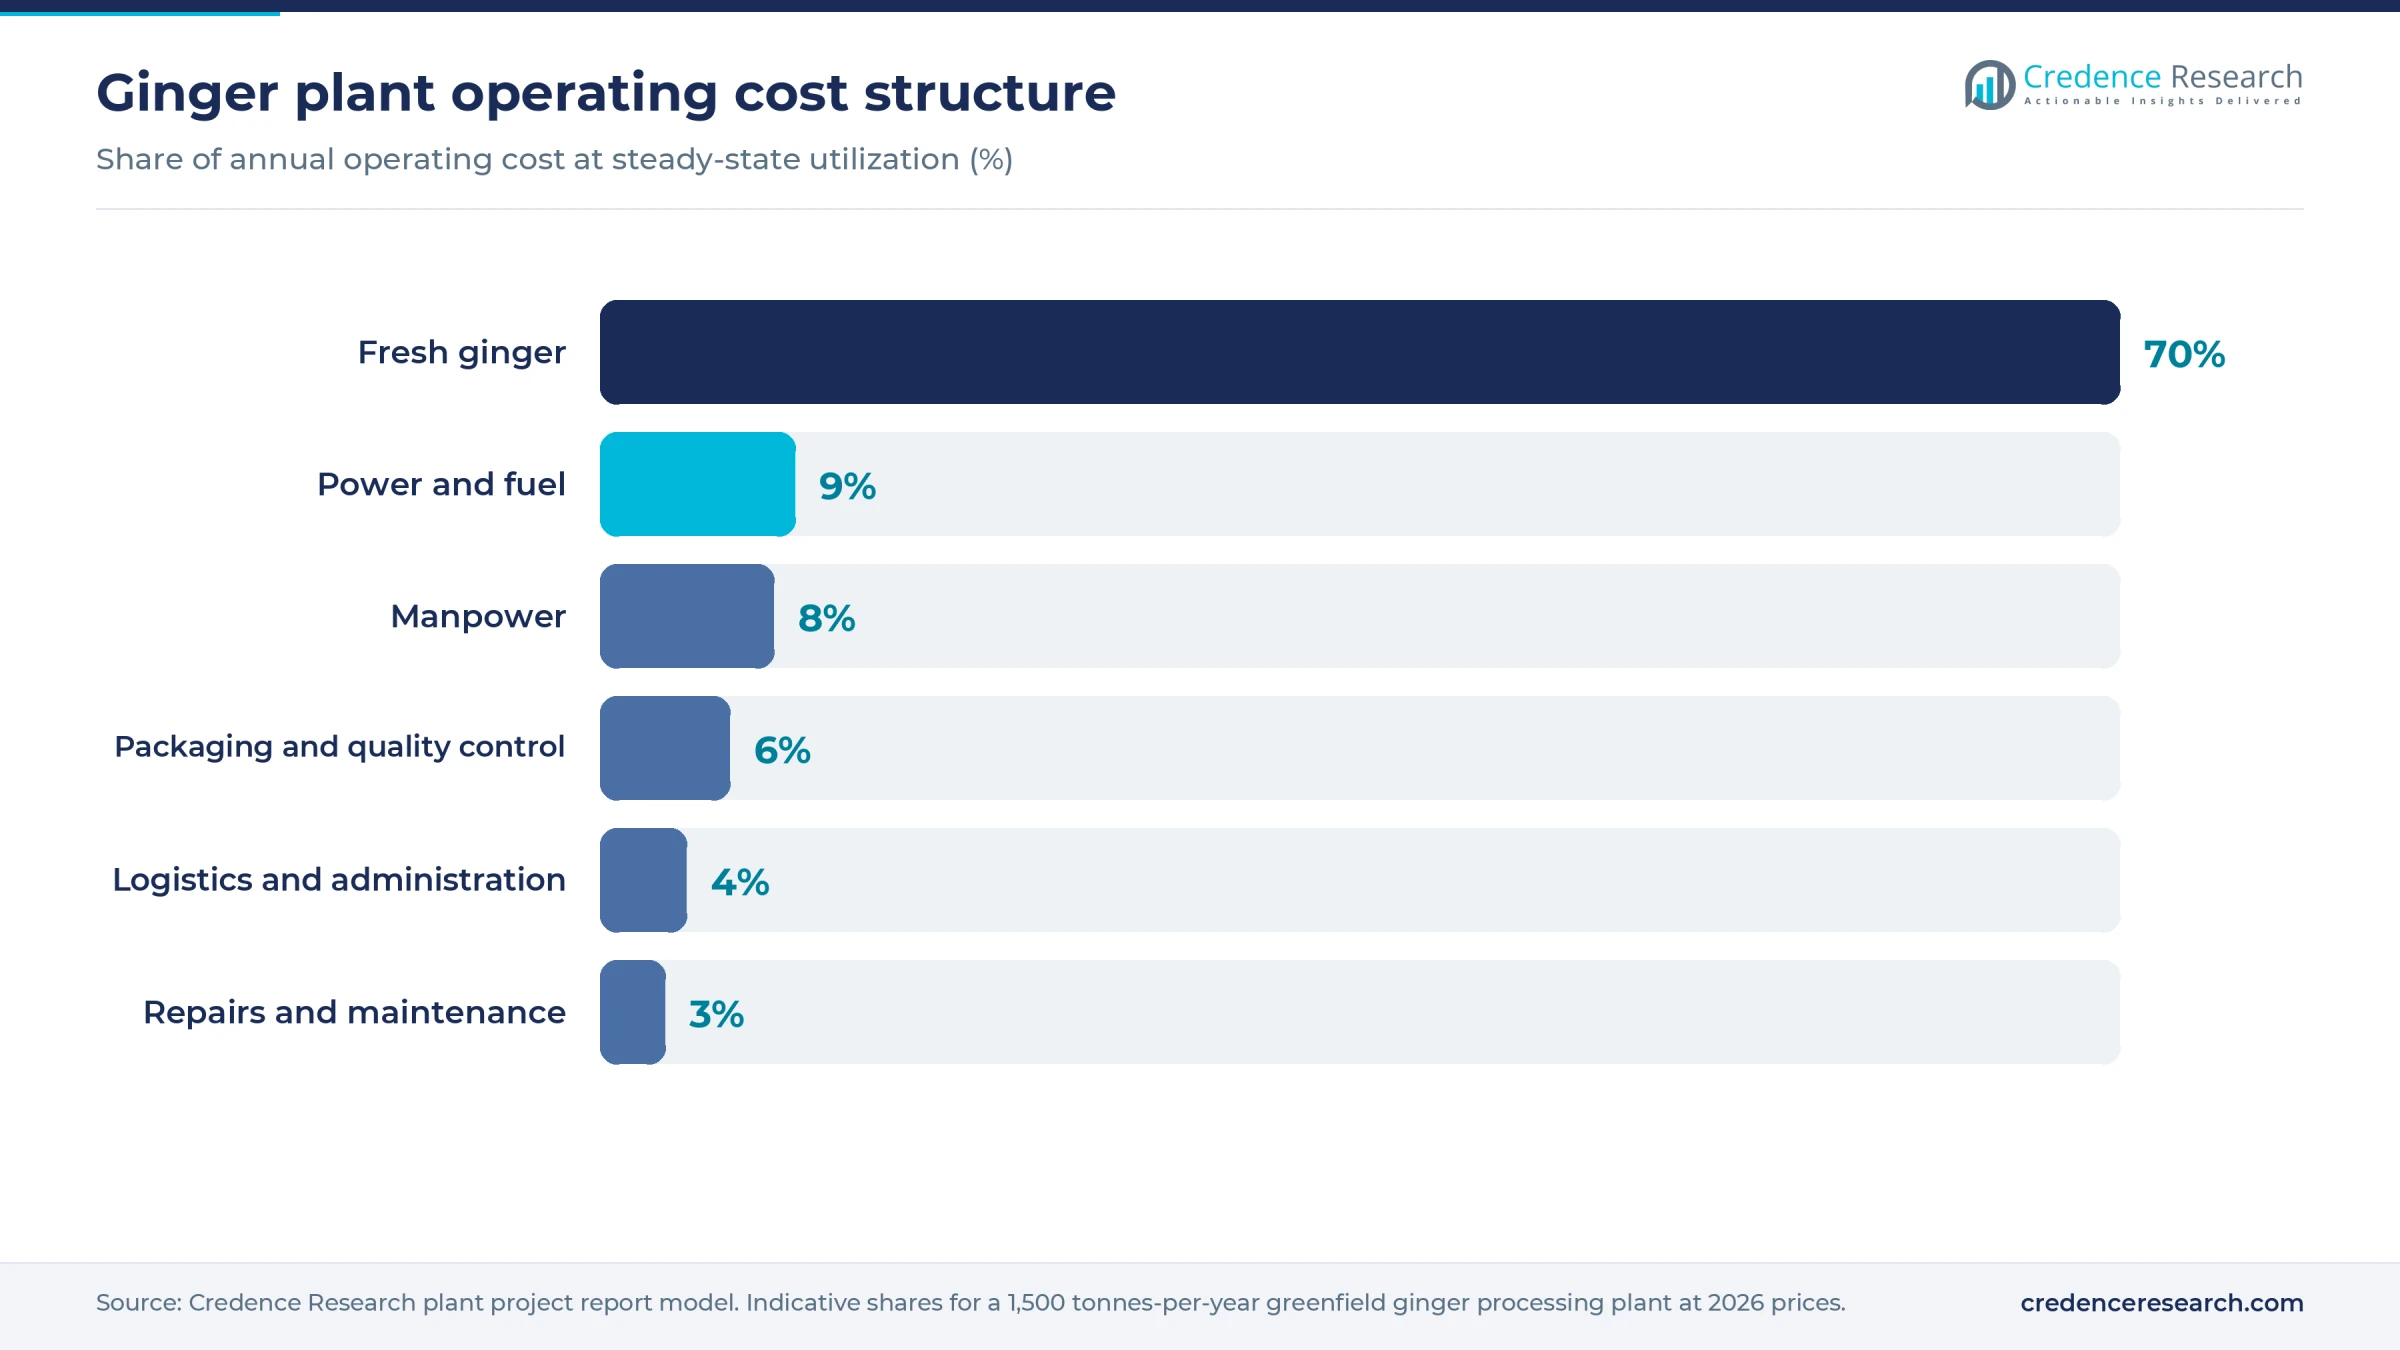
Yield, more than energy, sets the cost structure. At 19–25% dry recovery, the plant needs about 4–5 kg of fresh ginger for each kilogram sold, so small changes in peeling loss or final moisture move raw material cost per kilogram more than most energy savings can.
Ginger processing plant setup cost
This overview models a greenfield plant making 1,500 tonnes of dried ginger and powder a year, about 6 tonnes a day over 250 operating days, from 6,000–7,500 tonnes of fresh rhizomes. Estimated total CapEx is USD 2.5–7 million, excluding working capital.
The anchor is a farmer-owned organic spice unit in Meghalaya, India, which India's public broadcaster reported was inaugurated in June 2026 at a cost of about 320 million rupees, or about USD 3.6 million at an assumed 88 rupees per dollar, to handle more than 10,000 tonnes of ginger, turmeric, black pepper and chili a year. It covers washing, drying, pulverizing and storage. Scaled to this plant's intake with a 0.7 power rule, it implies about USD 2.8 million, which sets the low end for an Asian build with modest finishing.
The upper end assumes a U.S. or EU site, or an Asian plant built to full export specification with steam sterilization, dehumidified milling, a contaminants lab and effluent treatment, at an assumed 1.8–2.5 times the anchor cost. At the other extreme, a model project report from an Indian food technology institute sets fixed capital of about 2.6 million rupees for a 120-tonne powder unit in existing premises. Scaled up, that implies only about USD 0.2 million before land and buildings, a cottage-line floor rather than an export plant cost.
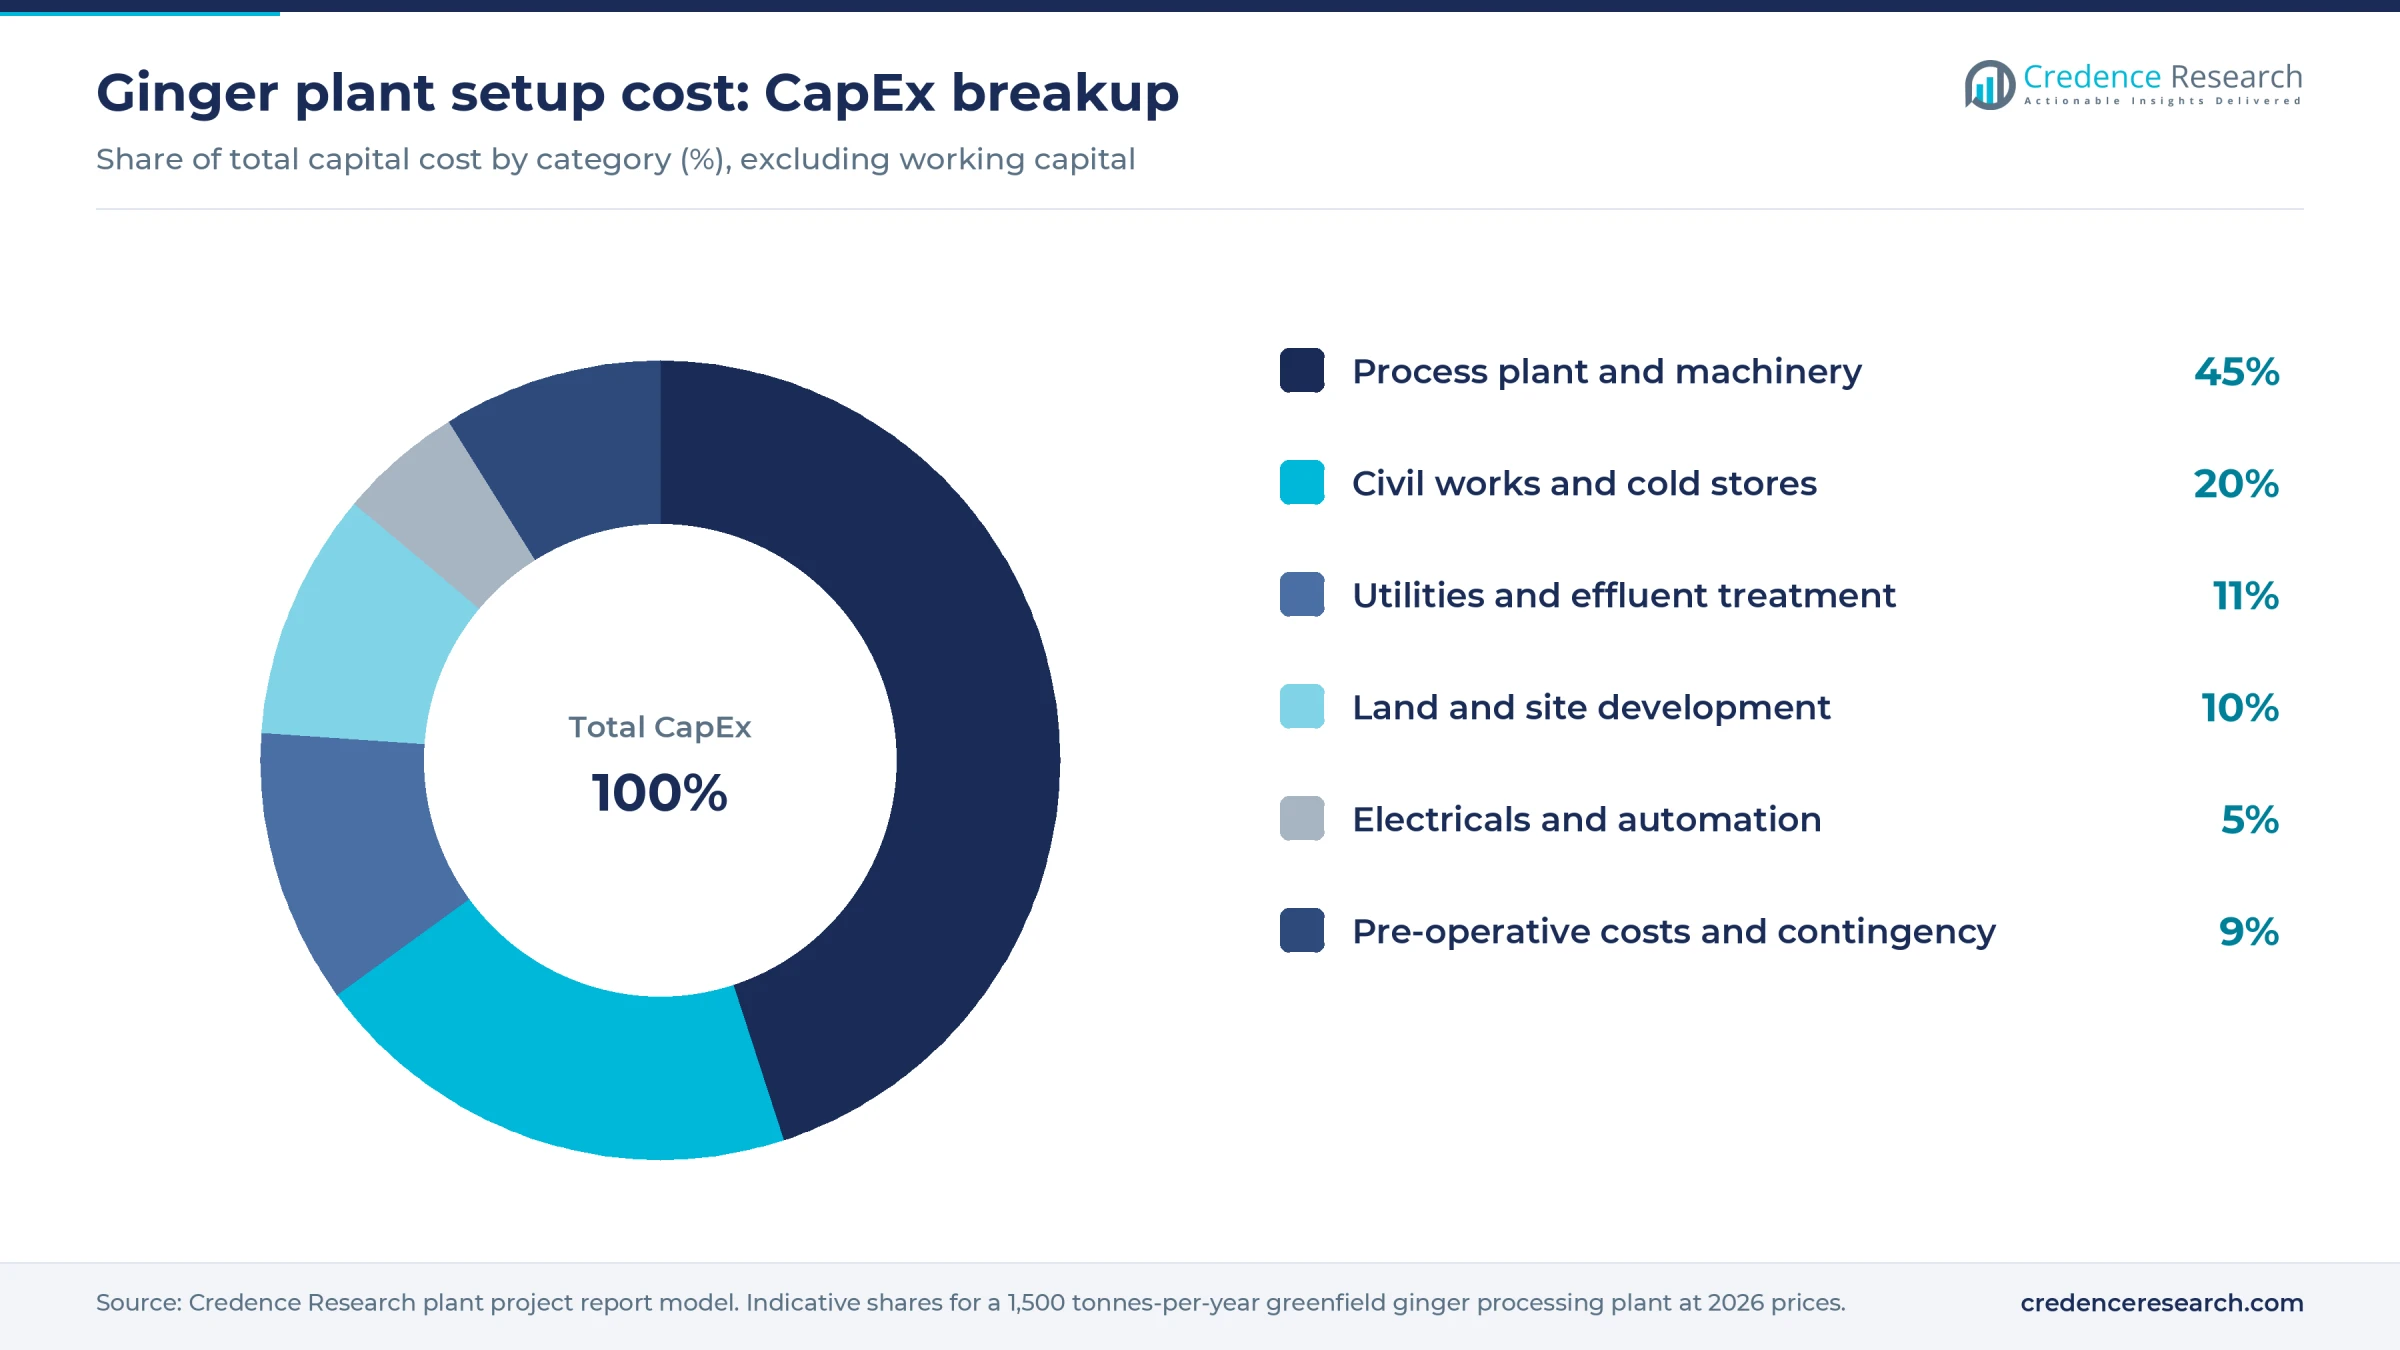
Worked example, land and site development. The plant needs an assumed 8,000–12,000 square meters. At an assumed USD 20–50 per square meter in an Asian industrial park, the plot costs about USD 160,000–600,000. At an assumed USD 30–80 per square meter at a U.S. or EU site, it costs about USD 240,000–960,000. Site works add an assumed USD 50,000–150,000, so this row usually takes about 6–16% of CapEx.
Working capital adds an estimated USD 0.8–1.5 million, since many origins harvest once a year and processors buy ahead to secure supply.
The full report can be customized to any country's land, power and labor rates.
Machinery and raw materials for a ginger processing plant
The main machinery groups are listed below. Capacities, specifications and quotations are available in the report.
- Intake and storage: weighbridge, crate washers, grading tables and cold rooms for fresh rhizomes
- Preparation: drum or brush washers, abrasive peelers, slicers and splitters
- Drying: belt, tray or heat-pump dryers with biomass, gas or electric heat, plus solar dryers where the climate allows
- Finishing: destoners, polishers, color sorters, steam sterilizers, cooled hammer or pin mills and sifters
- Packing and quality: metal detectors, bag fillers, moisture meters and a lab for volatile oil, ash and microbes
- Utilities: boilers, dust collection, water treatment and effluent treatment for starchy wash water
Fresh ginger is the only major input, and the plant should sit within trucking distance of growers. China's export crop is centered in Shandong province, India grows ginger across its northeastern hill states and the south, Nigeria's belt lies in southern Kaduna, and Peru's organic crop comes from its central jungle.
Nigeria's dried ginger shipments to Europe fell about 62% from 2022 to 2024 as blight cut output, the Dutch study notes. An earlier value chain study for the same agency recorded Nigerian fresh ginger swinging from about USD 1.64 to USD 4.10 per kg within a single week in June 2020. Plants therefore need contracts with grower groups, cold storage and, ideally, a second origin.
Ginger processing business profit margin and ROI
For the modeled plant, gross margin after ginger and direct conversion costs is estimated at 12–28%, at an assumed blended price of USD 2.6–3.6 per kg for powder and slices. Payback is estimated at 4–11 years, including a one-year ramp-up. Weak pairings of price and CapEx fall outside that band.
The price floor comes from China, the lowest-cost origin. Trade data put Chinese exports of crushed or ground ginger at about 12,300 tonnes worth USD 29.5 million in 2023, a unit value near USD 2.40 per kg. A Nigerian value chain study quoted ASTA-grade split ginger at USD 1.85–2.00 per kg FOB in 2020, with premium lots at up to USD 6–7. A plant priced only against bulk Chinese powder would sit at the bottom of the modeled range; organic, steam-treated and single-origin grades carry the upside.
The modeled unit cost is about USD 1.9–2.7 per kg, with processing-grade fresh ginger at an assumed USD 0.30–0.45 per kg and 4–5 kg per kg of product. At 80% utilization, revenue of USD 3.1–4.3 million on 1,200 tonnes supports gross profit of about USD 0.4–1.2 million before an assumed USD 150,000–250,000 of overheads. Ginger cost is the main swing factor: a USD 0.05 per kg rise that cannot be passed on cuts gross margin by about 7–8 percentage points at a USD 3.0 selling price.
| Metric | Value |
|---|---|
| Project IRR (post-tax) | Available in report |
| NPV | Available in report |
| Return on investment | Available in report |
| DSCR | Available in report |
| Break-even utilization | Available in report |
How to start a ginger processing business, licenses and approvals
Wherever it is built, a ginger processing plant needs approvals in roughly six areas. These are company and tax registration; land use, zoning and building permits; an environmental permit covering wash water, peel waste, boiler or dryer emissions and milling dust; worker safety approvals, including dust explosion controls; food business registration with a hazard-based food safety plan; and exporter or customs registration. Industrial buyers also expect a GFSI-recognized scheme such as FSSC 22000, BRCGS or IFS and testing in ISO/IEC 17025 accredited labs.
| Market | Food and product | Environment and safety |
|---|---|---|
| United States | FDA food facility registration; current good manufacturing practice and preventive controls under 21 CFR 117; USDA National Organic Program certification for organic claims | State air permit; NPDES or local pretreatment permit for wash water; OSHA rules, including combustible dust enforcement |
| European Union | Food business registration under Regulation (EC) No 852/2004; traceability under Regulation (EC) No 178/2002; aflatoxin limits for ginger under Regulation (EU) 2023/915; pesticide limits under Regulation (EC) No 396/2005; organic rules under Regulation (EU) 2018/848 | National environmental permit; ATEX rules for explosive dust atmospheres in milling |
| India | FSSAI central license, which applies to exporters; importer-exporter code from DGFT; Spices Board certificate of registration as exporter of spices (CRES), since ginger is a scheduled spice | State pollution control board consents to establish and operate; factory license and boiler registration |
Fast, controlled drying matters as much as paperwork, because mold during slow drying is the usual route to an aflatoxin failure.
Key ginger manufacturers and recent developments
The processing trade is fragmented and largely grower-led. KX Food, a family-owned grower and exporter with more than 500 hectares of its own ginger in China, ships conventional and organic product to Europe. Synthite Industries of India processes ginger among the botanicals in its extraction portfolio. Buderim ginger, sold to the Himstedt family in 2020, runs a factory at Yandina in Queensland, Australia. Kaiming Agro exports Zing Fiji ginger to the U.S., and Nigerian processors named in the Dutch value chain study include Belphins, which runs an oleoresin plant in Kaduna, Olam Nigeria, Tiger Foods and Wacot. In Europe, packers such as Fuchs and Euroma buy dried ginger for blends and retail.
- February 2026. Nigeria's Kaduna State and federal governments committed 40 billion naira, about USD 29.6 million, to a ginger production and processing hub in Kachia, billed as Africa's largest when complete.
- June 2026. India's finance minister inaugurated the 320 million rupee organic spice unit at Bhoirymbong, Meghalaya, run by Eastern Ri-Bhoi Organic Farmer Producer Company, with ginger among its main crops.
- November 2026. KX Food fully opened FarmerLi, a 4,500 square meter ginger washing, drying, inspection and packing center in Breda, the Netherlands, where part of its imported ginger finishes drying.
What's inside the Ginger project report PDF
The report runs to 21 chapters. Open a chapter to see its sections.
1. Preface
2. Scope and Methodology
- 2.1 Objectives of the Study
- 2.2 Stakeholders
- 2.3 Research Methodology
- 2.4 Data Sources and Key Assumptions
3. Executive Summary
- 3.1 Market Snapshot
- 3.2 Project at a Glance (Capacity, CapEx, OpEx)
- 3.3 Key Financial Indicators (IRR, NPV, Payback, Break-even)
- 3.4 Feasibility Verdict
4. Product Overview
- 4.1 Ginger Definition and Properties
- 4.2 Grades and Specifications (BIS / ISO / ASTM)
- 4.3 HS Code and Classification
- 4.4 Key Applications
- 4.5 Substitutes
5. Global Ginger Market
- 5.1 Market Overview
- 5.2 Historical and Current Market Performance (Volume and Value)
- 5.3 Market Breakup by Grade / Type
- 5.4 Market Breakup by End-Use Industry
- 5.5 Market Breakup by Region
- 5.6 Market Drivers, Restraints and Trends
- 5.7 Value Chain Analysis
- 5.8 Market Forecast
6. Target Country Ginger Market Analysis
- 6.1 Demand and Supply Analysis
- 6.2 Installed Capacity vs Demand Gap
- 6.3 Import Dependence
- 6.4 Demand Forecast by End-Use
7. Trade Analysis
- 7.1 Imports by Volume, Value and Country
- 7.2 Exports by Volume, Value and Country
- 7.3 Trade Balance and Opportunities
8. Price Analysis
- 8.1 Historical Ginger Price Trends by Region
- 8.2 Raw Material / Feedstock Price Trends and Linkage
- 8.3 Price Forecast
- 8.4 Margins Across the Value Chain
9. Competitive Landscape
- 9.1 Market Structure
- 9.2 Key Players and Installed Capacities
- 9.3 Profiles of Key Players
- 9.4 Recent Developments (Expansions, M&A, New Plants)
10. Manufacturing Process and Technology
- 10.1 Comparison of Technology Routes
- 10.2 Selected Route and Process Flow Diagram
- 10.3 Unit Operations Involved
- 10.4 Chemical Reactions Involved
- 10.5 Mass Balance and Raw Material Requirements
- 10.6 Energy Balance
- 10.7 Quality Assurance Criteria and Technical Tests
- 10.8 By-products and Waste Handling
- 10.9 Technology Licensors / Providers
11. Project Details, Requirements and Costs
- 11.1 Land, Location and Site Development
- 11.1.1 Site Selection Criteria
- 11.1.2 Location Analysis
- 11.1.3 Land Requirement and Costs
- 11.1.4 Site Development Costs
- 11.2 Plant Layout
- 11.2.1 Layout Principles
- 11.2.2 Proposed Layout
- 11.2.3 Factors Influencing Layout
- 11.3 Civil Works and Buildings
- 11.4 Plant Machinery
- 11.4.1 Machinery Requirements and Specifications
- 11.4.2 Machinery Costs
- 11.4.3 Machinery Suppliers
- 11.5 Raw Materials
- 11.5.1 Requirements per Tonne of Output
- 11.5.2 Procurement and Sourcing
- 11.5.3 Costs
- 11.5.4 Suppliers
- 11.6 Packaging
- 11.6.1 Packaging Requirements
- 11.6.2 Packaging Costs
- 11.6.3 Packaging Suppliers
- 11.7 Storage and Material Handling
- 11.8 Transportation Requirements and Costs
- 11.9 Utilities
- 11.9.1 Power Requirements and Costs
- 11.9.2 Water Requirements and Costs
- 11.9.3 Steam, Fuel and Other Utilities
- 11.10 Manpower Requirements and Wages
12. Environment, Health, Safety and Sustainability
- 12.1 Effluent and Emissions Management
- 12.2 Hazard Classification and Safety Measures
- 12.3 Carbon Footprint
- 12.4 Green / Low-Carbon Process Options
13. Regulatory Procedures, Approvals and Certifications
- 13.1 Licences and Registrations
- 13.2 Environmental Clearances
- 13.3 Product Certifications (BIS, REACH, etc.)
- 13.4 Approval Timeline
14. Project Implementation Schedule
15. Project Economics
- 15.1 Capital Cost of the Project
- 15.2 Techno-Economic Parameters
- 15.3 Capacity Utilization and Ramp-up
- 15.4 Product Pricing and Margins
- 15.5 Income Projections
- 15.6 Expenditure Projections
- 15.7 Working Capital Requirement
- 15.8 Taxation
- 15.9 Depreciation
16. Financial Analysis
- 16.1 Projected Profit and Loss Account
- 16.2 Projected Cash Flow Statement
- 16.3 Projected Balance Sheet
- 16.4 Liquidity Analysis
- 16.5 Profitability Analysis (Payback, NPV, IRR, ROI)
- 16.6 Break-even Analysis
- 16.7 Debt Service Coverage Ratio (DSCR)
- 16.8 Sensitivity Analysis
- 16.9 Scenario and Uncertainty Analysis
17. Funding and Incentives
- 17.1 Means of Finance and Debt-Equity Structure
- 17.2 Loans and Financial Assistance
- 17.3 Government Schemes and Subsidies (PLI, State Policies)
18. Risk Assessment
- 18.1 Key Success Factors
- 18.2 Key Risk Factors
- 18.3 Risk Mitigation
19. Strategic Recommendations
20. Case Study of a Successful Venture
21. Appendix
- 21.1 Detailed Assumptions
- 21.2 Abbreviations
- 21.3 List of Tables and Figures
- 21.4 Sources
This page vs. the full report
| Data point | On this page (free) | In the full report |
|---|---|---|
| Total CapEx | One rounded range at one capacity | Exact figure at three capacities with a line-item breakup |
| CapEx breakup | Category shares (%) only | Cost, quantity and supplier for every machine |
| Operating cost | Share of raw materials, utilities and labor | Per-unit cost sheet with each input price and consumption |
| Profitability | Gross margin range and payback band | Exact IRR, NPV, ROI, break-even and DSCR |
| Financial statements | List of what is included | 10-year P&L, cash flow, balance sheet and Excel model |
| Sensitivity | One directional line | Full sensitivity and scenario tables |
| Process | Simplified flow diagram | Detailed process flow, mass and energy balance, operating conditions |
| Machinery | Names of the main machines | Specifications, capacity, cost and supplier list |
| Market | Headline size, growth and global demand | Segment, region, trade and price forecast tables |
| Suppliers and buyers | Supplier types and sourcing hubs | Named suppliers and buyers |
Ginger project report: FAQs
How much does it cost to set up a ginger processing plant?
How much fresh ginger is needed to make 1 kg of dried ginger?
What profit margin can a ginger processing business earn?
Which products should a ginger processing plant make?
Which licenses does a ginger processing plant need?
What are the main risks for a ginger processing plant?

About the analyst
Priyanka Mor, Senior Consultant
Senior Consultant at Credence Research Inc directing strategic market advisory, cross-border commercial due diligence and enterprise intelligence frameworks for global B2B clients. Combines quantitative modeling with executive advisory, translating macroeconomic variables and supply chain data into go-to-market blueprints, M&A screenings and competitive war-gaming strategies.
Related market research
- Seasoning Market Size, Growth, Trends, Share and Forecast 2032
- Spice Oils And Oleoresin Market Size, Growth and Forecast 2032
- Ginger Beer Market Size, Growth, Share and Forecast 2032
- Organic Spice Market Size, Share, Growth and Forecast 2032
- Asia Pacific Seasoning and Spices Market Size, Share, Growth and Forecast, 2025-2035
- Dehydrated Food Market Size, Growth & Forecast to 2032
More plant project reports
- Green Beans Processing Plant Project Report (DPR) 2026
- Peanut Butter Manufacturing Plant Project Report (DPR) 2026
- Banana Powder Manufacturing Plant Project Report (DPR) 2026
- Instant Noodles Manufacturing Plant Project Report (DPR) 2026
- Cashew Processing Plant Project Report (DPR) 2026
- Pre Packaged Soup Manufacturing Plant Project Report (DPR) 2026