
Quick answer
A cosmetic aloe vera gel plant that turns 2.5–3 tonnes of fresh leaf into about 1,000 kg of gel per day needs an estimated CapEx of USD 400,000–700,000 in a lower-cost producing region at 2026 prices. With leaf at about USD 0.17–0.23 per kg and a blended ex-factory price of USD 2.6–3.6 per kg, gross margin runs at 30–42%, and payback runs 3.5–6 years at steady-state cash profit, reached from year three.
Feasible for promoters who secure contract leaf supply within trucking distance and clear cosmetic compliance in their target market, provided at least half the output moves as packed retail units or contract fills rather than low-priced bulk gel.
Aloe Vera Gel plant: key highlights
| Parameter | Indicative value | Note |
|---|---|---|
| Plant capacity | 1,000 kg finished gel per day | About 300 tonnes a year over 300 days, from 2.5–3 tonnes of leaf daily |
| Total CapEx | USD 400,000–700,000 | Greenfield plant in a lower-cost region; a U.S. or EU site costs roughly 2–3 times more (assumed) |
| Raw material and packaging share of operating cost | 55–65% | Fresh leaf, thickener and preservatives, tubes, jars and cartons |
| Gross margin | 30–42% | Blended 60:40 packed-to-bulk product mix |
| Payback period | 3.5–6 years | At 75–85% utilization from year three |
| IRR | Available in report | Post-tax, 10-year model |
| Break-even | Available in report | Capacity utilization basis |
Ranges assume a 1,000 kg per day cosmetic gel plant (about 300 tonnes a year) on a greenfield site in a lower-cost producing region, 2026 prices, 75–85% utilization from year three, leaf at USD 0.17–0.23 per kg, 33–40% gel recovery, a 60:40 packed-to-bulk mix and Indian benchmarks converted at 88 rupees per dollar. Machinery is scaled with a 0.6 exponent. The full report can be customized to any country.
What is aloe vera gel?
Aloe vera gel is the clear, mucilaginous inner-leaf tissue of Aloe barbadensis Miller, stabilized and thickened into a spreadable product for skin and hair. This report models a cosmetic plant. Its finished gel carries 90–98% aloe juice, set with a carbomer or xanthan thickener, glycerin, a preservative system and a neutralizer, and it sells in tubes and jars as a moisturizer, after-sun soother, shaving and massage base and light hair-styling aid.
The plant sells into three commercial grades. Retail cosmetic gel, usually labeled 92–99% aloe, reaches consumers through pharmacies, supermarkets and e-commerce. Bulk cosmetic gel in 25–50 kg drums supplies contract fillers, salons and brand owners that add their own fragrance or actives. Drinkable aloe gel and juice are regulated as foods or dietary supplements in most markets and sit outside this plant's base case. Internationally, packaged skin-care gel is classified under HS subheading 3304.99 (other beauty or skin-care preparations), while unformulated aloe sap and extract fall under HS 1302.19 (other vegetable saps and extracts).
Aloe vera gel market overview and global demand
The global aloe vera-based skin and hair products market is about USD 3.5 billion in 2025, based on Credence Research's USD 3.21 billion for 2024 and a 9.5% CAGR through 2032. One step upstream, the aloe vera extracts market, which covers liquid, gel and powder forms, is about USD 2.27 billion in 2025, based on Credence Research's USD 2.08 billion for 2024 and a 9.04% CAGR. Finished gel captures more value than extract because tubes, claims and distribution add more than the leaf.
Finished aloe gel ships under HS 3304.99, a broad skin-care line whose trade is led by Europe and East Asia. World Bank WITS data for 2023 show France exporting USD 9.9 billion of these preparations, South Korea USD 6.5 billion, the United States USD 4.7 billion, China USD 2.1 billion and India USD 0.74 billion. Korea matters for this product in particular, because K-beauty labels such as Nature Republic sell 92% aloe soothing gels across Asia, Europe and Australia.
Leaf supply sits elsewhere, with large vertically integrated processors that grow aloe in Mexico's Tamaulipas state, Texas's Rio Grande Valley and the Dominican Republic, while Asian growers supply regional fillers. Retail price points stay low in mass markets; Dabur's pure aloe gel in India sells for about USD 1 per 100 ml, while bulk cosmetic gel lists at roughly USD 1.1–3.0 per kg on Asian B2B portals. Entry barriers for simple filling are low, so price competition is the main commercial risk, and plants that control leaf sourcing and run their own fillet line hold a cost edge over fillers that rehydrate bought 200:1 powder.
Aloe vera gel manufacturing process
A cosmetic aloe vera gel plant joins a fresh-leaf line to a cosmetic formulation and filling room. Leaves need processing within about 24 hours of harvest because the cut fillet browns and its polysaccharides degrade, which shows up later as thin, discolored gel.
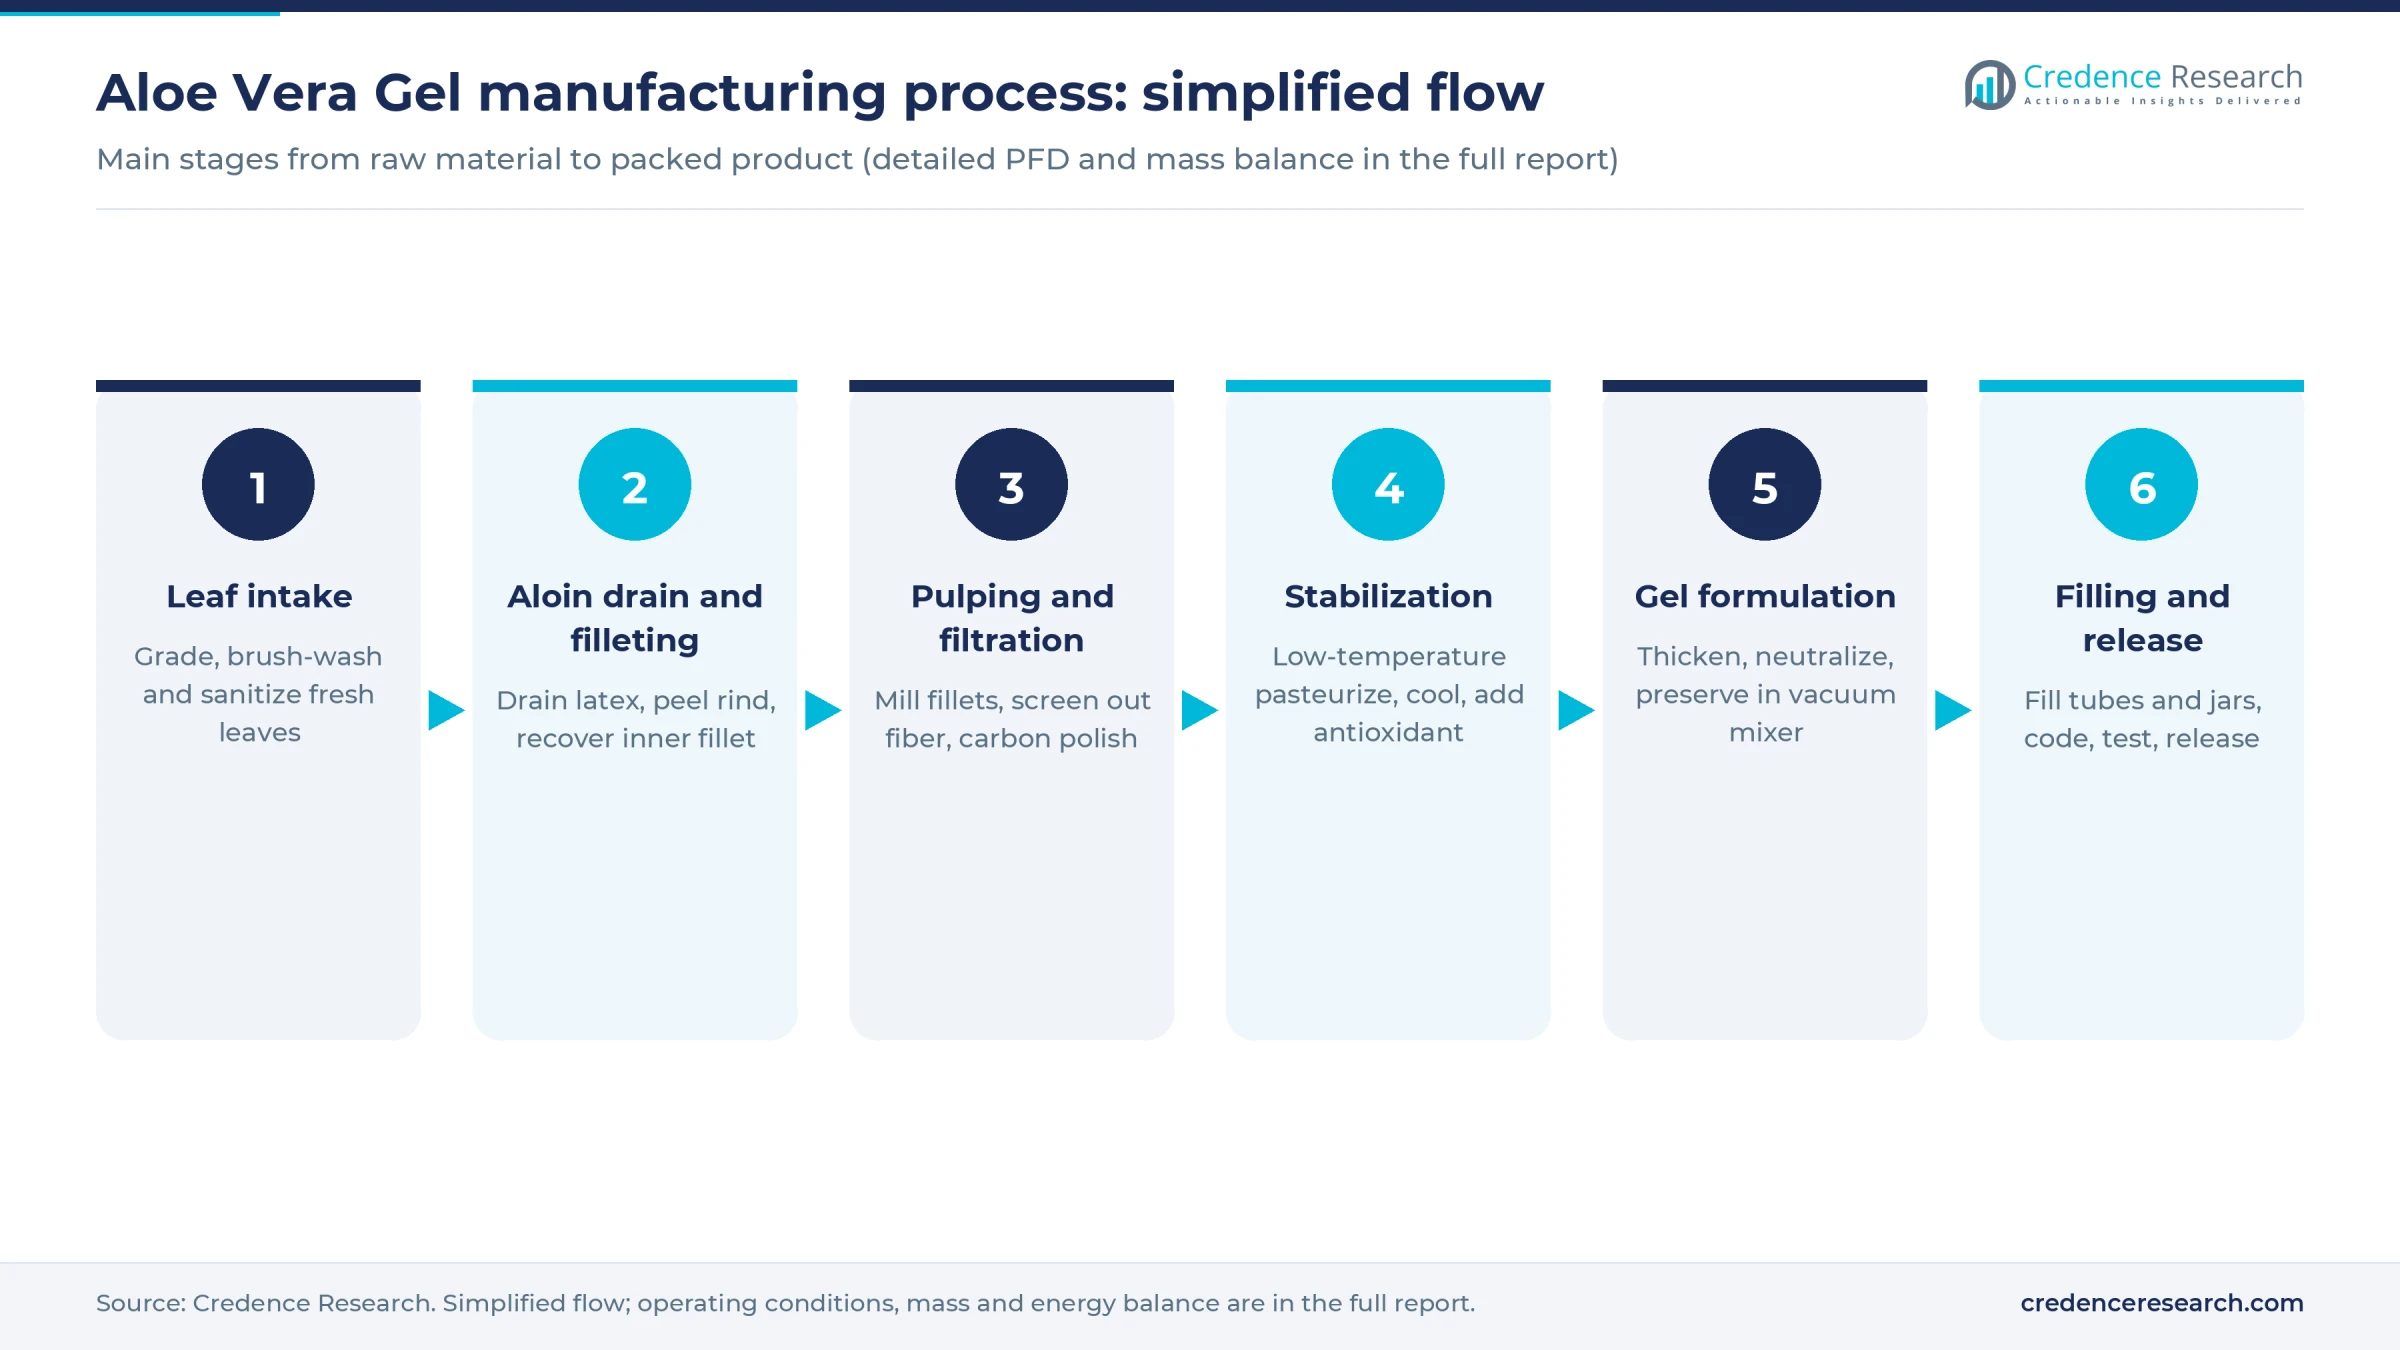
- Leaf intake and washing. Mature outer leaves are graded for size and damage, brushed in a washer and sanitized in a chlorine solution such as calcium hypochlorite.
- Aloin drain and filleting. The leaf base and tip are cut and leaves stand upright so the yellow latex, which carries bitter, laxative aloin, drains away. A peeling machine or hand crew then removes the green rind. ICAR reports effective juice recovery of about 30% from rainfed leaves on India's Aravali hills; irrigated plantings typically recover more.
- Pulping and filtration. Fillets pass through a pulper or colloid mill and fine screens to strip fiber, with optional activated-carbon treatment to cut residual aloin and color.
- Stabilization. The juice receives short low-temperature pasteurization, rapid cooling and citric acid with an antioxidant, then waits in chilled stainless-steel tanks.
- Gel formulation. In a vacuum homogenizer-mixer, the thickener is dispersed into the juice, neutralized to a skin-compatible pH near 5.5–6.5 and dosed with glycerin, preservative, vitamin E and optional fragrance. Vacuum removes trapped air so the gel stays crystal clear.
- Filling and release. Tubes of 50–200 g and jars are filled, sealed and batch-coded, and each batch is held until microbial count, pH and viscosity pass.
The leaf line sets cost, and the formulation room sets product claims. Owning the fillet step lets a plant print a high aloe percentage at a lower cost per kg than rehydrating powder, while microbial failures in the filled pack are the most expensive quality risk and the main reason the preservative system and filling-room hygiene get early attention.
Aloe vera gel plant setup cost
For a greenfield plant that turns 2.5–3 tonnes of fresh leaf into about 1,000 kg of finished cosmetic gel per day, total CapEx is estimated at USD 400,000–700,000 at 2026 prices in a lower-cost producing region, such as an Asian or Latin American industrial park. The machinery benchmark is a Uttar Pradesh MSME aloe vera juice project report that prices a 400 liter-per-day leaf line at about USD 22,000, converted from rupees at 88 per dollar. Scaled to about 350 kg of leaf per hour with a 0.6 capacity exponent and a 10% price uplift, the leaf line costs roughly USD 40,000–50,000. The cosmetic side adds USD 70,000–100,000 for a vacuum homogenizer-mixer, two automatic tube filling and sealing machines, jar filling, coding and a purified-water system. A U.S. or EU site would cost roughly two to three times as much (assumed), and the full report can be customized to any country.
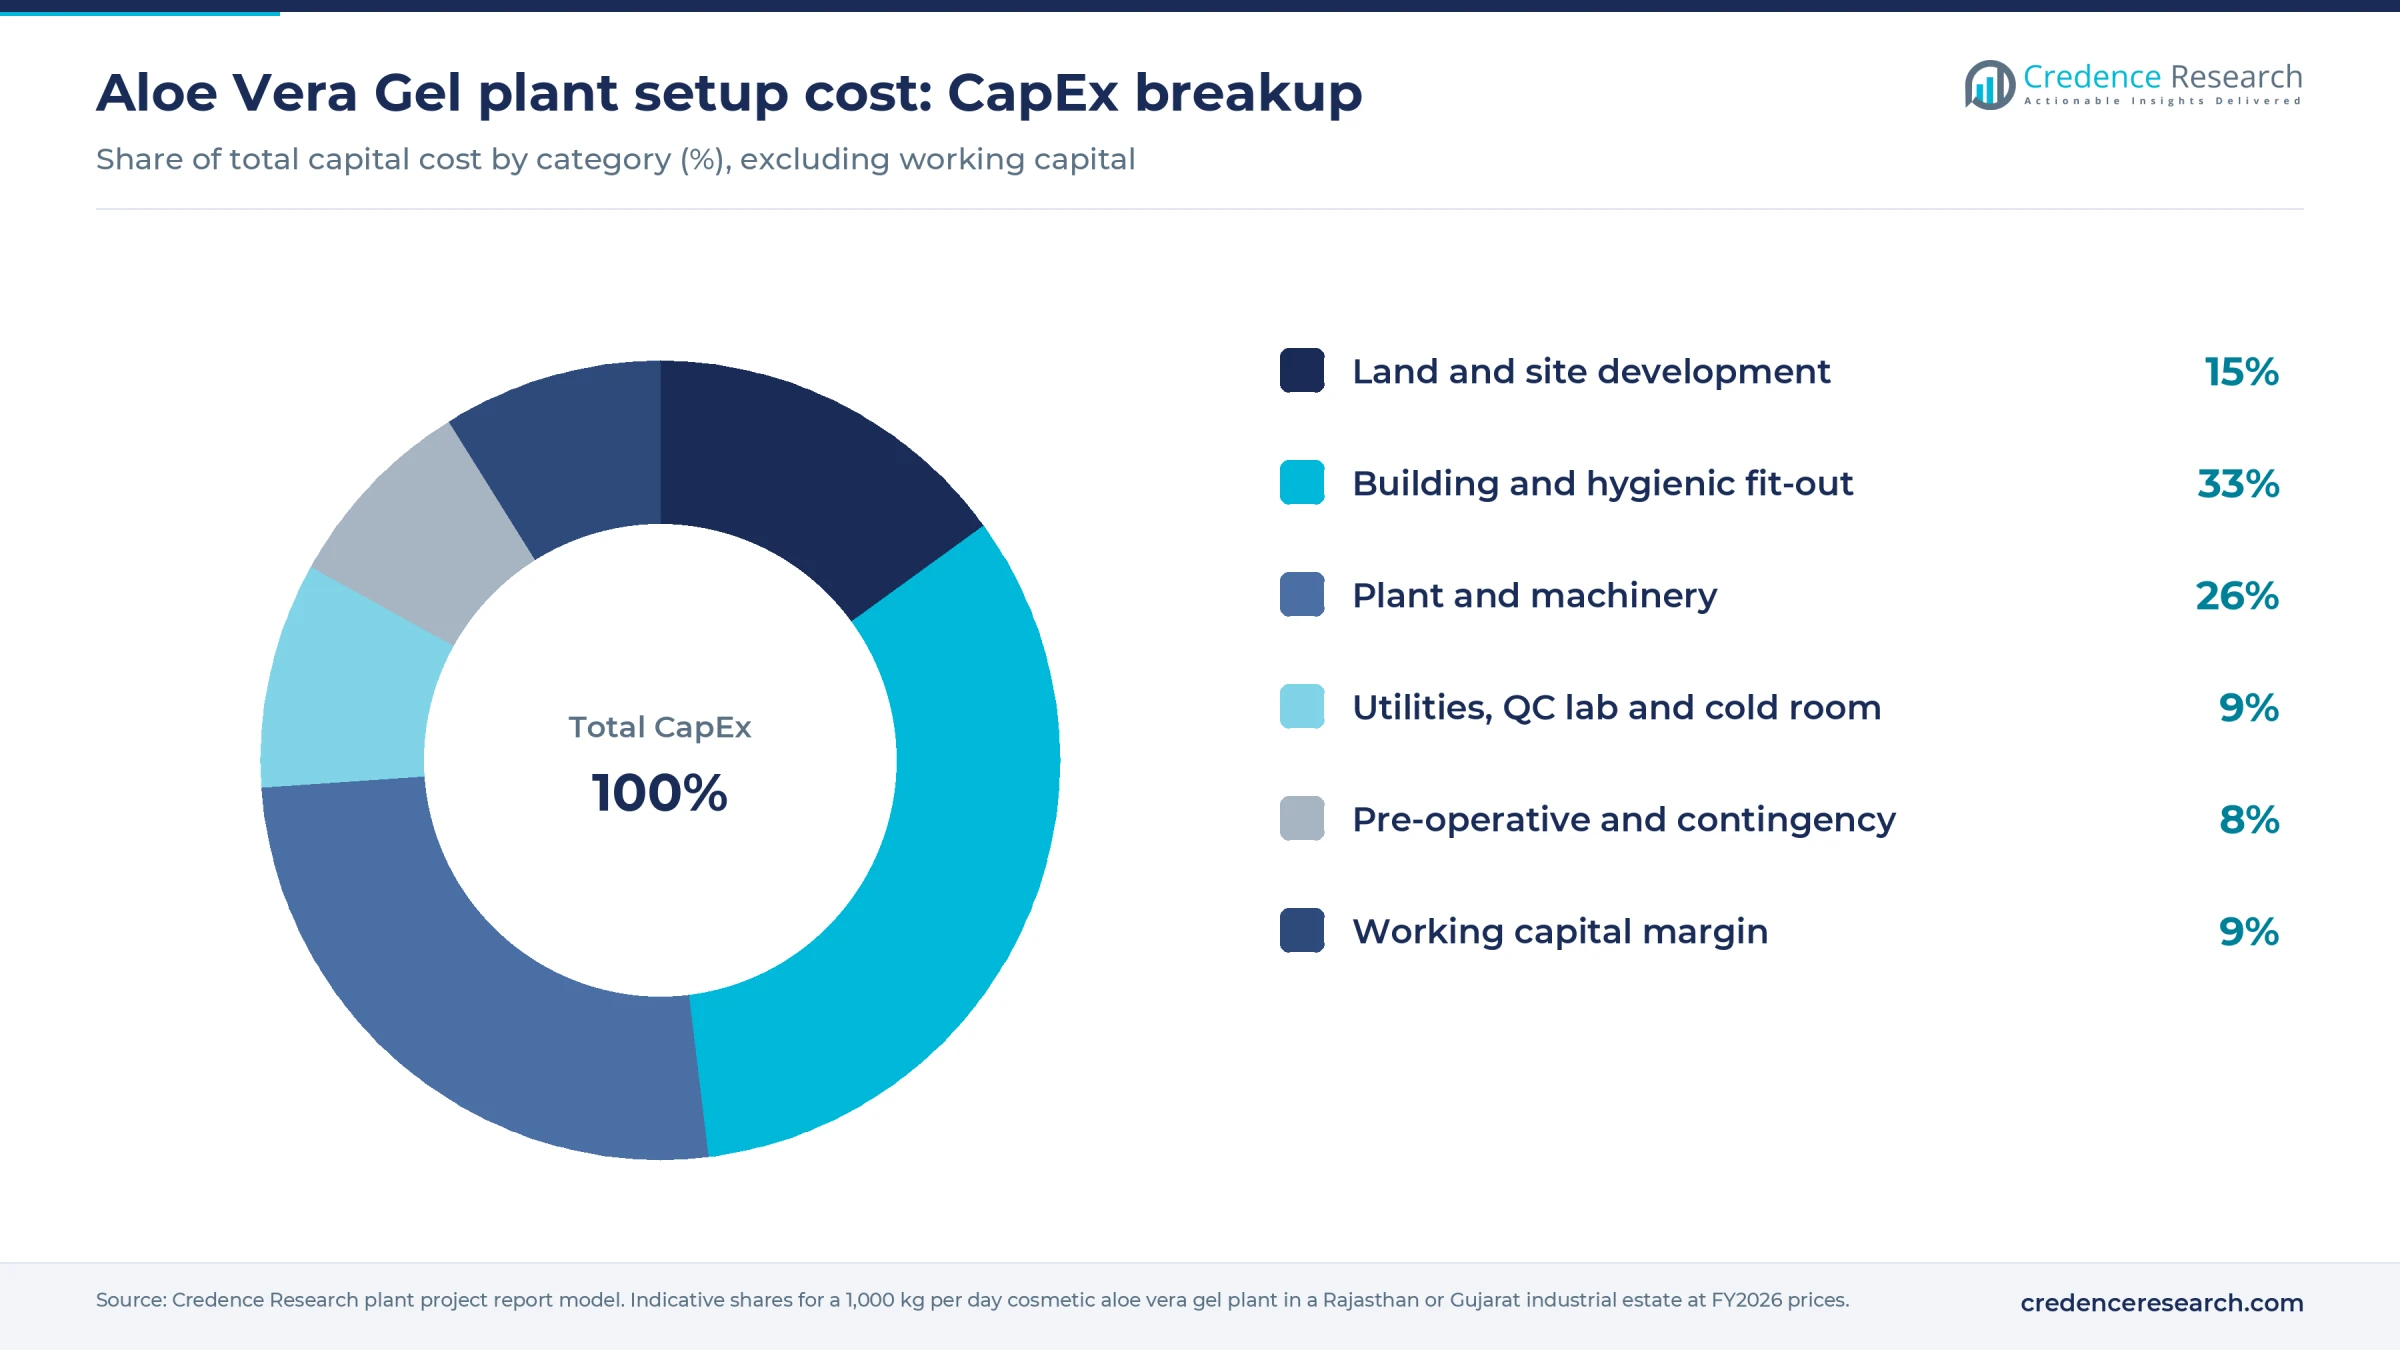
| CapEx head | Indicative share | What drives it |
|---|---|---|
| Land and site development | 15% | Industrial park rate and plot size |
| Building and hygienic fit-out | 33% | Filling room finishes, air handling, leaf receiving bay |
| Plant and machinery | 26% | Leaf line, vacuum mixer, tube and jar fillers |
| Utilities, QC lab and cold room | 9% | Chiller, purified water, microbiology lab, standby generator |
| Pre-operative, licensing and contingency | 8% | Trial batches, stability tests, approvals |
| Working capital margin | 9% | Packaging stock and receivables from distributors |
Worked example for land: a plot of 2,500–3,000 square meters at an assumed USD 17–40 per square meter in an Asian industrial park costs USD 45,000–115,000, about 15% of the midpoint budget. At an assumed USD 50–150 per square meter on a U.S. or EU site, the same plot costs USD 125,000–450,000. Building outranks machinery because a cosmetic filling room needs epoxy floors, washable walls, controlled air and separate leaf, formulation and packing zones, which GMP audits check. Exact line items and supplier quotes are available in the report.
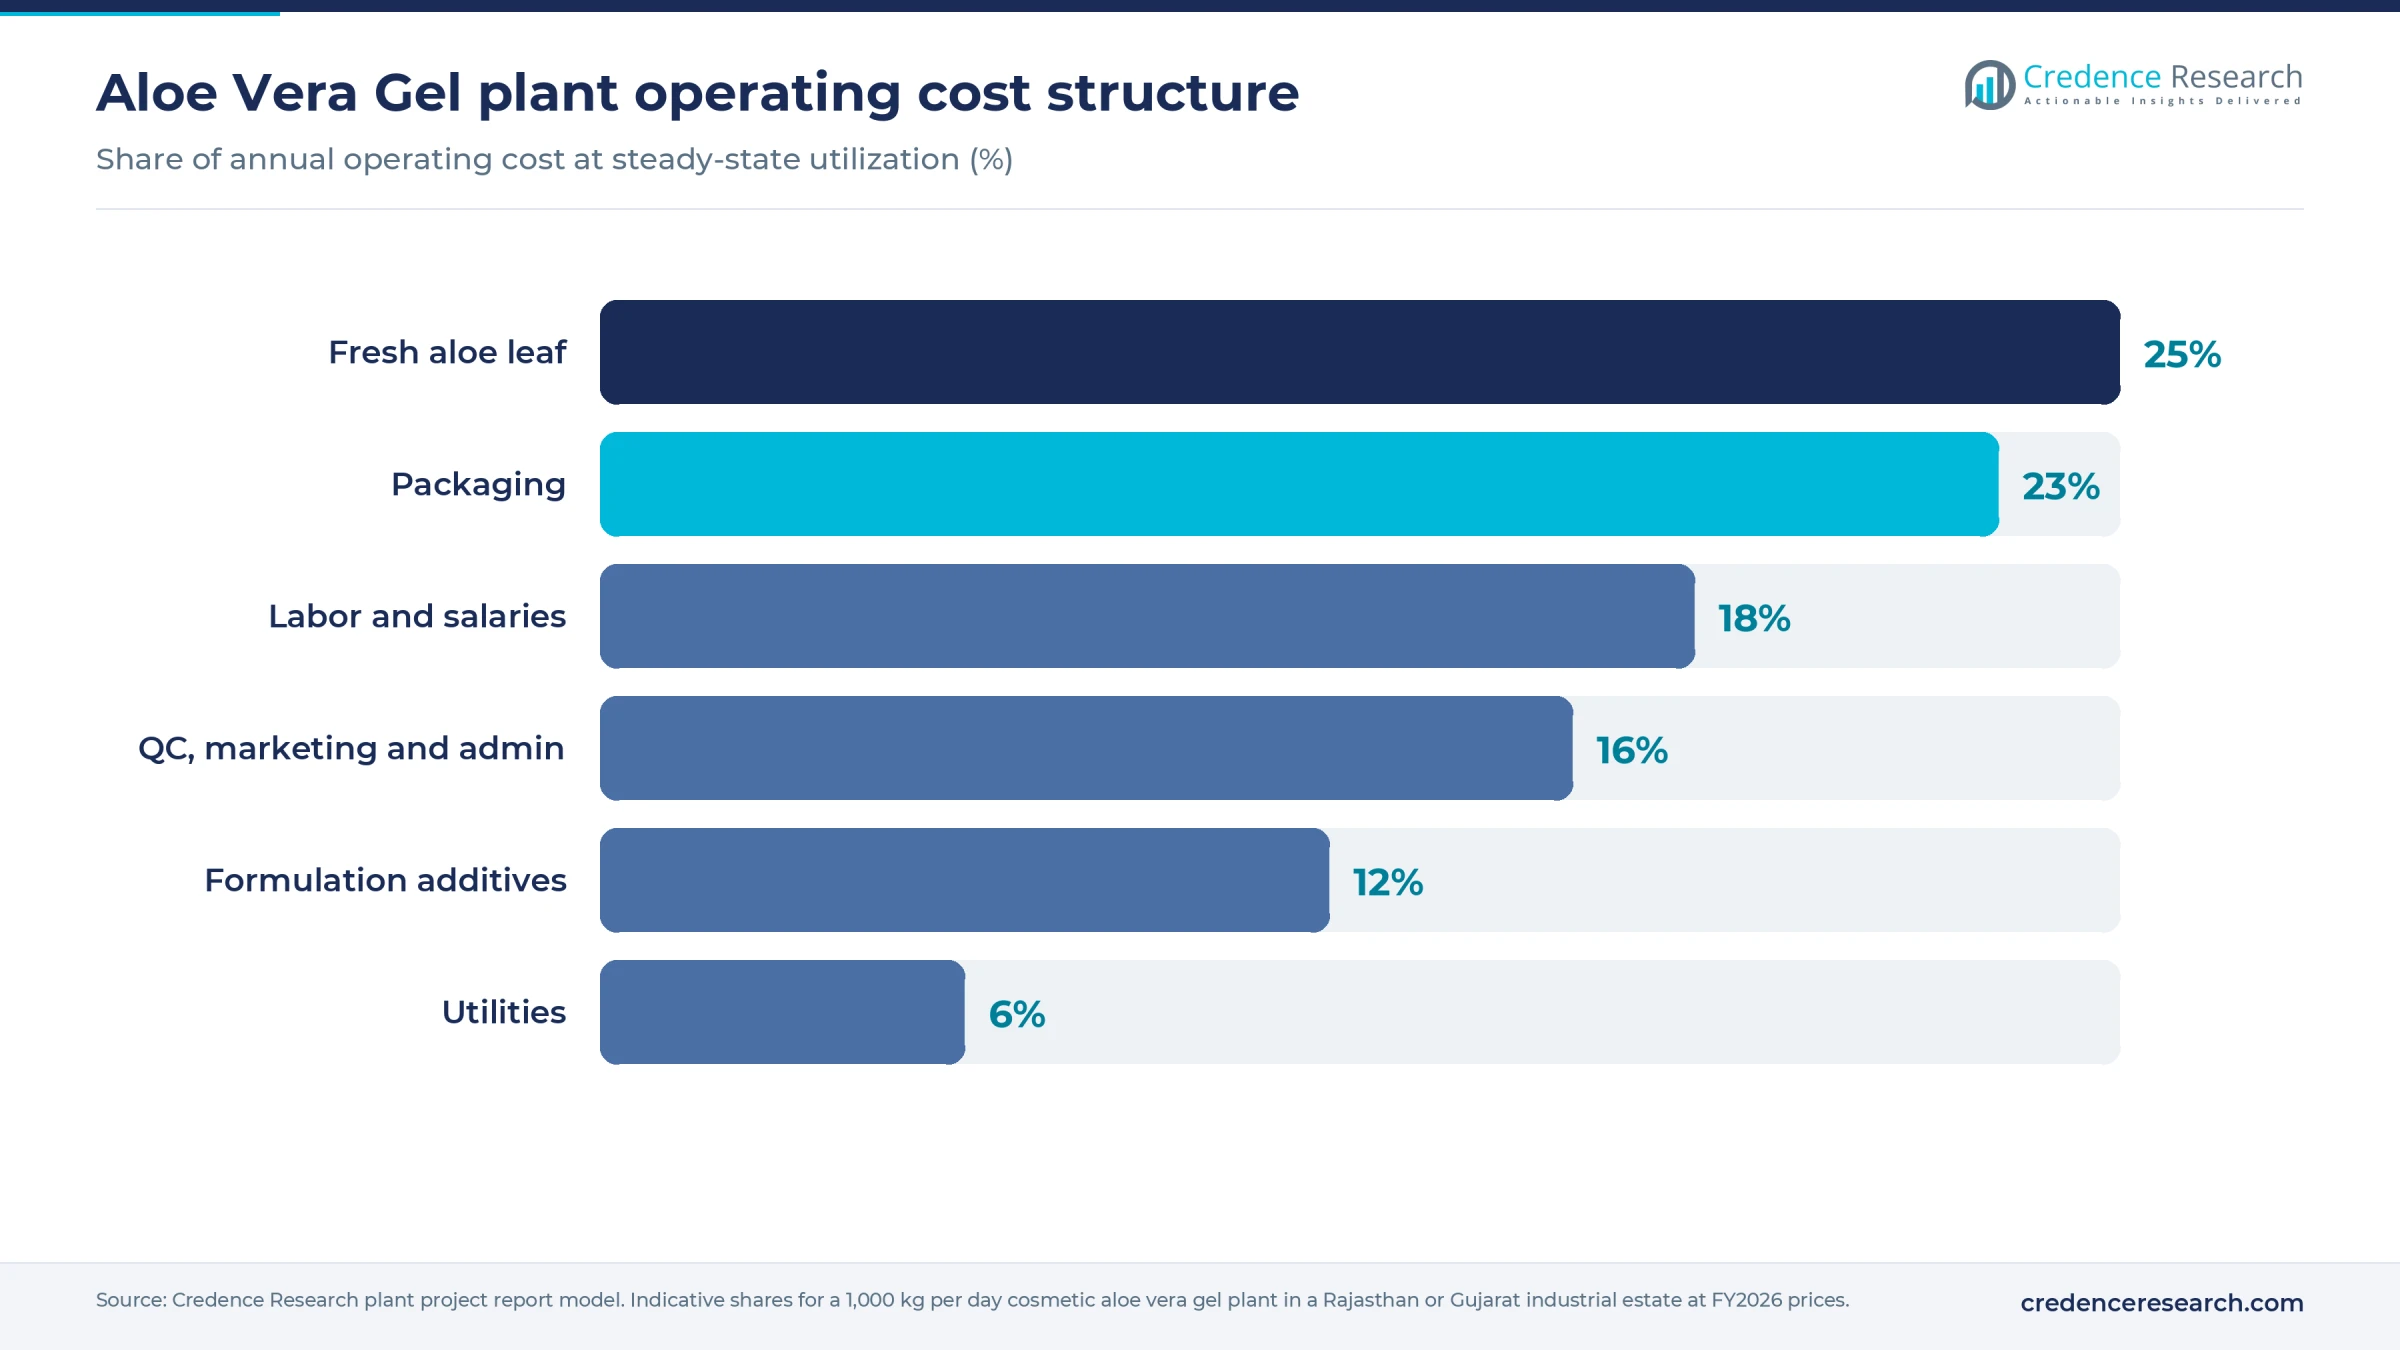
On the operating side, fresh leaf takes about a quarter of annual cost and packaging nearly as much, because a 100 g laminated tube with cap and carton can cost more than the aloe it holds.
Machinery and raw materials for an aloe vera gel plant
The core equipment list for a 1,000 kg per day cosmetic plant covers two zones.
- Leaf zone: leaf washer with brush rollers, sanitizing tank, cutting tables, aloe peeling or filleting machine, pulper or colloid mill, vibrating screen and cartridge filters, plate pasteurizer and chilled SS 316 holding tanks.
- Cosmetic zone: vacuum homogenizer-mixer of 500–1,000 liters, transfer pumps, automatic tube filling and sealing machines, jar filling and capping machine, batch coder, labeling and shrink-wrap units.
- Support: purified-water system, chiller, cold room, standby generator, boiler or hot-water generator, and a QC lab with pH meter, viscometer, laminar-flow bench and incubator.
Commercial leaf comes from a handful of growing belts: Mexico's Tamaulipas state and Texas's Rio Grande Valley, which feed large integrated processors, the Dominican Republic, and Asian plantations in Thailand, China and India's Rajasthan. The plant should sit within 100–150 km of its growing cluster, because leaf cannot travel far without browning, so the farm base decides location more than proximity to customers. Farm-gate prices in South Asian plantations run near USD 0.17–0.23 per kg and plantations yield about 15–20 tonnes of leaf per hectare from the second year. The other inputs are a carbomer or xanthan thickener, glycerin, preservatives such as phenoxyethanol, vitamin E, fragrance, and packaging in LDPE or laminated tubes, PET or PP jars, cartons and shippers. Brand owners often specify their own tube artwork, which ties up packaging working capital, and supply trends for that input are tracked in the cosmetic tube packaging market report.
Aloe vera gel business profit margin and ROI
Gross margin is built from a blended ex-factory price of USD 2.6–3.6 per kg in a lower-cost region, assuming 60% of volume leaves as packed tubes and jars at USD 3.4–4.5 per kg and 40% as bulk drums at USD 1.5–2.3 per kg. Variable cost comes to about USD 1.5–2.1 per kg, made up of 2.5–3 kg of leaf (USD 0.45–0.70), thickener, glycerin and preservatives (USD 0.23–0.34), blended packaging (USD 0.45–0.63) and direct power, labor and testing (USD 0.34–0.45). That leaves a gross margin of 30–42%. U.S. and EU plants earn higher prices but carry higher costs, and the full report rebuilds the margin by country.
At 75–85% utilization, annual revenue lands near USD 0.6–0.9 million. After fixed salaries, marketing and administration of roughly USD 100,000–160,000, steady-state cash profit of about USD 115,000–230,000, reached from year three, gives a payback of 3.5–6 years on the stated CapEx. The direction of sensitivity is clear: shifting product mix toward packed retail units lifts margin faster than any cost saving, while a drop in leaf recovery from 40% to 30% raises leaf cost per kg of gel by about a third, and payback runs past six years when a low price coincides with low utilization.
| Metric | Value |
|---|---|
| Gross margin | 30–42% |
| Payback period | 3.5–6 years |
| IRR (post-tax) | Available in report |
| NPV | Available in report |
| ROI | Available in report |
| DSCR | Available in report |
How to start an aloe vera gel business with licenses and approvals
Approvals follow the same sequence in most countries: business and tax registration, land-use and building permits, an environmental permit for wash water and leaf waste, occupational safety and fire approvals, and then product-level cosmetic compliance, which decides market access. Cosmetic gels need no pre-market approval in the main markets, but the maker must keep GMP records, a safety assessment and compliant labels. A gel that claims to treat burns or wounds moves into drug rules, and a drinkable gel is a food.
| Market | Regulator and law | Key obligations for cosmetic aloe gel |
|---|---|---|
| United States | FDA, Federal Food, Drug, and Cosmetic Act as amended by MoCRA 2022 | Facility registration renewed every two years and annual product listing, safety substantiation records, adverse event reporting |
| European Union | Regulation (EC) No 1223/2009, enforced by member-state authorities | EU-based Responsible Person, safety report and product information file, CPNP notification before sale, GMP under ISO 22716 |
| India | CDSCO and state licensing authorities, Cosmetics Rules, 2020 | Manufacturing license applied for in Form COS-5 and issued in Form COS-8, Orange-category pollution board consent |
MoCRA exempts certain small U.S. businesses from registration and listing, and an EU importer can act as the Responsible Person for a non-EU maker.
Key aloe vera gel manufacturers and recent developments
Global aloe gel supply runs on vertically integrated growers and processors such as Forever Living Products, which farms aloe in Texas and the Dominican Republic, and Aloecorp, which grows and processes leaf in Tamaulipas, Mexico. Branded finished gels include Fruit of the Earth and Lily of the Desert in the United States, LR Health & Beauty in Germany, Nature Republic in South Korea, and Patanjali, Dabur and Honasa Consumer's Mamaearth in India.
- December 2025: The FDA issued draft guidance on mandatory cosmetic recalls under MoCRA, and by January 2026 its system held about 993,000 active product listings from 14,299 registered facilities.
- March 2026: Forever Living India said its Forever aloe vera gel, a 99.7% inner-leaf aloe gel positioned for digestive health, is now made in India, though the aloe is still sourced from the company's plantations in Texas and the Dominican Republic.
- May 2026: India's CDSCO issued a public advisory that cosmetics are meant only to cleanse or beautify and must not carry misleading claims, which applies to the healing and treatment language often seen on aloe gel labels.
Recall readiness and claim discipline now shape labels in the largest markets.
What's inside the Aloe Vera Gel project report PDF
The report runs to 21 chapters. Open a chapter to see its sections.
1. Preface
2. Scope and Methodology
- 2.1 Objectives of the Study
- 2.2 Stakeholders
- 2.3 Research Methodology
- 2.4 Data Sources and Key Assumptions
3. Executive Summary
- 3.1 Market Snapshot
- 3.2 Project at a Glance (Capacity, CapEx, OpEx)
- 3.3 Key Financial Indicators (IRR, NPV, Payback, Break-even)
- 3.4 Feasibility Verdict
4. Product Overview
- 4.1 Aloe Vera Gel Definition and Properties
- 4.2 Grades and Specifications (BIS / ISO / ASTM)
- 4.3 HS Code and Classification
- 4.4 Key Applications
- 4.5 Substitutes
5. Global Aloe Vera Gel Market
- 5.1 Market Overview
- 5.2 Historical and Current Market Performance (Volume and Value)
- 5.3 Market Breakup by Grade / Type
- 5.4 Market Breakup by End-Use Industry
- 5.5 Market Breakup by Region
- 5.6 Market Drivers, Restraints and Trends
- 5.7 Value Chain Analysis
- 5.8 Market Forecast
6. Target Country Aloe Vera Gel Market Analysis
- 6.1 Demand and Supply Analysis
- 6.2 Installed Capacity vs Demand Gap
- 6.3 Import Dependence
- 6.4 Demand Forecast by End-Use
7. Trade Analysis
- 7.1 Imports by Volume, Value and Country
- 7.2 Exports by Volume, Value and Country
- 7.3 Trade Balance and Opportunities
8. Price Analysis
- 8.1 Historical Aloe Vera Gel Price Trends by Region
- 8.2 Raw Material / Feedstock Price Trends and Linkage
- 8.3 Price Forecast
- 8.4 Margins Across the Value Chain
9. Competitive Landscape
- 9.1 Market Structure
- 9.2 Key Players and Installed Capacities
- 9.3 Profiles of Key Players
- 9.4 Recent Developments (Expansions, M&A, New Plants)
10. Manufacturing Process and Technology
- 10.1 Comparison of Technology Routes
- 10.2 Selected Route and Process Flow Diagram
- 10.3 Unit Operations Involved
- 10.4 Chemical Reactions Involved
- 10.5 Mass Balance and Raw Material Requirements
- 10.6 Energy Balance
- 10.7 Quality Assurance Criteria and Technical Tests
- 10.8 By-products and Waste Handling
- 10.9 Technology Licensors / Providers
11. Project Details, Requirements and Costs
- 11.1 Land, Location and Site Development
- 11.1.1 Site Selection Criteria
- 11.1.2 Location Analysis
- 11.1.3 Land Requirement and Costs
- 11.1.4 Site Development Costs
- 11.2 Plant Layout
- 11.2.1 Layout Principles
- 11.2.2 Proposed Layout
- 11.2.3 Factors Influencing Layout
- 11.3 Civil Works and Buildings
- 11.4 Plant Machinery
- 11.4.1 Machinery Requirements and Specifications
- 11.4.2 Machinery Costs
- 11.4.3 Machinery Suppliers
- 11.5 Raw Materials
- 11.5.1 Requirements per Tonne of Output
- 11.5.2 Procurement and Sourcing
- 11.5.3 Costs
- 11.5.4 Suppliers
- 11.6 Packaging
- 11.6.1 Packaging Requirements
- 11.6.2 Packaging Costs
- 11.6.3 Packaging Suppliers
- 11.7 Storage and Material Handling
- 11.8 Transportation Requirements and Costs
- 11.9 Utilities
- 11.9.1 Power Requirements and Costs
- 11.9.2 Water Requirements and Costs
- 11.9.3 Steam, Fuel and Other Utilities
- 11.10 Manpower Requirements and Wages
12. Environment, Health, Safety and Sustainability
- 12.1 Effluent and Emissions Management
- 12.2 Hazard Classification and Safety Measures
- 12.3 Carbon Footprint
- 12.4 Green / Low-Carbon Process Options
13. Regulatory Procedures, Approvals and Certifications
- 13.1 Licences and Registrations
- 13.2 Environmental Clearances
- 13.3 Product Certifications (BIS, REACH, etc.)
- 13.4 Approval Timeline
14. Project Implementation Schedule
15. Project Economics
- 15.1 Capital Cost of the Project
- 15.2 Techno-Economic Parameters
- 15.3 Capacity Utilization and Ramp-up
- 15.4 Product Pricing and Margins
- 15.5 Income Projections
- 15.6 Expenditure Projections
- 15.7 Working Capital Requirement
- 15.8 Taxation
- 15.9 Depreciation
16. Financial Analysis
- 16.1 Projected Profit and Loss Account
- 16.2 Projected Cash Flow Statement
- 16.3 Projected Balance Sheet
- 16.4 Liquidity Analysis
- 16.5 Profitability Analysis (Payback, NPV, IRR, ROI)
- 16.6 Break-even Analysis
- 16.7 Debt Service Coverage Ratio (DSCR)
- 16.8 Sensitivity Analysis
- 16.9 Scenario and Uncertainty Analysis
17. Funding and Incentives
- 17.1 Means of Finance and Debt-Equity Structure
- 17.2 Loans and Financial Assistance
- 17.3 Government Schemes and Subsidies (PLI, State Policies)
18. Risk Assessment
- 18.1 Key Success Factors
- 18.2 Key Risk Factors
- 18.3 Risk Mitigation
19. Strategic Recommendations
20. Case Study of a Successful Venture
21. Appendix
- 21.1 Detailed Assumptions
- 21.2 Abbreviations
- 21.3 List of Tables and Figures
- 21.4 Sources
This page vs. the full report
| Data point | On this page (free) | In the full report |
|---|---|---|
| Total CapEx | One rounded range at one capacity | Exact figure at three capacities with a line-item breakup |
| CapEx breakup | Category shares (%) only | Cost, quantity and supplier for every machine |
| Operating cost | Share of raw materials, utilities and labor | Per-unit cost sheet with each input price and consumption |
| Profitability | Gross margin range and payback band | Exact IRR, NPV, ROI, break-even and DSCR |
| Financial statements | List of what is included | 10-year P&L, cash flow, balance sheet and Excel model |
| Sensitivity | One directional line | Full sensitivity and scenario tables |
| Process | Simplified flow diagram | Detailed process flow, mass and energy balance, operating conditions |
| Machinery | Names of the main machines | Specifications, capacity, cost and supplier list |
| Market | Headline size, growth and India demand trend | Segment, region, trade and price forecast tables |
| Suppliers and buyers | Supplier types and sourcing hubs | Named suppliers and buyers |
Aloe Vera Gel project report: FAQs
How much does it cost to set up an aloe vera gel plant?
Which approvals are needed to manufacture aloe vera gel?
What is the profit margin in aloe vera gel manufacturing?
How many aloe leaves are needed per kg of gel?
What is the payback period for an aloe vera gel plant?
Where should an aloe vera gel plant be located?
Can an aloe vera gel plant also make aloe juice?

About the analyst
Rajdeep Kumar Deb, Lead Analyst - Consumer & Finance
Rajdeep brings a decade of consumer goods and financial services insight to strategic market analysis.
Related market research
- Aloe Vera Product Market Size, Growth, share and Forecast 2032
- Skin Care Products Market Size, Growth, Share and Forecast 2032
- Asia Pacific Herbal Beauty Products Market Size, Share, Growth and Forecast, 2025-2035
- Herbal Extract Market Size, Growth, Analysis & Forecast 2032
- Natural Cosmetics Market Size, Share, Growth and Forecast 2032
More plant project reports
- Ceiling Fan Manufacturing Plant Project Report (DPR) 2026
- Avocado Oil Processing Plant Project Report (DPR) 2026
- Aluminium Cans Manufacturing Plant Project Report (DPR) 2026
- Potato Processing Plant Prefeasibility Report 2026
- Corn Starch Manufacturing Plant Project Report (DPR) 2026
- Copper Sulphate Manufacturing Plant Project Report (DPR) 2026