
Market Overview
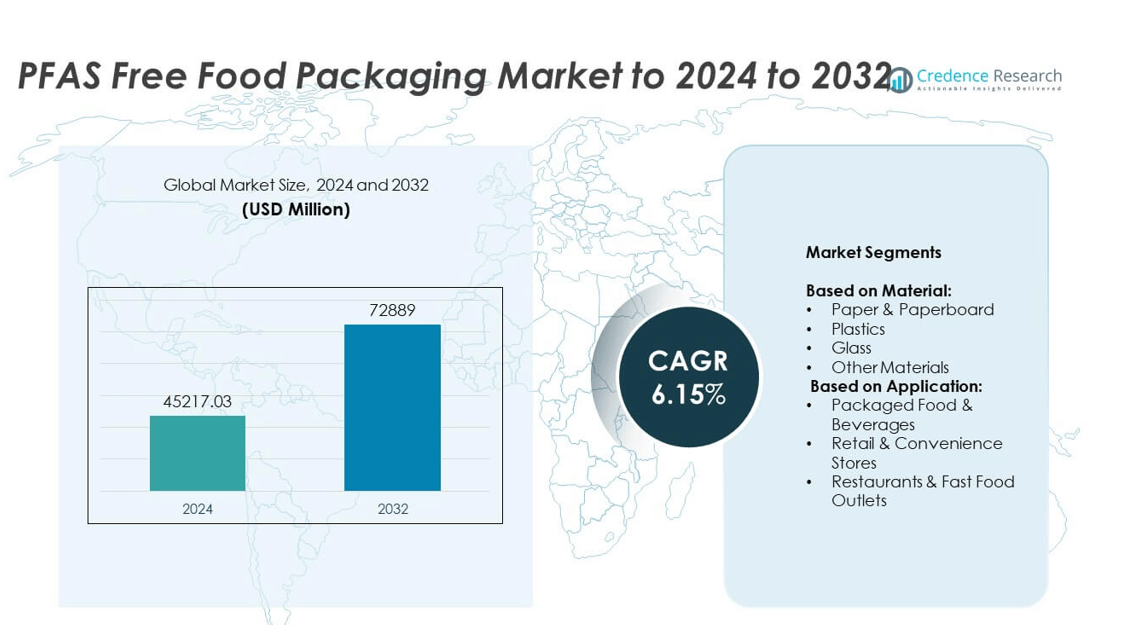
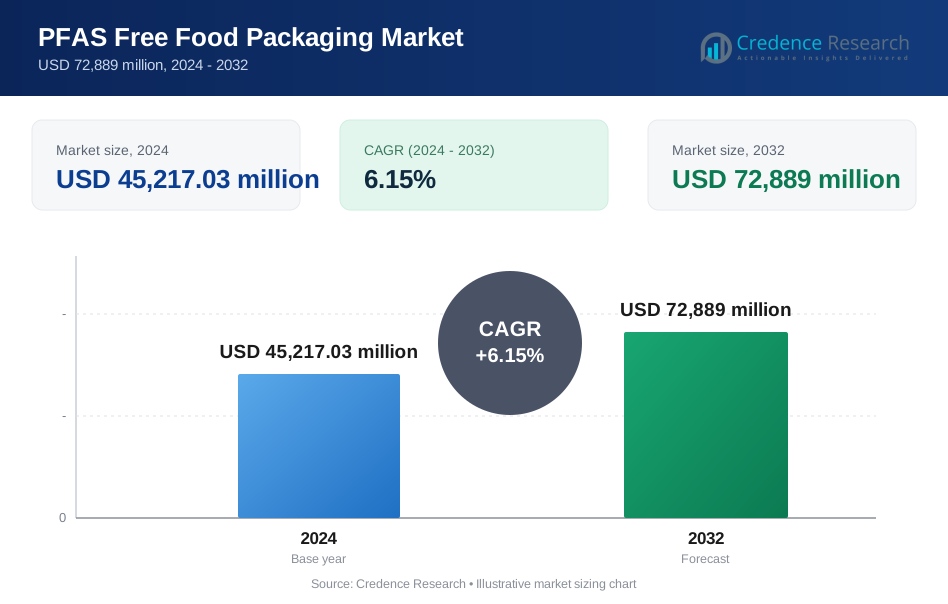
PFAS Free Food Packaging Market size was valued at USD 45,217.03 million in 2024 and is anticipated to reach USD 72,889 million by 2032, at a CAGR of 6.15% during the forecast period.
| REPORT ATTRIBUTE | DETAILS |
|---|---|
| Historical Period | 2020-2023 |
| Base Year | 2024 |
| Forecast Period | 2025-2032 |
| PFAS Free Food Packaging Market Size 2024 | USD 45,217.03 million |
| PFAS Free Food Packaging Market, CAGR | 6.15% |
| PFAS Free Food Packaging Market Size 2032 | USD 72,889 million |
The PFAS free food packaging market is led by key players such as Stora Enso, CarePac, Ahlstrom, delfortgroup AG, MGC, Fox Packaging, Novolex, Detpak, and APP Group, who focus on developing sustainable, PFAS-free solutions to meet regulatory and consumer demand. These companies are investing in advanced paper-based barrier coatings, compostable materials, and recyclable packaging technologies to enhance performance and compliance. North America dominated the market with over 35% share in 2024, driven by strict PFAS bans and rapid adoption by food service providers. Europe followed with nearly 30% share, supported by stringent EU regulations and circular economy initiatives.
Market Insights
- The PFAS free food packaging market was valued at USD 45,217.03 million in 2024 and is projected to reach USD 72,889 million by 2032, growing at a CAGR of 6.15%.
- Growth is driven by global PFAS bans, rising consumer preference for safe packaging, and innovations in PFAS-free barrier coatings that maintain grease and moisture resistance.
- Key trends include adoption of circular economy packaging, expansion of quick-service restaurant and e-commerce packaging, and development of cost-effective recyclable and compostable solutions.
- The market is competitive with major players focusing on R&D, local production capacity expansion, and strategic partnerships with food brands to strengthen market position and ensure compliance.
- North America leads with over 35% share, followed by Europe at nearly 30%, Asia Pacific at 25%, and Latin America and Middle East & Africa contributing 6% and 4% respectively, with paper & paperboard dominating material share.
Market Segmentation Analysis:
By Material
Paper & paperboard dominated the PFAS free food packaging market in 2024, accounting for over 45% of the market share. The dominance is driven by rising demand for sustainable, compostable, and recyclable packaging solutions aligned with PFAS restrictions. Regulatory pressure and consumer preference for eco-friendly materials are accelerating the adoption of paper-based coatings and barrier solutions. Plastics remain significant for their durability and cost-efficiency, while glass is used in premium packaging for beverages. Other materials, including biodegradable polymers, are gaining traction as alternatives to PFAS-treated substrates in niche applications.
- For instance, Amcor’s 2024 Sustainability Report notes that over 94 % of its flexible packaging portfolio by area has a recycle-ready solution, and 95 % of rigid packaging by weight is recyclable in practice and at scale.
By Application
Packaged food & beverages led the market with over 50% share in 2024, driven by rising consumption of ready-to-eat meals, dairy, and frozen food products. Demand is supported by stringent food safety standards and regulations limiting PFAS in direct food contact materials. Retail and convenience stores follow, adopting PFAS-free wraps and containers to meet sustainability commitments. Restaurants and fast-food outlets are increasingly switching to PFAS-free takeaway packaging, driven by consumer awareness and regulatory bans on PFAS-lined food containers in several regions, further boosting market growth.
- For instance, Mamavation tested 81 pieces of fast food and fast casual packaging for PFAS content.
Market Overview
Regulatory Push for PFAS-Free Packaging
Government regulations banning PFAS in food packaging remain the primary growth driver for the market. Countries across North America and Europe are introducing strict limits on PFAS usage, forcing packaging manufacturers to switch to compliant alternatives. This regulatory momentum encourages large-scale investment in PFAS-free coatings and barrier technologies. Brands are rapidly adopting compliant solutions to avoid legal risks and meet consumer expectations, driving strong demand. This driver holds the most significant impact, as compliance remains non-negotiable for companies serving global food and beverage markets.
- For instance, ZeroF project (EU) is developing new PFAS-free coating technologies to replace PFAS in food packaging and textiles. It is a 36-month project started in 2023.
Rising Consumer Demand for Sustainable Packaging
Increasing consumer awareness of health and environmental impacts of PFAS drives the shift toward safer packaging. Shoppers are actively choosing products with labels highlighting PFAS-free and eco-friendly credentials. Brands are responding by introducing sustainable, recyclable, and compostable solutions to strengthen brand loyalty. This consumer-driven shift fuels demand across packaged foods, beverages, and restaurant takeaways. Companies using PFAS-free packaging gain competitive advantage by aligning with sustainability goals and catering to growing environmentally conscious consumer segments.
- For instance, Mondi reported that in 2022, 82 % of its revenue came from packaging and paper products that are reusable, recyclable or compostable.
Technological Advancements in Barrier Coatings
Innovation in PFAS-free barrier technologies is accelerating market adoption across material types. Manufacturers are developing water-based, bio-based, and polymer coatings that replicate PFAS performance in grease and moisture resistance. These advancements enable paperboard and other substrates to meet functional requirements without compromising recyclability. Improved manufacturing processes are also reducing production costs, making PFAS-free solutions more commercially viable. This driver supports large-scale adoption across food categories, helping the market expand beyond regulatory compliance into mainstream packaging solutions.
Key Trends & Opportunities
Shift Toward Circular Economy Packaging
The PFAS-free food packaging market is witnessing a major trend toward circular economy solutions. Companies are investing in packaging designed for recyclability and compostability, supporting closed-loop systems. Partnerships between food brands and packaging producers are rising to create end-of-life solutions that meet local waste infrastructure requirements. This trend opens opportunities for bio-based coatings and recyclable materials, allowing brands to reduce landfill waste. Companies that offer fully recyclable PFAS-free packaging are gaining traction among global retailers seeking to meet sustainability commitments.
- For instance, in its 2024 Sustainability Report (released in March 2025), Berry Global reported that 93% of its fast-moving consumer goods (FMCG) packaging is now either recyclable or has a validated recyclable alternative. The company also increased its total purchases of post-consumer recycled (PCR) resin by 43% year-over-year in 2024. A separate November 2024 report noted that its European flexibles division increased its use of PCR polyethylene (PE) by 36% year-on-year across industrial, consumer, and agricultural film products, incorporating an additional 4,386 metric tons of PCR content.
Growth in Quick-Service and E-Commerce Packaging
The rise of online food delivery and takeout services is creating strong opportunities for PFAS-free packaging adoption. Quick-service restaurants and delivery platforms are shifting to PFAS-free wrappers, boxes, and containers to meet regulatory requirements and improve brand image. Demand is growing for packaging that can handle heat, moisture, and transport stress without PFAS. This trend benefits producers of durable PFAS-free barrier materials, opening lucrative opportunities in the fast-expanding e-commerce food sector and boosting overall market penetration.
- For instance, Restaurant Brands International (owner of Burger King, Popeyes, and Tim Hortons) committed to phasing out intentionally added PFAS in its food packaging globally by the end of 2025. As of 2024, the company had already eliminated intentionally added PFAS from approximately 97% of approved guest packaging volumes globally
Key Challenges
Higher Cost of PFAS-Free Alternatives
One of the major challenges is the higher production cost of PFAS-free coatings compared to traditional PFAS-based solutions. Developing high-performance alternatives requires investment in R&D and advanced coating technology, leading to increased packaging prices. This cost pressure can deter adoption among small and medium food businesses with tight budgets. Price sensitivity in emerging markets further limits penetration, requiring cost optimization strategies from packaging suppliers to make PFAS-free solutions economically viable and competitive at scale.
Performance Limitations in Certain Applications
PFAS-free solutions often face challenges in matching the superior grease, water, and heat resistance of PFAS-based coatings. Some alternative materials struggle with durability in applications involving hot or oily foods. This performance gap may restrict adoption in segments like quick-service restaurants where packaging functionality is critical. Ongoing research is focused on improving barrier performance and maintaining recyclability. Until these limitations are addressed, manufacturers may face slower adoption in demanding use cases, impacting overall market growth potential.
Regional Analysis
North America
North America held the largest share of the PFAS free food packaging market in 2024, accounting for over 35% of the total market. Growth is driven by strict state-level bans on PFAS, including regulations in California, Washington, and New York. The presence of major food and beverage brands and a strong focus on sustainable packaging adoption accelerate market expansion. Demand is further supported by consumer preference for eco-friendly packaging and the rapid shift by quick-service restaurants toward PFAS-free solutions. Manufacturers are heavily investing in developing cost-effective paper-based and compostable solutions to meet growing demand across the region.
Europe
Europe accounted for nearly 30% of the PFAS free food packaging market in 2024, supported by stringent EU chemical regulations and the upcoming restriction on PFAS under REACH. The region’s commitment to circular economy goals is driving the adoption of recyclable and compostable packaging solutions. Demand is strong across retail, food service, and packaged food sectors, with countries like Germany, France, and the UK leading adoption. Industry players are partnering with food brands to supply PFAS-free barrier coatings that meet EU recyclability standards, further strengthening market growth and supporting the transition to a PFAS-free packaging ecosystem.
Asia Pacific
Asia Pacific captured around 25% market share in 2024, with growth fueled by rising packaged food consumption in China, India, and Southeast Asia. Increasing government initiatives to curb hazardous chemicals in food contact materials are encouraging the use of PFAS-free solutions. Rapid urbanization and expansion of quick-service restaurants are driving demand for safe and sustainable packaging. Manufacturers are scaling production capacity and launching affordable PFAS-free solutions to meet the needs of price-sensitive markets. Growing awareness of food safety and sustainability is expected to further accelerate adoption and make Asia Pacific one of the fastest-growing regions.
Latin America
Latin America represented close to 6% of the PFAS free food packaging market share in 2024. Growth is supported by rising health awareness and gradual regulatory action in countries such as Brazil and Mexico. Food service chains and retailers are transitioning to PFAS-free packaging to improve sustainability credentials and meet evolving consumer expectations. Adoption is slower compared to developed regions due to cost concerns, but demand is steadily increasing in urban areas. Investments in local production and collaborations with global packaging companies are expected to make PFAS-free solutions more accessible in the coming years.
Middle East & Africa
The Middle East & Africa region held about 4% of the market share in 2024, with adoption driven by growing food delivery services and modern retail formats. Regulatory activity is still developing, but multinational food and beverage players are introducing PFAS-free packaging to align with global standards. Urban centers such as Dubai, Riyadh, and Johannesburg are leading demand, supported by rising consumer awareness of food safety. Limited local manufacturing capacity poses a challenge, but imports of PFAS-free packaging materials are helping meet demand and gradually promoting wider adoption across the region.
Market Segmentations:
By Material:
- Paper & Paperboard
- Plastics
- Glass
- Other Materials
By Application:
- Packaged Food & Beverages
- Retail & Convenience Stores
- Restaurants & Fast Food Outlets
By Geography:
- North America
- U.S.
- Canada
- Mexico
- Europe
- Germany
- France
- U.K.
- Italy
- Spain
- Rest of Europe
- Asia Pacific
- China
- Japan
- India
- South Korea
- South-east Asia
- Rest of Asia Pacific
- Latin America
- Brazil
- Argentina
- Rest of Latin America
- Middle East & Africa
- GCC Countries
- South Africa
- Rest of the Middle East and Africa
Competitive Landscape
The PFAS free food packaging market is highly competitive, with key players including Stora Enso, CarePac, Ahlstrom, delfortgroup AG, MGC, Fox Packaging, Novolex, Detpak, Kroonpak, Solenis, YUTOECO, APP Group, Melodea, Genpak, Guyenne Papier, Farnell Packaging, and CARCCU. The market is characterized by continuous investment in sustainable packaging innovations, particularly in paper-based and bio-based barrier solutions. Companies are focusing on expanding their product portfolios to meet regulatory requirements and consumer demand for PFAS-free options. Strategic partnerships with food service providers and retailers are becoming common to ensure reliable supply chains. Players are investing in R&D to enhance grease, heat, and moisture resistance without compromising recyclability. Regional expansions and local production facilities are helping reduce costs and meet demand in emerging markets. Competitive pricing and differentiation through technology-driven solutions remain critical success factors, as the industry experiences rising adoption across food packaging, retail, and quick-service restaurant applications.
Key Player Analysis
- Stora Enso
- CarePac
- Ahlstrom
- delfortgroup AG
- MGC
- Fox Packaging
- Novolex
- Detpak
- Kroonpak
- Solenis
- YUTOECO
- APP Group
- Melodea
- Genpak
- Guyenne Papier
- Farnell Packaging
- CARCCU
Recent Developments
- In 2023, Melodea, a green-tech company, launched VBseal, a new PFAS-free, sustainable barrier coating solution designed to reduce plastic waste in consumer-packaged goods.
- In 2023, Novolex significantly expanded its Vanguard® line, a range of PFAS-free fiber-based food packaging made from sugarcane bagasse.
- In 2023, MGC launched PFAS-free AGELESS, the first oxygen absorber to meet evolving regulatory demands in the smart food packaging market.
Report Coverage
The research report offers an in-depth analysis based on Material, Application and Geography. It details leading market players, providing an overview of their business, product offerings, investments, revenue streams, and key applications. Additionally, the report includes insights into the competitive environment, SWOT analysis, current market trends, as well as the primary drivers and constraints. Furthermore, it discusses various factors that have driven market expansion in recent years. The report also explores market dynamics, regulatory scenarios, and technological advancements that are shaping the industry. It assesses the impact of external factors and global economic changes on market growth. Lastly, it provides strategic recommendations for new entrants and established companies to navigate the complexities of the market.
Future Outlook
- The market will grow steadily due to strict global PFAS bans and regulatory enforcement.
- Demand for paper-based and compostable packaging will continue to dominate across applications.
- Technological innovation in PFAS-free barrier coatings will improve performance and cost efficiency.
- Food brands will increase partnerships with packaging suppliers to ensure compliance and sustainability.
- Quick-service restaurants and delivery platforms will accelerate adoption of PFAS-free packaging.
- Consumer demand for safe and eco-friendly food packaging will remain a major growth driver.
- Asia Pacific will emerge as the fastest-growing region due to urbanization and food service expansion.
- Manufacturers will invest in local production facilities to reduce costs and improve supply chains.
- Retailers will prefer PFAS-free packaging to meet corporate sustainability goals and customer expectations.
- Continuous R&D efforts will focus on developing heat and grease-resistant solutions without compromising recyclability.
Request a Free Sample
Fill in your details and we'll send you a free sample report.
- Sample data tables & charts
- Research methodology
Need a Custom Version of This Report?
Tailor the scope, geography, or segments to your exact requirements.
- Custom geography or segment scope
- Direct access to our analyst team
Frequently Asked Questions
What is the current market size for PFAS Free Food Packaging Market, and what is its projected size in 2032?
At what Compound Annual Growth Rate is the PFAS Free Food Packaging Market projected to grow between 2025 and 2032?
Which PFAS Free Food Packaging Market segment held the largest share in 2024?
What are the primary factors fueling the growth of the PFAS Free Food Packaging Market?
Who are the leading companies in the PFAS Free Food Packaging Market?
Table of Content
Chapter 1. Report Introduction
- 1.1 Report Description & Purpose
- 1.1.1 Report Title & Market Definition
- 1.1.2 Unique Selling Propositions (USP) & Key Differentiators
- 1.1.3 Value Proposition for Stakeholders
- 1.2 Research Objectives
- 1.2.1 Market Sizing Objectives (Volume & Revenue)
- 1.2.2 Segmentation Objectives
- 1.2.3 Competitive Intelligence Objectives
- 1.2.4 Forecast & Scenario Objectives
- 1.3 Report Scope
- 1.3.1 PFAS Free Food Packaging Scope – Types & Subtypes Covered
- 1.3.2 Geographic Scope – Regions & Countries Covered
- 1.3.3 Historical Period, Base Year & Forecast Period (2024; forecast to 2032)
- 1.3.4 Inclusions & Exclusions
- 1.4 HS Code & Classification Framework
- 1.5 Currency, Units & Pricing Basis
- 1.6 Target Stakeholders
- 1.7 Limitations & Assumptions
Chapter 2. Executive Summary
- 2.1 Global PFAS Free Food Packaging Market Snapshot
- 2.1.1 Market Size – Historical (2024) & Forecast (2024-2032) (2024: USD 45,217.03 million → 2032: USD 72,889 million)
- 2.1.2 Volume & Revenue – Global Totals
- 2.1.3 Key Market Highlights – Top Five Facts
- 2.2 PFAS Free Food Packaging Market Segmentation Snapshot
- 2.2.1 Market Split by Region – 2024 vs. 2032
- 2.3 Competitive Snapshot
- 2.3.1 Top 10 Players by Revenue Share – 2024
- 2.3.2 Top 10 Players by Volume Share – 2024
- 2.3.3 Recent Strategic Developments (18-Month Summary)
- 2.4 Key Investment Highlights & Strategic Conclusions
Chapter 3. PFAS Free Food Packaging Market Dynamics & Industry Analysis
- 3.1 Market Overview & Context
- 3.1.1 PFAS Free Food Packaging Market Position in the Broader Automotive Value Chain
- 3.1.2 OEM vs. Replacement Market Dynamics
- 3.1.3 Market Maturity & Development Stage by Region
- 3.2 PFAS Free Food Packaging Market Drivers
- 3.3 PFAS Free Food Packaging Market Restraints & Challenges
- 3.4 PFAS Free Food Packaging Market Opportunities
- 3.5 Porter's Five Forces Analysis
- 3.5.1 Threat of New Entrants
- 3.5.2 Bargaining Power of Suppliers
- 3.5.3 Bargaining Power of Buyers
- 3.5.4 Threat of Substitutes
- 3.5.5 Competitive Rivalry – Intensity Assessment
- 3.6 PFAS Free Food Packaging Value Chain Analysis
- 3.6.1 Upstream – Raw Material/Input Suppliers
- 3.6.1.1 Raw Material/Input 1
- 3.6.1.2 Raw Material/Input 2
- 3.6.1.3 Raw Material/Input 3
- 3.6.2 Midstream – Production/Manufacturing/Service Delivery
- 3.6.2.1 Production/Process Overview
- 3.6.2.2 Key Facility Locations & Capacity by Manufacturer
- 3.6.3 Downstream – Distribution & End Consumer
- 3.6.3.1 Primary Channel – B2B/OEM
- 3.6.3.2 Secondary Channels – Dealer, Retail, Online, Direct
- 3.6.4 Value Chain Profitability Analysis
- 3.6.1 Upstream – Raw Material/Input Suppliers
- 3.7 PESTEL Analysis
- 3.7.1 Political Factors
- 3.7.2 Economic Factors
- 3.7.3 Social Factors
- 3.7.4 Technological Factors
- 3.7.5 Environmental Factors
- 3.7.6 Legal Factors
- 3.8 PFAS Free Food Packaging Supply Chain Analysis
- 3.8.1 Raw Material/Input Supply Risk Assessment
- 3.8.2 Manufacturing Concentration Risk (Geographic Exposure)
- 3.8.3 Trade Disruption Impact Analysis
- 3.9 Regulatory & Policy Landscape
Note: The regulatory and policy landscape section covers regulations based on their applicability to the market, PFAS Free Food Packaging category, geography, and scope of the study. Only regulatory frameworks with a material impact on operations, compliance, trade, sustainability, or market access are analyzed in detail.
Chapter 4. Key Investment Pockets & Opportunity Analysis
- 4.1 PFAS Free Food Packaging Market Attractiveness Analysis
- 4.1.1 By Region – Investment Attractiveness Matrix (Volume × CAGR)
- 4.2 Absolute Revenue Growth Opportunity
- 4.2.1 By Region – Absolute USD Growth Through 2032
- 4.3 Incremental Volume Opportunity
- 4.3.1 By Region – Incremental Volume Through 2032
- 4.3.2 Segment – Incremental Volume
- 4.4 Emerging Submarket Opportunity Deep Dive (Subject to Applicability)
- 4.5 Emerging Market Opportunity Scorecards
- 4.5.1 United States
- 4.5.2 Europe
- 4.5.3 Asia
- 4.5.4 Middle East & Africa
Note: Emerging Market Opportunity Scorecards will be included based on relevance and strategic importance. Regions listed are indicative and may vary depending on data availability and market dynamics.
Chapter 5. PFAS Free Food Packaging Import-Export Analysis & Trade Flows
- 5.1 Global Trade Overview
- 5.1.1 Global Export Value by Country (2024)
- 5.1.2 Global Export Volume by Country (2024)
- 5.1.3 Global Import Value by Country (2024)
- 5.1.4 Global Import Volume by Country (2024)
- 5.1.5 Net Trade Balance by Country (2024)
- 5.2 Export Analysis – Segment
- 5.2.1 Type 1 (HS Code)
- 5.2.2 Type 2 (HS Code)
- 5.2.3 Type 3 (HS Code)
- 5.2.4 Type 4 (HS Code)
- 5.2.5 Type 5 (HS Code)
- 5.3 Import Analysis – Segment
- 5.3.1 Type 1 (HS Code)
- 5.3.2 Type 2 (HS Code)
- 5.3.3 Type 3 (HS Code)
- 5.3.4 Type 4 (HS Code)
- 5.3.5 Type 5 (HS Code)
- 5.4 Average Unit Trade Prices
- 5.4.1 Average Export Price – Segment & Country
- 5.4.2 Average Import Price – Segment & Source Country
- 5.4.3 Price Trends (2024)
- 5.5 Key Trade Route Analysis
- 5.5.1 Trade Route 1
- 5.5.2 Trade Route 2
- 5.5.3 Trade Route 3
- 5.5.4 Trade Route 4
- 5.5.5 Trade Route 5
- 5.6 Trade Policy Impact Assessment
- 5.6.1 US Anti-Dumping & Section 301 Tariffs
- 5.6.2 EU Customs Union Impact
- 5.6.3 Major Free Trade Agreements
- 5.6.4 USMCA Rules of Origin
Note: Trade policy analysis will be included only where relevant to the PFAS Free Food Packaging market.
Chapter 6. Competitive Landscape & Company Benchmarking
- 6.1 PFAS Free Food Packaging Market Concentration & Structure
- 6.1.1 Herfindahl-Hirschman Index (HHI) – vs. 2024
- 6.1.2 Tier 1, Tier 2 & Tier 3 Market Structure
- 6.1.3 Global, Regional & Local Player Dynamics
- 6.2 PFAS Free Food Packaging Market Share Analysis – 2024
- 6.2.1 Global Revenue Share by Company
- 6.2.2 Global Volume Share by Company
- 6.2.3 Regional Revenue Share
- 6.2.4 Market Share Evolution ( vs. 2024)
- 6.2.5 OEM Segment Share by Company
- 6.2.6 Replacement Segment Share by Company
- 6.3 Production/Delivery Capacity & Facility Analysis
- 6.3.1 Global Installed Capacity
- 6.3.2 Capacity Utilization Rates
- 6.3.3 Production/Output Volume
- 6.3.4 Facility Locations & Capacity Map
- 6.3.5 Planned Capacity Additions
- 6.4 PFAS Free Food Packaging Competitive Benchmarking Matrix
- 6.4.1 Revenue, Volume, CAGR & Profitability Comparison
- 6.4.2 Channel Revenue Mix
- 6.4.3 Geographic Revenue Exposure
- 6.4.4 R&D Intensity
- 6.4.5 Sustainability Maturity
- 6.5 Strategic Developments in PFAS Free Food Packaging (Last 24 Months)
- 6.5.1 Mergers, Acquisitions & Divestments
- 6.5.2 New PFAS Free Food Packaging Launches
- 6.5.3 Facility Expansions
- 6.5.4 Strategic Alliances, Joint Ventures & Partnerships
- 6.5.5 Distribution Expansion & Market Entry
- 6.5.6 Sustainability & ESG Initiatives
- 6.6 Competitive Strategy Mapping
- 6.6.1 Leader, Challenger, Follower & Niche Classification
- 6.6.2 Pricing Strategy Comparison
- 6.6.3 Channel Strategy Matrix
Note: Strategic developments are included based on their materiality and the availability of reliable information.
Chapter 7. Global PFAS Free Food Packaging Market – By Distribution Channel
- 7.1 Segment Overview
- 7.1.1 Volume & Revenue Split by Channel (2024 & 2032)
- 7.1.2 Channel Mix Evolution (2024-2032)
Chapter 8. Regional Market Analysis – Global Overview
- 8.1 Global Regional Overview
- 8.1.1 Regional Volume Share
- 8.1.2 Regional Revenue Share
- 8.1.3 Regional Volume by Region
- 8.1.4 Regional Revenue by Region
- 8.1.5 Regional Forecast Through 2032
- 8.2 Cross-Regional Segment Analysis
- 8.2.1 By Distribution Channel
- 8.2.2 By Brand/Price Tier
Chapter 9. North America PFAS Free Food Packaging Market
- 9.1 United States
- 9.2 Canada
- 9.3 Mexico
Chapter 10. Europe PFAS Free Food Packaging Market
- 10.1 Germany
- 10.2 France
- 10.3 Italy
- 10.4 United Kingdom
- 10.5 Spain
- 10.6 Poland
- 10.7 Russia
- 10.8 Netherlands
- 10.9 Belgium
- 10.10 Sweden
- 10.11 Denmark
- 10.12 Norway
- 10.13 Rest of Europe
Chapter 11. Asia Pacific PFAS Free Food Packaging Market
- 11.1 China
- 11.2 India
- 11.3 Japan
- 11.4 South Korea
- 11.5 Thailand
- 11.6 Indonesia
- 11.7 Vietnam
- 11.8 Malaysia
- 11.9 Australia
- 11.10 Rest of Asia Pacific
Chapter 12. Latin America PFAS Free Food Packaging Market
- 12.1 Brazil
- 12.2 Argentina
- 12.3 Colombia
- 12.4 Chile
- 12.5 Rest of Latin America
Chapter 13. Middle East PFAS Free Food Packaging Market
- 13.1 Saudi Arabia
- 13.2 United Arab Emirates
- 13.3 Turkey
- 13.4 Israel
- 13.5 Iran
- 13.6 Rest of the Middle East
Chapter 14. Africa PFAS Free Food Packaging Market
- 14.1 South Africa
- 14.2 Egypt
- 14.3 Nigeria
- 14.4 Morocco
- 14.5 Rest of Africa
Chapter 15. PFAS Free Food Packaging Company Profiles
- 15.1 [Company 01]
- 15.1.1 Company Overview
- 15.1.2 Key Management Personnel
- 15.1.3 Products & Services Portfolio
- 15.1.4 Financial Performance
- 15.1.5 Key Market Focus & Geographic Presence
- 15.1.6 Recent Developments & Strategic Initiatives
Note: The company profile list is preliminary and may change based on research findings, market developments, data availability, and client requirements.
Chapter 16. Appendices
- Appendix A – List of Abbreviations & Acronyms
- Appendix B – Industry Classification Code Reference – Full Series
- Appendix C – Production & Capacity Data Tables
- Appendix D – End-Use & Demand Base Tables
- Appendix E – Consumption & Replacement Rate Assumptions
- Appendix F – ASP Reference Tables
- Appendix G – Manufacturing & Facility Database
- Appendix H – Import-Export Data Tables
- Appendix I – Regulatory Summary Tables
- Appendix J – Primary Research Participant List (Anonymized)
- Appendix K – Primary Research Questionnaire Framework
- Appendix L – Data Sources & Bibliography
- Appendix M – Market Size Divergence & Source Comparison
Chapter 17. Research Methodology
- 17.1 Research Framework & Philosophy
- 17.2 Secondary Research – Sources, Hierarchy & Data Extraction
- 17.3 Data Modeling – Bottom-Up & Top-Down Market Sizing
- 17.4 Primary Research – Stakeholder Framework, LOI & Sample Sizes
- 17.5 Forecast Methodology – Regression, Scenario & Sensitivity Analysis
- 17.6 Quality Control – Four-Layer Validation Framework
- 17.7 Limitations & Standard Assumptions
- 17.8 Disclaimer
