
Quick answer
An aluminium cans manufacturing plant is built around a two-piece beverage line; a single line producing about 1.0 billion cans a year, near 2,400 cans per minute, needs an estimated USD 90–140 million of CapEx. Aluminium coil makes up roughly three quarters of operating cost and is passed through to buyers, leaving a gross margin of 14–24%. Payback is about 8–12 years at mid-range CapEx, so anchor contracts with brewers or bottlers are essential.
Viable where regional can supply is short, but only for a well-funded entrant that secures coil supply and multiyear offtake contracts before ordering the line.
Aluminium Cans plant: key highlights
| Parameter | Indicative value | Note |
|---|---|---|
| Plant capacity | About 1.0 billion cans per year | Single two-piece line, near 2,400 cans per minute, 330 ml equivalent |
| Total CapEx | USD 90–140 million | Greenfield, emerging-market cost region; U.S. and EU sites at or above the top |
| Raw material share of operating cost | 78–85% | Body and end coil about 77%, coatings and inks the rest |
| Gross margin | 14–24% | Price minus metal, coatings and direct conversion |
| Payback period | 8–12 years | At 85% utilization and mid-range CapEx; longer if conversion fees weaken |
| IRR | Available in report | Post-tax, 10-year model |
| Break-even | Available in report | Capacity utilization basis |
Ranges assume a greenfield single two-piece line of about 1.0 billion 330 ml cans a year with an end module, an emerging-market industrial park (U.S./EU costs higher), 2026 prices, 85% utilization from year three, coil at USD 3,850–4,300 per metric ton, a can price of USD 0.075–0.085 and Indian figures converted at 88 rupees per USD; CapEx scaled from disclosed Brazil and India plants. Customizable to any country.
What is an aluminium cans manufacturing plant?
Aluminium cans in this report are seamless two-piece beverage containers: a drawn-and-ironed body with an integral dome, closed after filling by a separately made easy-open end. They hold beer, carbonated soft drinks, energy drinks, sparkling water and ready-to-drink coffee. The body is formed from 3104-alloy can body stock, while the end uses stiffer 5182 alloy, so a finished 330 ml can with its end weighs roughly 10–13 grams.
Standard formats are the 330 ml and 355 ml (12 oz) cans, 250 ml and 300 ml sleek cans for energy drinks and mixers, and 440 ml to 500 ml cans used widely for beer in Europe and Asia. An internal lacquer, increasingly bisphenol-A-free, separates the drink from the metal, and buyers write coating chemistry, print quality and dome reversal pressure into supply contracts. Under the international Harmonized System, aluminium cans fall under subheading 7612.90, which also covers other aluminium containers of 300 liters or less, so trade data for the code include aerosol and food cans as well. Cans ship on pallets straight to filling lines, so a can maker's customer list is short and concentrated.
Aluminium cans market overview and global demand
The global aluminum cans market stands at about USD 53.4 billion in 2025, based on Credence Research's estimate of USD 51.3 billion in 2024 and a 4.1% CAGR through 2032. In unit terms, a Ball Corporation executive cited industry projections of up to 470 billion beverage cans a year by 2026 in a December 2025 interview with trade publication AL Circle, and every new line worldwide is built for the two-piece can segment.
Demand is driven by beer and soft drink brands shifting from glass and plastic toward infinitely recyclable metal, by energy drinks and canned cocktails, and by retailer and regulatory pressure on single-use plastic. North America and Europe are the largest mature markets; Brazil, Mexico, Southeast Asia and India are the fastest-growing, and India showed how tight supply can get when domestic capacity fell more than 20% short of demand in early 2026.
Because empty cans are bulky, most are made within a few hundred kilometers of the filler, so cross-border trade is modest relative to output and concentrated in Europe. UN Comtrade data for HS 761290 show 2024 exports of about USD 813 million from Germany, USD 784 million from the United States, USD 449 million from the Netherlands, USD 376 million from China and USD 221 million from Poland.
Buyers are global brewers, the Coca-Cola and PepsiCo bottling systems and energy drink brands, which sign multiyear volume contracts with metal-price pass-through. New capacity announced for 2027–2029 in India, Brazil and Eastern Europe will narrow today's regional shortages, so a late entrant should plan on contracted conversion fees rather than shortage pricing.
Aluminium cans manufacturing process for a two-piece line
A two-piece beverage line converts coil into finished, inspected cans in about 20 minutes of continuous flow, and every station is synchronized to the bodymakers' stroke rate. The sequence below describes a single drawn-and-wall-ironed (DWI) line with an attached end-making module.
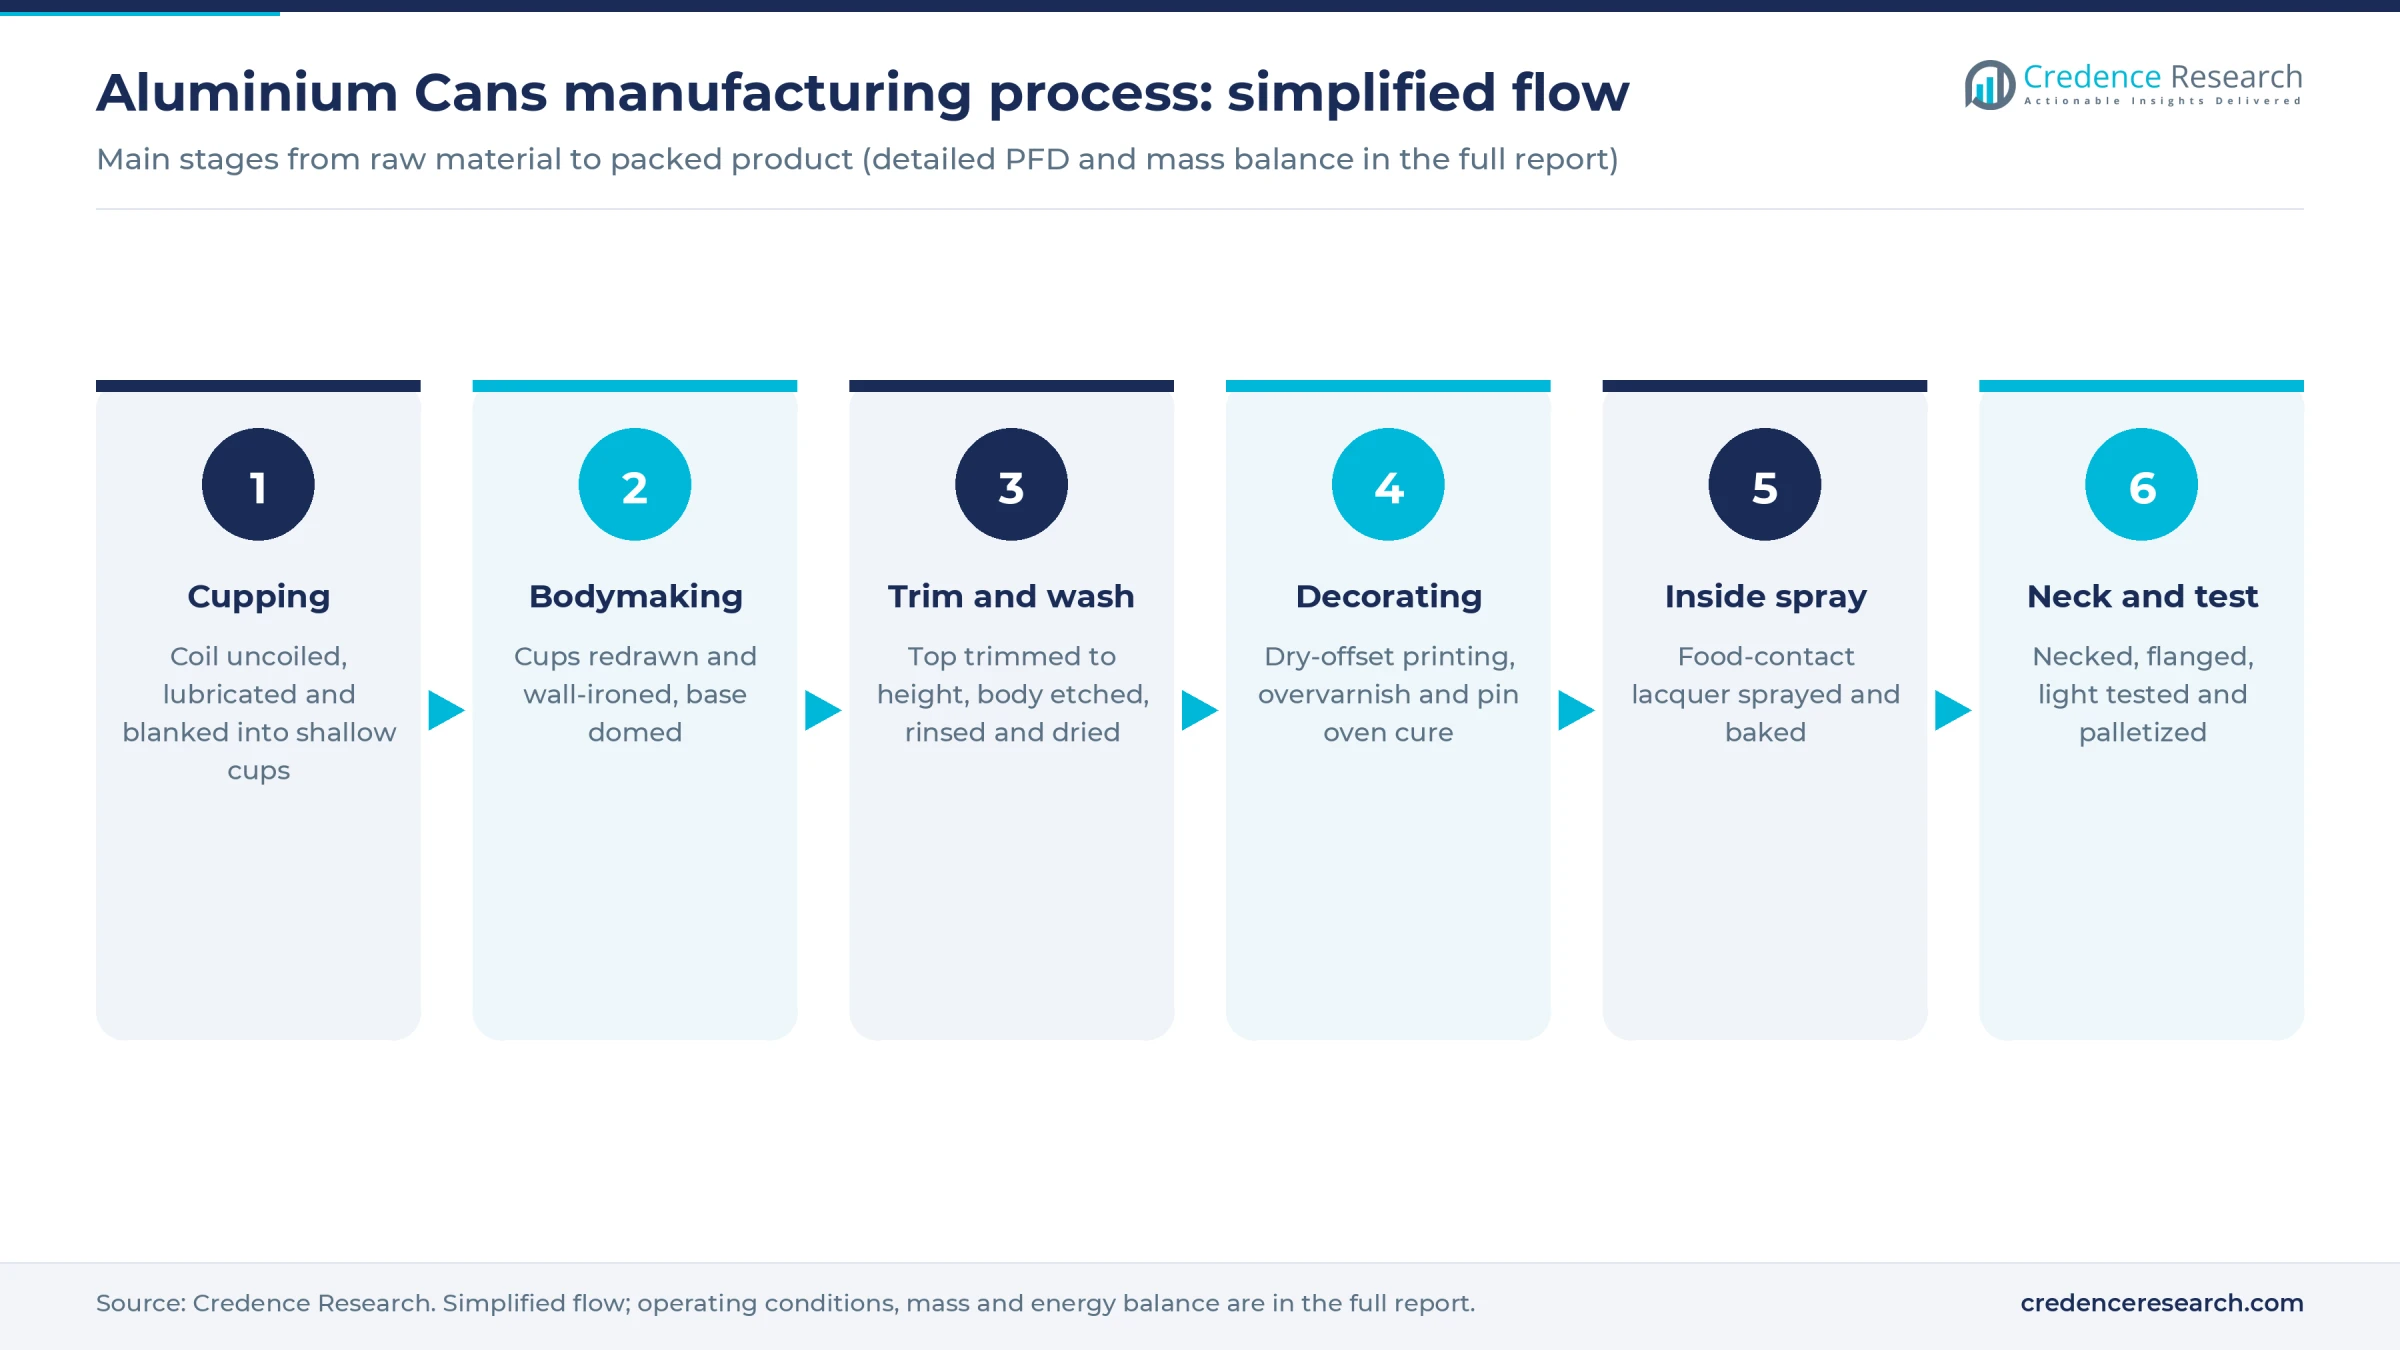
- Uncoiling and cupping. A coil of can body stock weighing several metric tons is unwound, lightly lubricated and fed into a multi-die cupping press that blanks and draws shallow cups in a single stroke. The skeleton scrap left between blanks goes straight back to the coil supplier.
- Bodymaking. Each cup is redrawn and pushed through a stack of ironing rings that thin the wall to well under a tenth of a millimeter while forming the dome at the base. Several bodymakers run in parallel to feed one line.
- Trimming and washing. Trimmers cut the ragged top edge to height, and a multistage washer etches, rinses and treats the surface before a drying oven removes moisture so coatings will adhere.
- Decorating. A dry-offset decorator prints up to eight colors in one pass and applies an overvarnish, followed by a pin oven that cures the ink while cans travel on pins.
- Inside spray and curing. Spray guns coat the interior with food-contact lacquer, and an internal bake oven cures it. Coating weight and coverage are the main quality checks for flavor protection and corrosion.
- Necking, flanging and testing. A multistage necker reduces the top diameter to match the end size and forms the flange. Light testers and vision cameras reject pinholes and print defects before cans are palletized with tier sheets.
In parallel, an end line feeds 5182 end stock through a shell press, then a conversion press that forms the rivet and attaches the tab, before a lining compound is applied to the curl. Because almost all metal scrap is recycled, line speed, uptime and print changeover time decide unit cost more than any single machine does.
Aluminium cans plant setup cost
The reference plant in this report is a greenfield single-line unit producing about 1.0 billion 330 ml can-equivalents a year, with a matching end module. That output needs a line rated near 2,400 cans per minute running about 6,900–7,000 effective hours a year, roughly 80% of calendar time. At this scale, total CapEx is estimated at USD 90–140 million, including land, buildings, utilities, environmental controls, preoperative costs and working capital margin.
The range is scaled from disclosed capex of recent plants, because a sub-scale beverage can line does not exist commercially. Canpack's greenfield plant at Poços de Caldas, Brazil cost about USD 140 million for roughly 1.3 billion cans a year in 2022, while 2026 Indian projects by Crown and AGI Greenpac budget about USD 70–130 million per billion cans of capacity. U.S. and Western European sites usually land at or above the top of the range because construction and installation labor cost more.
For the land row, the plant needs about 30 acres for the building, coil and pallet storage and truck movement. At USD 43–57 per square meter, the premiums one Indian state industrial authority advertised in October 2026, land costs about USD 5–7 million, close to 5% of CapEx; for U.S. and European parks the model uses an assumed USD 3–10 million because prices vary widely by site.
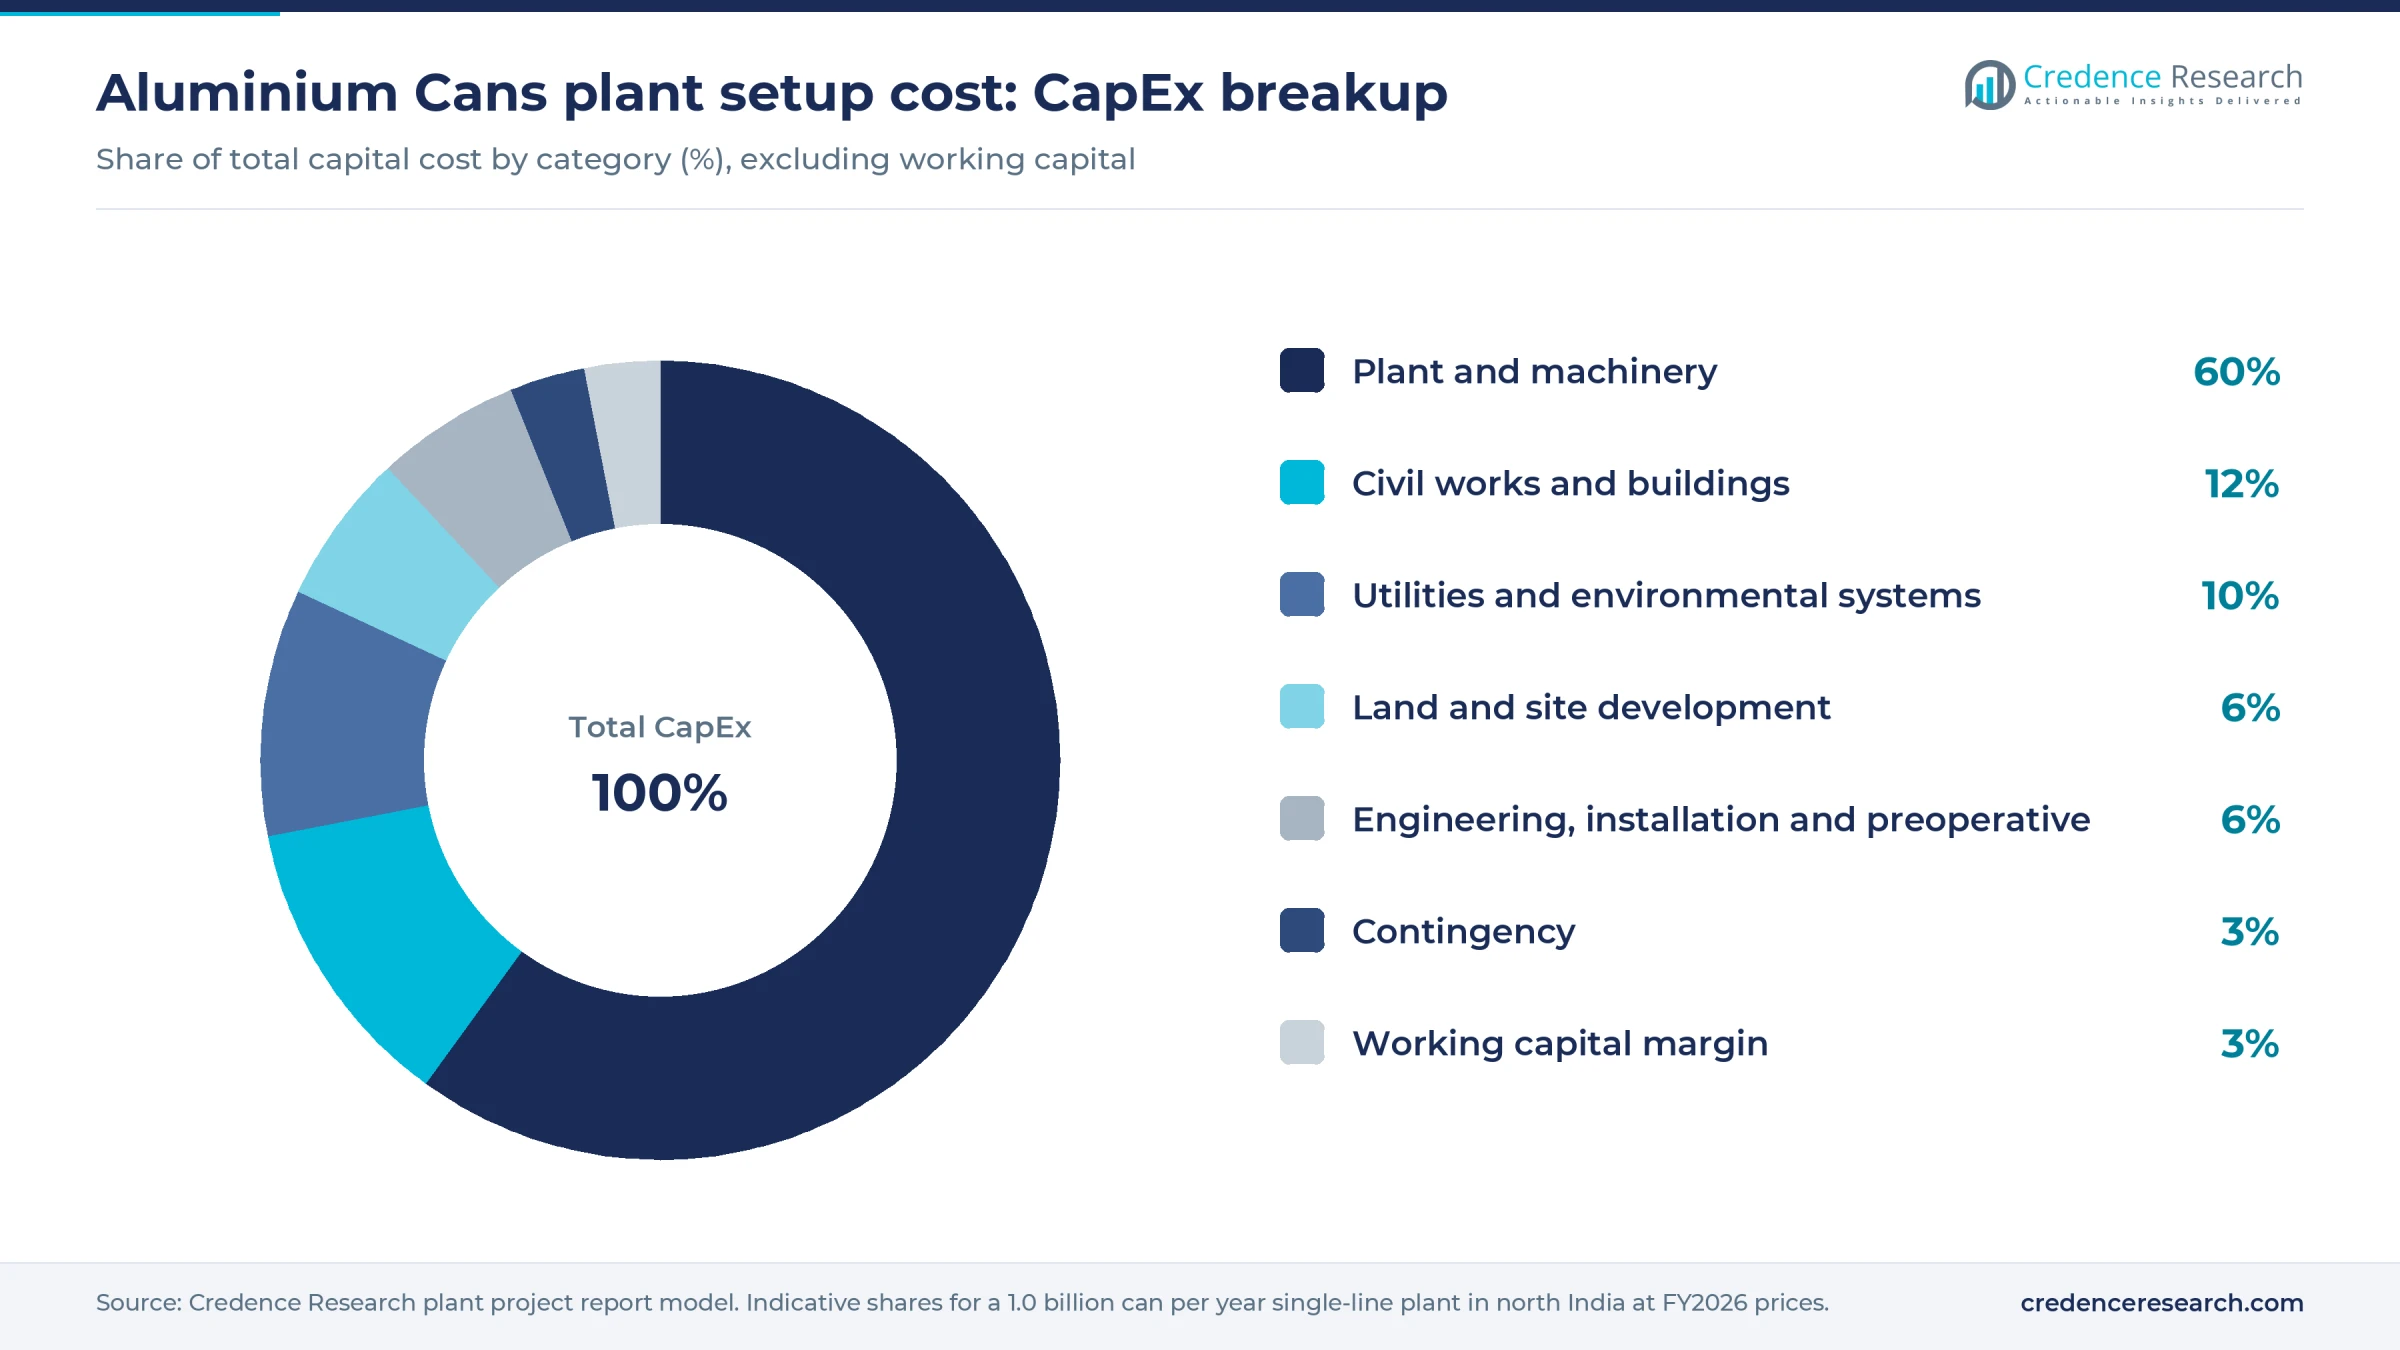
Plant and machinery dominate CapEx at about 61%, and most of it comes from a handful of specialist builders, so currency moves at the order stage can shift the total. Operating cost is a different story: aluminium coil for bodies and ends makes up close to 77% of running cost, and coatings bring the raw material share to about 80%.
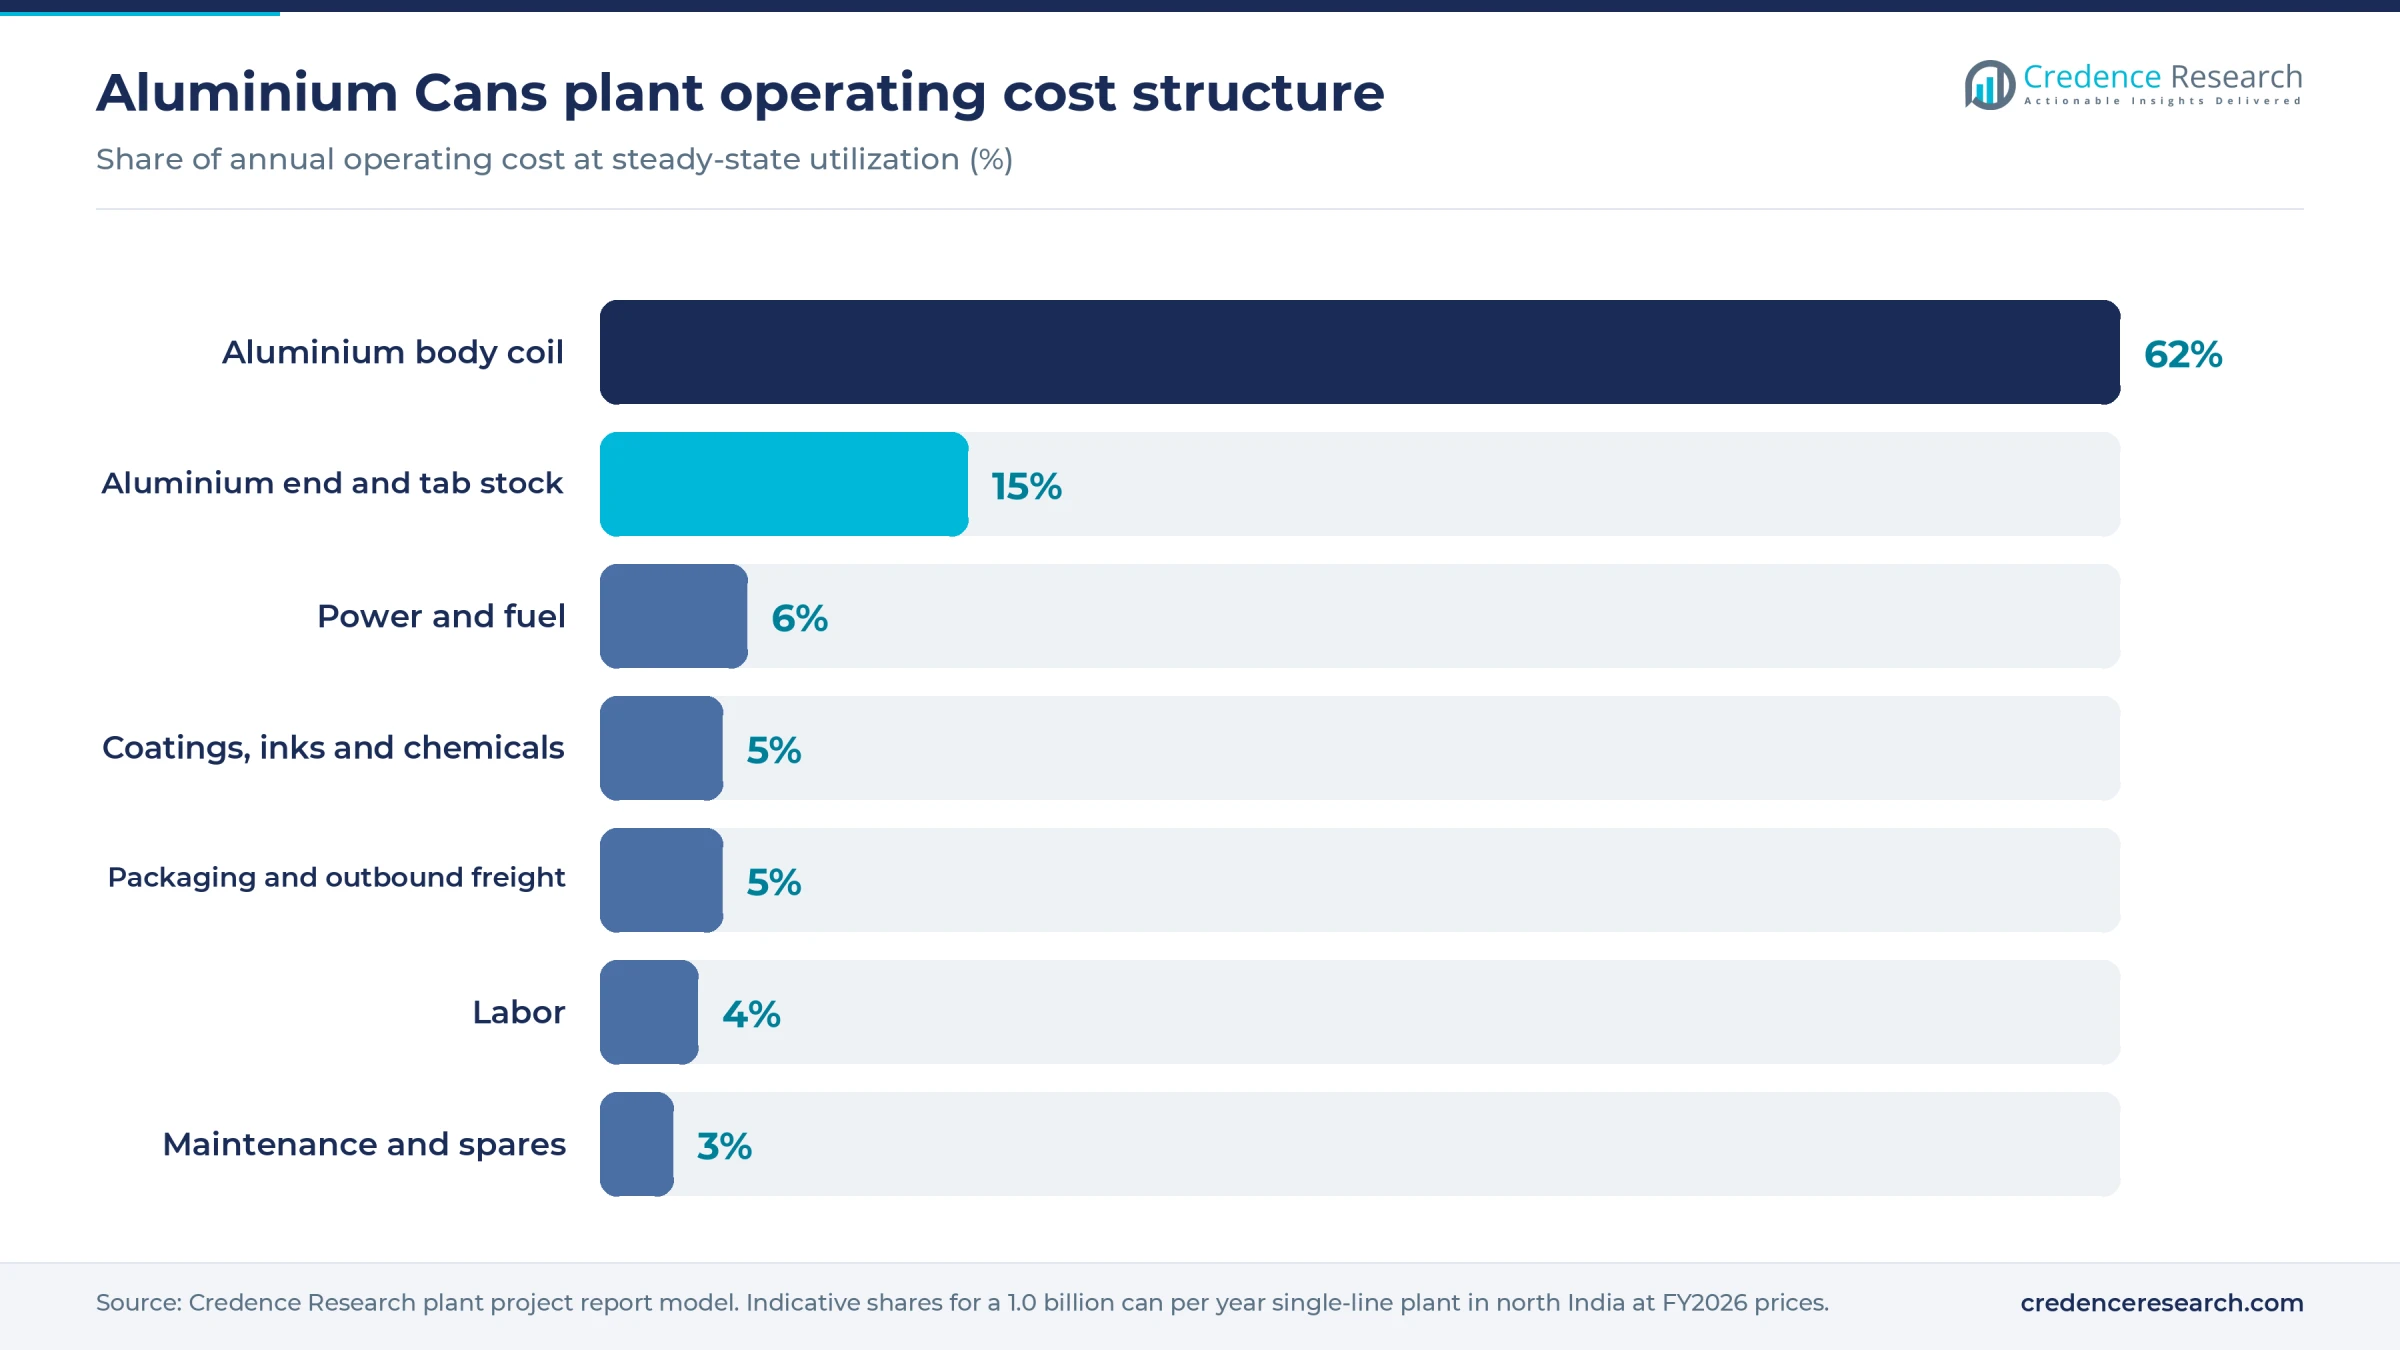
Because coil is priced off the London Metal Exchange plus a regional premium and a rolling charge, can makers pass metal through to customers under formula contracts. The margin they keep comes from conversion efficiency, spoilage and the conversion fee negotiated per thousand cans.
Machinery and raw materials for an aluminium cans plant
The main equipment groups are listed below; line speeds, makes and the full equipment schedule are in the report.
- Coil handling: uncoiler, lubricator and multi-die cupping press
- Bodymakers with ironing tool packs, plus trimmers
- Can washer with chemical dosing and a drying oven
- Decorator with plate-making setup, pin oven and optional base coater
- Inside spray machines and internal bake oven
- Necker-flanger, light tester, vision inspection and palletizer
- End module: shell press, conversion press, compound liner and bagger
- Utilities: air compressors, chillers, regenerative thermal oxidizer for oven solvents, effluent treatment plant and scrap baling
Can body stock is made by a small group of flat-rolling mills in the United States, Germany, China, Japan, South Korea, Brazil, the Gulf states and India, and end and tab stock comes from an even narrower set of mills. China and the Gulf have become the swing exporters to regions short of coil, as India's 2026 import surge showed. Lacquers, inks and washer chemicals come from global coatings and chemical suppliers with regional blending sites.
Coil security is the single biggest operating risk. A line consuming roughly 12,000 metric tons of aluminium a year cannot run on spot purchases, so new entrants typically sign annual or multiyear coil agreements before ordering machinery, and the scrap generated in cupping and trimming returns to the same mills.
Aluminium cans business profit margin and ROI
Gross margin for the reference plant is estimated at 14–24%, measured as selling price minus aluminium, coatings and direct conversion cost. The build assumes a delivered price of USD 0.075–0.085 per 330 ml can with end, consistent with 2024 export unit values of USD 6–9 per kg for leading exporters, adjusted for higher 2026 metal prices. Against that, metal and coatings cost about USD 0.050–0.053 per can at coil prices of USD 3,850–4,300 per metric ton, and power, labor, maintenance, packaging and freight add about USD 0.010–0.013.
At 85% utilization, about 850 million cans, annual cash profit after overheads comes to roughly USD 10–14 million at mid-range CapEx, which puts payback at about 8–12 years; a weaker conversion fee or higher-cost build pushes it past 13 years. That is why can makers add lines only against anchor customers on long-term contracts.
Sensitivity runs mostly through the conversion fee and uptime, not metal. A USD 100 per metric ton move in coil premium shifts metal cost by only about USD 0.0012 per can and is usually passed through, but a 5-point loss in line efficiency removes about 50 million cans of annual output and a large share of profit.
| Metric | Value |
|---|---|
| Gross margin | 14–24% |
| Payback period | 8–12 years |
| IRR (post-tax) | Available in report |
| NPV | Available in report |
| Return on investment | Available in report |
| DSCR | Available in report |
| Break-even utilization | Available in report |
How to start an aluminium cans business with licenses and approvals
Approval steps are similar in most countries: company and tax registration, industrial land use and building permits, an air and water permit for the solvent-based coating ovens and the acid washer, occupational safety and fire approvals, food-contact compliance for interior coatings, and import registration for coil and machinery. Coating emissions drive the environmental permit, so a thermal oxidizer is designed in from the start.
| Market | Key approvals for a can plant |
|---|---|
| United States | State air permit meeting EPA rules for beverage can surface coating (40 CFR 60 Subpart WW) and metal can coating (40 CFR 63 Subpart KKKK); interior coatings must comply with FDA food-contact rules such as 21 CFR 175.300 |
| European Union | National permit under the Industrial Emissions Directive for solvent-using coating; food-contact compliance with Regulation (EC) 1935/2004 and the bisphenol A ban in Regulation (EU) 2024/3190 |
| India | BIS license to IS 14407:2023 under the 2026 Quality Control Order, compulsory from April 1, 2027, for large units; consent to establish and operate from the state pollution control board |
Filler customers also audit can makers against food safety packaging standards before approving a new plant.
Key aluminium cans manufacturers and recent developments
Global supply is led by Ball, Crown, Ardagh Metal Packaging and Canpack, which run plants across the Americas, Europe and Asia. Regional leaders include Toyo Seikan in Japan, ORG Technology and Baosteel Packaging in China, and Ball and Canpack in India, while rolling mills such as Novelis and Hindalco supply the coil.
- April 2026: Crown announced its first Indian beverage can plant, a two-line facility sized at about 2.2 billion cans a year and due in the second half of 2027.
- July 2026: Canpack approved a USD 100 million second line at its Indian greenfield plant, adding 1.2 billion cans for late 2027 or early 2028.
- July 2026: The main transition period of the EU ban on bisphenol A in food-contact materials ended on July 20, ending first placement on the EU market of BPA-coated beverage cans, with longer transitions for some fruit, vegetable and fish cans to January 2028.
Leaders compete on coil contracts, line uptime and proximity to filling plants, and demand for beverage can ends scales one for one with these body lines.
What's inside the Aluminium Cans project report PDF
The report runs to 21 chapters. Open a chapter to see its sections.
1. Preface
2. Scope and Methodology
- 2.1 Objectives of the Study
- 2.2 Stakeholders
- 2.3 Research Methodology
- 2.4 Data Sources and Key Assumptions
3. Executive Summary
- 3.1 Market Snapshot
- 3.2 Project at a Glance (Capacity, CapEx, OpEx)
- 3.3 Key Financial Indicators (IRR, NPV, Payback, Break-even)
- 3.4 Feasibility Verdict
4. Product Overview
- 4.1 Aluminium Cans Definition and Properties
- 4.2 Grades and Specifications (BIS / ISO / ASTM)
- 4.3 HS Code and Classification
- 4.4 Key Applications
- 4.5 Substitutes
5. Global Aluminium Cans Market
- 5.1 Market Overview
- 5.2 Historical and Current Market Performance (Volume and Value)
- 5.3 Market Breakup by Grade / Type
- 5.4 Market Breakup by End-Use Industry
- 5.5 Market Breakup by Region
- 5.6 Market Drivers, Restraints and Trends
- 5.7 Value Chain Analysis
- 5.8 Market Forecast
6. Target Country Aluminium Cans Market Analysis
- 6.1 Demand and Supply Analysis
- 6.2 Installed Capacity vs Demand Gap
- 6.3 Import Dependence
- 6.4 Demand Forecast by End-Use
7. Trade Analysis
- 7.1 Imports by Volume, Value and Country
- 7.2 Exports by Volume, Value and Country
- 7.3 Trade Balance and Opportunities
8. Price Analysis
- 8.1 Historical Aluminium Cans Price Trends by Region
- 8.2 Raw Material / Feedstock Price Trends and Linkage
- 8.3 Price Forecast
- 8.4 Margins Across the Value Chain
9. Competitive Landscape
- 9.1 Market Structure
- 9.2 Key Players and Installed Capacities
- 9.3 Profiles of Key Players
- 9.4 Recent Developments (Expansions, M&A, New Plants)
10. Manufacturing Process and Technology
- 10.1 Comparison of Technology Routes
- 10.2 Selected Route and Process Flow Diagram
- 10.3 Unit Operations Involved
- 10.4 Chemical Reactions Involved
- 10.5 Mass Balance and Raw Material Requirements
- 10.6 Energy Balance
- 10.7 Quality Assurance Criteria and Technical Tests
- 10.8 By-products and Waste Handling
- 10.9 Technology Licensors / Providers
11. Project Details, Requirements and Costs
- 11.1 Land, Location and Site Development
- 11.1.1 Site Selection Criteria
- 11.1.2 Location Analysis
- 11.1.3 Land Requirement and Costs
- 11.1.4 Site Development Costs
- 11.2 Plant Layout
- 11.2.1 Layout Principles
- 11.2.2 Proposed Layout
- 11.2.3 Factors Influencing Layout
- 11.3 Civil Works and Buildings
- 11.4 Plant Machinery
- 11.4.1 Machinery Requirements and Specifications
- 11.4.2 Machinery Costs
- 11.4.3 Machinery Suppliers
- 11.5 Raw Materials
- 11.5.1 Requirements per Tonne of Output
- 11.5.2 Procurement and Sourcing
- 11.5.3 Costs
- 11.5.4 Suppliers
- 11.6 Packaging
- 11.6.1 Packaging Requirements
- 11.6.2 Packaging Costs
- 11.6.3 Packaging Suppliers
- 11.7 Storage and Material Handling
- 11.8 Transportation Requirements and Costs
- 11.9 Utilities
- 11.9.1 Power Requirements and Costs
- 11.9.2 Water Requirements and Costs
- 11.9.3 Steam, Fuel and Other Utilities
- 11.10 Manpower Requirements and Wages
12. Environment, Health, Safety and Sustainability
- 12.1 Effluent and Emissions Management
- 12.2 Hazard Classification and Safety Measures
- 12.3 Carbon Footprint
- 12.4 Green / Low-Carbon Process Options
13. Regulatory Procedures, Approvals and Certifications
- 13.1 Licences and Registrations
- 13.2 Environmental Clearances
- 13.3 Product Certifications (BIS, REACH, etc.)
- 13.4 Approval Timeline
14. Project Implementation Schedule
15. Project Economics
- 15.1 Capital Cost of the Project
- 15.2 Techno-Economic Parameters
- 15.3 Capacity Utilization and Ramp-up
- 15.4 Product Pricing and Margins
- 15.5 Income Projections
- 15.6 Expenditure Projections
- 15.7 Working Capital Requirement
- 15.8 Taxation
- 15.9 Depreciation
16. Financial Analysis
- 16.1 Projected Profit and Loss Account
- 16.2 Projected Cash Flow Statement
- 16.3 Projected Balance Sheet
- 16.4 Liquidity Analysis
- 16.5 Profitability Analysis (Payback, NPV, IRR, ROI)
- 16.6 Break-even Analysis
- 16.7 Debt Service Coverage Ratio (DSCR)
- 16.8 Sensitivity Analysis
- 16.9 Scenario and Uncertainty Analysis
17. Funding and Incentives
- 17.1 Means of Finance and Debt-Equity Structure
- 17.2 Loans and Financial Assistance
- 17.3 Government Schemes and Subsidies (PLI, State Policies)
18. Risk Assessment
- 18.1 Key Success Factors
- 18.2 Key Risk Factors
- 18.3 Risk Mitigation
19. Strategic Recommendations
20. Case Study of a Successful Venture
21. Appendix
- 21.1 Detailed Assumptions
- 21.2 Abbreviations
- 21.3 List of Tables and Figures
- 21.4 Sources
This page vs. the full report
| Data point | On this page (free) | In the full report |
|---|---|---|
| Total CapEx | One rounded range at one capacity | Exact figure at three capacities with a line-item breakup |
| CapEx breakup | Category shares (%) only | Cost, quantity and supplier for every machine |
| Operating cost | Share of raw materials, utilities and labor | Per-unit cost sheet with each input price and consumption |
| Profitability | Gross margin range and payback band | Exact IRR, NPV, ROI, break-even and DSCR |
| Financial statements | List of what is included | 10-year P&L, cash flow, balance sheet and Excel model |
| Sensitivity | One directional line | Full sensitivity and scenario tables |
| Process | Simplified flow diagram | Detailed process flow, mass and energy balance, operating conditions |
| Machinery | Names of the main machines | Specifications, capacity, cost and supplier list |
| Market | Headline size, growth and India demand trend | Segment, region, trade and price forecast tables |
| Suppliers and buyers | Supplier types and sourcing hubs | Named suppliers and buyers |
Aluminium Cans project report: FAQs
How much does it cost to set up an aluminium cans manufacturing plant?
What capacity is realistic for a new beverage can line?
What is the profit margin in aluminium can manufacturing?
Which approvals does an aluminium can plant need?
Where do can makers source aluminium coil?
What is the payback period for an aluminium can plant?
Who buys aluminium beverage cans?

About the analyst
Rajdeep Kumar Deb, Lead Analyst - Consumer & Finance
Rajdeep brings a decade of consumer goods and financial services insight to strategic market analysis.
Related market research
- Beverage Aluminum Cans Market Size, Growth and Forecast 2032
- Beer Cans Market Size, Growth, Share and Forecast 2032
- Metal Packaging Market Size, Share and Growth Report 2032
- Aluminum Market Size, Trend, Share, Growth & Forecast 2032
- Aluminum UBC Scrap Recycling Market Size, Share and Forecast 2032
- Glass and Aluminum Containers Packaging Market Size, Share and Forecast 2032
More plant project reports
- Ceiling Fan Manufacturing Plant Project Report (DPR) 2026
- Avocado Oil Processing Plant Project Report (DPR) 2026
- Aloe Vera Gel Manufacturing Plant Project Report (DPR) 2026
- Potato Processing Plant Prefeasibility Report 2026
- Corn Starch Manufacturing Plant Project Report (DPR) 2026
- Copper Sulphate Manufacturing Plant Project Report (DPR) 2026