CHAPTER NO. 1 : GENESIS OF THE MARKET
1.1 Market Prelude – Introduction & Scope
1.2 The Big Picture – Objectives & Vision
1.3 Strategic Edge – Unique Value Proposition
1.4 Stakeholder Compass – Key Beneficiaries
CHAPTER NO. 2 : EXECUTIVE LENS
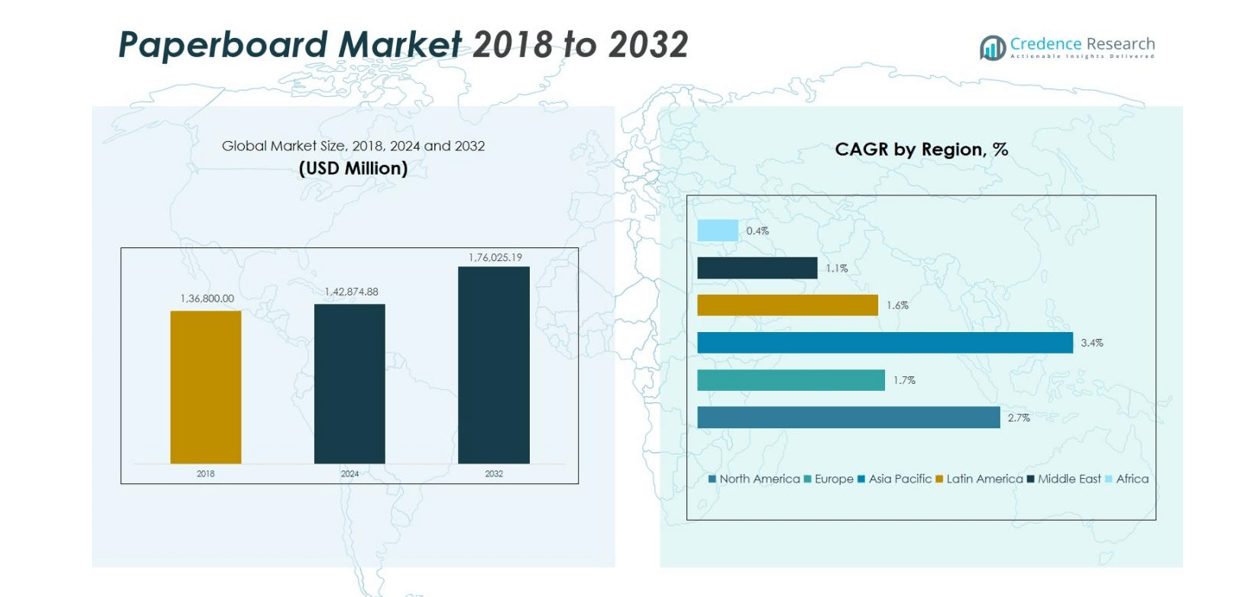
2.1 Pulse of the Industry – Market Snapshot
2.2 Growth Arc – Revenue Projections (USD Million)
2.3. Premium Insights – Based on Primary Interviews
CHAPTER NO. 3 : PAPERBOARD MARKET FORCES & INDUSTRY PULSE
3.1 Foundations of Change – Market Overview
3.2 Catalysts of Expansion – Key Market Drivers
3.2.1 Momentum Boosters – Growth Triggers
3.2.2 Innovation Fuel – Disruptive Technologies
3.3 Headwinds & Crosswinds – Market Restraints
3.3.1 Regulatory Tides – Compliance Challenges
3.3.2 Economic Frictions – Inflationary Pressures
3.4 Untapped Horizons – Growth Potential & Opportunities
3.5 Strategic Navigation – Industry Frameworks
3.5.1 Market Equilibrium – Porter’s Five Forces
3.5.2 Ecosystem Dynamics – Value Chain Analysis
3.5.3 Macro Forces – PESTEL Breakdown
3.6 Price Trend Analysis
3.6.1 Regional Price Trend
3.6.2 Price Trend by product
CHAPTER NO. 4 : KEY INVESTMENT EPICENTER
4.1 Regional Goldmines – High-Growth Geographies
4.2 Type Frontiers – Lucrative Type Categories
4.3 ApplicationSweet Spots – Emerging Demand Segments
CHAPTER NO. 5: REVENUE TRAJECTORY & WEALTH MAPPING
5.1 Momentum Metrics – Forecast & Growth Curves
5.2 Regional Revenue Footprint – Market Share Insights
5.3 Segmental Wealth Flow – Type & ApplicationRevenue
CHAPTER NO. 6 : TRADE & COMMERCE ANALYSIS
6.1. Import Analysis by Region
6.1.1. Global Paperboard Market Import Revenue By Region
6.2. Export Analysis by Region
6.2.1. Global Paperboard Market Export Revenue By Region
CHAPTER NO. 7 : COMPETITION ANALYSIS
7.1. Company Market Share Analysis
7.1.1. Global Paperboard Market: Company Market Share
7.2. Global Paperboard Market Company Revenue Market Share
7.3. Strategic Developments
7.3.1. Acquisitions & Mergers
7.3.2. New Type Launch
7.3.3. Regional Expansion
7.4. Competitive Dashboard
7.5. Company Assessment Metrics, 2024
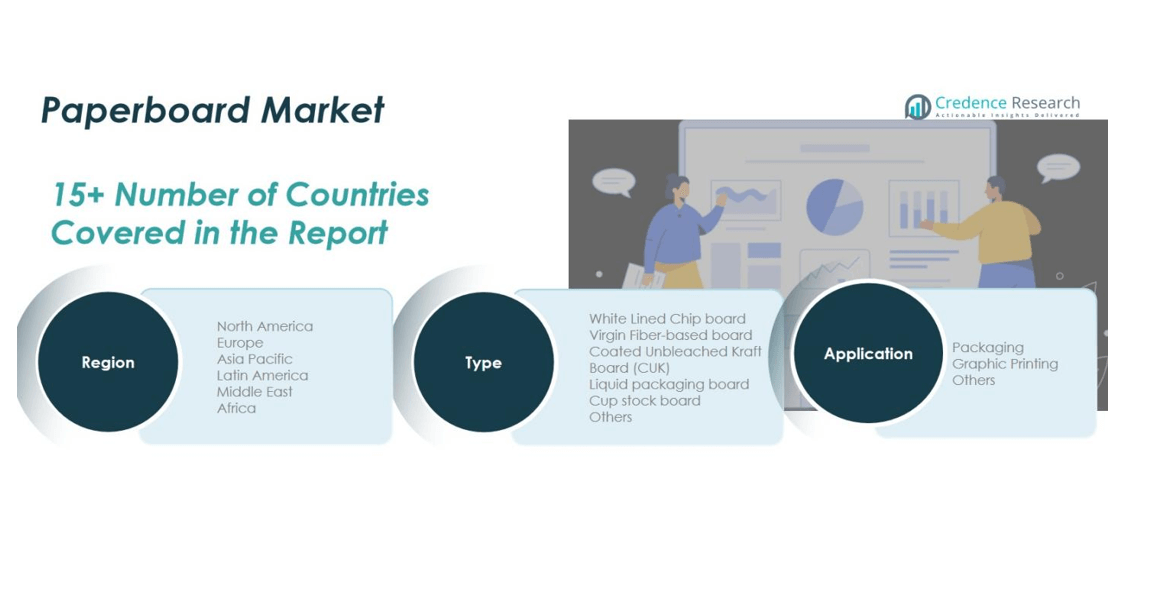
CHAPTER NO. 8 : PAPERBOARD MARKET – BY TYPE SEGMENT ANALYSIS
8.1. Paperboard Market Overview by Type Segment
8.1.1. Paperboard Market Revenue Share By Type
8.1.2. Paperboard Market Revenue Share By Type
8.2. White Lined Chip board
8.3. Virgin Fiber-based board
8.4. Coated Unbleached Kraft Board (CUK)
8.5. Liquid packaging board
8.6. Cup stock board
8.7. Others
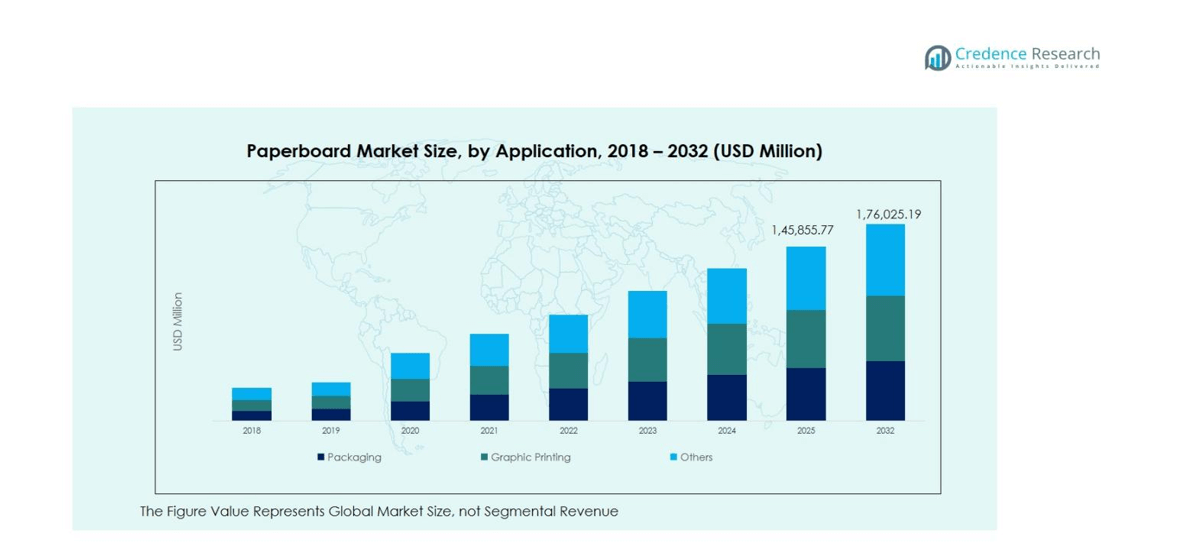
CHAPTER NO. 9 : PAPERBOARD MARKET – BY APPLICATION SEGMENT ANALYSIS
9.1. Paperboard Market Overview by Application Segment
9.1.1. Paperboard Market Revenue Share By Application
9.1.2. Paperboard Market Revenue Share By Application
9.2. Packaging
9.3. Graphic Printing
9.4. Others
CHAPTER NO. 10 : PAPERBOARD MARKET – REGIONAL ANALYSIS
10.1. Paperboard Market Overview by Region Segment
10.1.1. Global Paperboard Market Revenue Share By Region
10.1.2. Regions
10.1.3. Global Paperboard Market Revenue By Region
10.1.4. Global Paperboard Market Revenue By Region
10.1.5. Type
10.1.6. Global Paperboard Market Revenue By Type
10.1.7. Global Paperboard Market Revenue By Type
10.1.8. Application
10.1.9. Global Paperboard Market Revenue By Application
10.1.10. Global Paperboard Market Revenue By Application
CHAPTER NO. 11 : NORTH AMERICA PAPERBOARD MARKET – COUNTRY ANALYSIS
11.1. North America Paperboard Market Overview by Country Segment
11.1.1. North America Paperboard Market Revenue Share By Region
11.2. North America
11.2.1. North America Paperboard Market Revenue By Country
11.2.2. Type
11.2.3. North America Paperboard Market Revenue By Type
11.2.4. Application
11.2.5. North America Paperboard Market Revenue By Application
11.3. U.S.
11.4. Canada
11.5. Mexico
CHAPTER NO. 12 : EUROPE PAPERBOARD MARKET – COUNTRY ANALYSIS
12.1. Europe Paperboard Market Overview by Country Segment
12.1.1. Europe Paperboard Market Revenue Share By Region
12.2. Europe
12.2.1. Europe Paperboard Market Revenue By Country
12.2.2. Type
12.2.3. Europe Paperboard Market Revenue By Type
12.2.4. Application
12.2.5. Europe Paperboard Market Revenue By Application
12.3. UK
12.4. France
12.5. Germany
12.6. Italy
12.7. Spain
12.8. Russia
12.9. Rest of Europe
CHAPTER NO. 13 : ASIA PACIFIC PAPERBOARD MARKET – COUNTRY ANALYSIS
13.1. Asia Pacific Paperboard Market Overview by Country Segment
13.1.1. Asia Pacific Paperboard Market Revenue Share By Region
13.2. Asia Pacific
13.2.1. Asia Pacific Paperboard Market Revenue By Country
13.2.2. Type
13.2.3. Asia Pacific Paperboard Market Revenue By Type
13.2.4. Application
13.2.5. Asia Pacific Paperboard Market Revenue By Application
13.3. China
13.4. Japan
13.5. South Korea
13.6. India
13.7. Australia
13.8. Southeast Asia
13.9. Rest of Asia Pacific
CHAPTER NO. 14 : LATIN AMERICA PAPERBOARD MARKET – COUNTRY ANALYSIS
14.1. Latin America Paperboard Market Overview by Country Segment
14.1.1. Latin America Paperboard Market Revenue Share By Region
14.2. Latin America
14.2.1. Latin America Paperboard Market Revenue By Country
14.2.2. Type
14.2.3. Latin America Paperboard Market Revenue By Type
14.2.4. Application
14.2.5. Latin America Paperboard Market Revenue By Application
14.3. Brazil
14.4. Argentina
14.5. Rest of Latin America
CHAPTER NO. 15 : MIDDLE EAST PAPERBOARD MARKET – COUNTRY ANALYSIS
15.1. Middle East Paperboard Market Overview by Country Segment
15.1.1. Middle East Paperboard Market Revenue Share By Region
15.2. Middle East
15.2.1. Middle East Paperboard Market Revenue By Country
15.2.2. Type
15.2.3. Middle East Paperboard Market Revenue By Type
15.2.4. Application
15.2.5. Middle East Paperboard Market Revenue By Application
15.3. GCC Countries
15.4. Israel
15.5. Turkey
15.6. Rest of Middle East
CHAPTER NO. 16 : AFRICA PAPERBOARD MARKET – COUNTRY ANALYSIS
16.1. Africa Paperboard Market Overview by Country Segment
16.1.1. Africa Paperboard Market Revenue Share By Region
16.2. Africa
16.2.1. Africa Paperboard Market Revenue By Country
16.2.2. Type
16.2.3. Africa Paperboard Market Revenue By Type
16.2.4. Application
16.2.5. Africa Paperboard Market Revenue By Application
16.3. South Africa
16.4. Egypt
16.5. Rest of Africa
CHAPTER NO. 17 : COMPANY PROFILES
17.1. Kimberly-Clark Corporation (USA)
17.1.1. Company Overview
17.1.2. Type Portfolio
17.1.3. Financial Overview
17.1.4. Recent Developments
17.1.5. Growth Strategy
17.1.6. SWOT Analysis
17.2. Georgia-Pacific LLC (USA)
17.3. Graphic Packaging International (USA)
17.4. Packaging Corporation of America (USA)
17.5. Greif (USA)
17.6. Domtar (Canada)
17.7. Pactiv Evergreen (USA)
17.8. Mondi Group (UK)
17.9. DS Smith Plc (UK)
17.10. Nippon Paper Industries (Japan)
17.11. Nine Dragons Paper Holdings (China)
17.12. Lee & Man Paper Manufacturing (China)
17.13. Sappi Limited (South Africa)
17.14. Suzano S.A. (Brazil)
17.15. Stora Enso (Finland)