
Quick answer
A shrimp processing plant turns iced farmed or wild shrimp into frozen and cooked products for retail, foodservice and reprocessors. This overview models a greenfield plant making 10,000 tonnes of finished product a year, with estimated CapEx of USD 10–25 million in a producing region. Gross margin is estimated at 5–18%, depending heavily on product mix and raw prices, with payback at 3–9 years.
Viable for processors with secured farm supply, export approvals and a peeled or cooked mix; thin and volatile for plants that sell only commodity shell-on product.
Shrimp plant: key highlights
| Parameter | Indicative value | Note |
|---|---|---|
| Plant capacity | 10,000 tonnes of finished product a year | About 33 tonnes a day over 300 days, from about 16,700 tonnes of head-on shrimp |
| Total CapEx | USD 10–25 million | Greenfield in a producing region, scaled from disclosed Vietnamese plants; excludes working capital |
| Raw material share of operating cost | 80–88% | Raw shrimp near USD 3.31 per kg, global average reported in April 2026 |
| Gross margin | 5–18% | After raw shrimp and direct conversion, low end commodity, high end value-added mix |
| Payback period | 3–9 years | At 85% utilization; short end needs a value-added mix |
| IRR | Available in report | Post-tax, 10-year model |
| Break-even | Available in report | Capacity utilization basis |
Ranges assume a greenfield plant making 10,000 tonnes of finished shrimp a year in a producing region, 85% utilization, 2026 prices, assumed 60% blended yield, raw shrimp near USD 3.31 per kg and assumed realization of USD 6.70–8.25 per kg. CapEx is scaled from disclosed plants, excludes working capital and uses USD values reported by the sources. The full report can be customized to any country or region.
What is shrimp processing?
Shrimp processing turns fresh, iced shrimp from farms and boats into frozen or cooked products that can travel and meet retail and foodservice specifications. Unlike a canning line that adds value through recipe, a shrimp plant earns its keep through yield, grading accuracy and cold chain discipline.
Main product forms include head-on shell-on, headless shell-on (HLSO), peeled and deveined with tail on or off (PD and PDTO), cooked and peeled, and breaded or marinated items. Most commercial volume is warm-water whiteleg shrimp (Penaeus vannamei), with black tiger (Penaeus monodon) at larger sizes and wild or cold-water species in smaller niches.
Frozen warm-water shrimp falls under HS code 030617, frozen cold-water shrimp under 030616, and cooked or prepared shrimp under 160521 or 160529, depending on packaging. Buyers include supermarket chains, restaurant groups, importers and reprocessors that re-pack or further peel product. Retail bags, foodservice cartons and bulk blocks for reprocessing carry very different margins, so product mix should be decided before the line is designed.
Shrimp market overview and global demand
Credence Research values the global shrimp market at USD 62.12 billion in 2023, growing at a 5.51% CAGR to USD 100.93 billion by 2032. That implies about USD 69 billion in 2025, a figure derived from the 2023 value and the CAGR rather than separately measured.
Supply is concentrated in farmed whiteleg shrimp. An FAO Globefish note from August 2025 cited a projection of about 6 million tonnes of farmed output for 2025. It also reported that global imports fell 1.6% by volume and 5.9% by value in 2024, a reminder that volume growth has not always brought better prices.
UN Comtrade records for HS 030617 show how the trade splits. India exported about 720,000 tonnes in 2025 worth USD 4.97 billion, while Ecuador shipped about 1.37 million tonnes worth USD 8.21 billion and Indonesia about 135,000 tonnes worth USD 1.21 billion. On the import side, China took about 902,000 tonnes and the U.S. about 610,000 tonnes.
The unit values explain the industry's direction. Ecuador, which sells heavily to China in shell-on form, averaged about USD 6.00 per kg, while India, with more peeled product, averaged about USD 6.90 and the U.S. paid about USD 8.56 landed. Trade policy can reroute these flows quickly. A 50% U.S. tariff on Indian shrimp, imposed in August 2025 and cut in 2026, reduced Indian shipments to the U.S. by about 13% in 2025 and pushed more HLSO blocks toward China and Vietnam. Vietnam's shrimp exports reached USD 4.6 billion in 2025, supported partly by reprocessing imported raw material.
Shrimp manufacturing process
Shrimp spoils fast and darkens within hours, so the process is built around time and temperature. Everything from harvest to freezer is kept close to 0°C, and most quality complaints trace back to delays before the plant gate rather than to machinery.
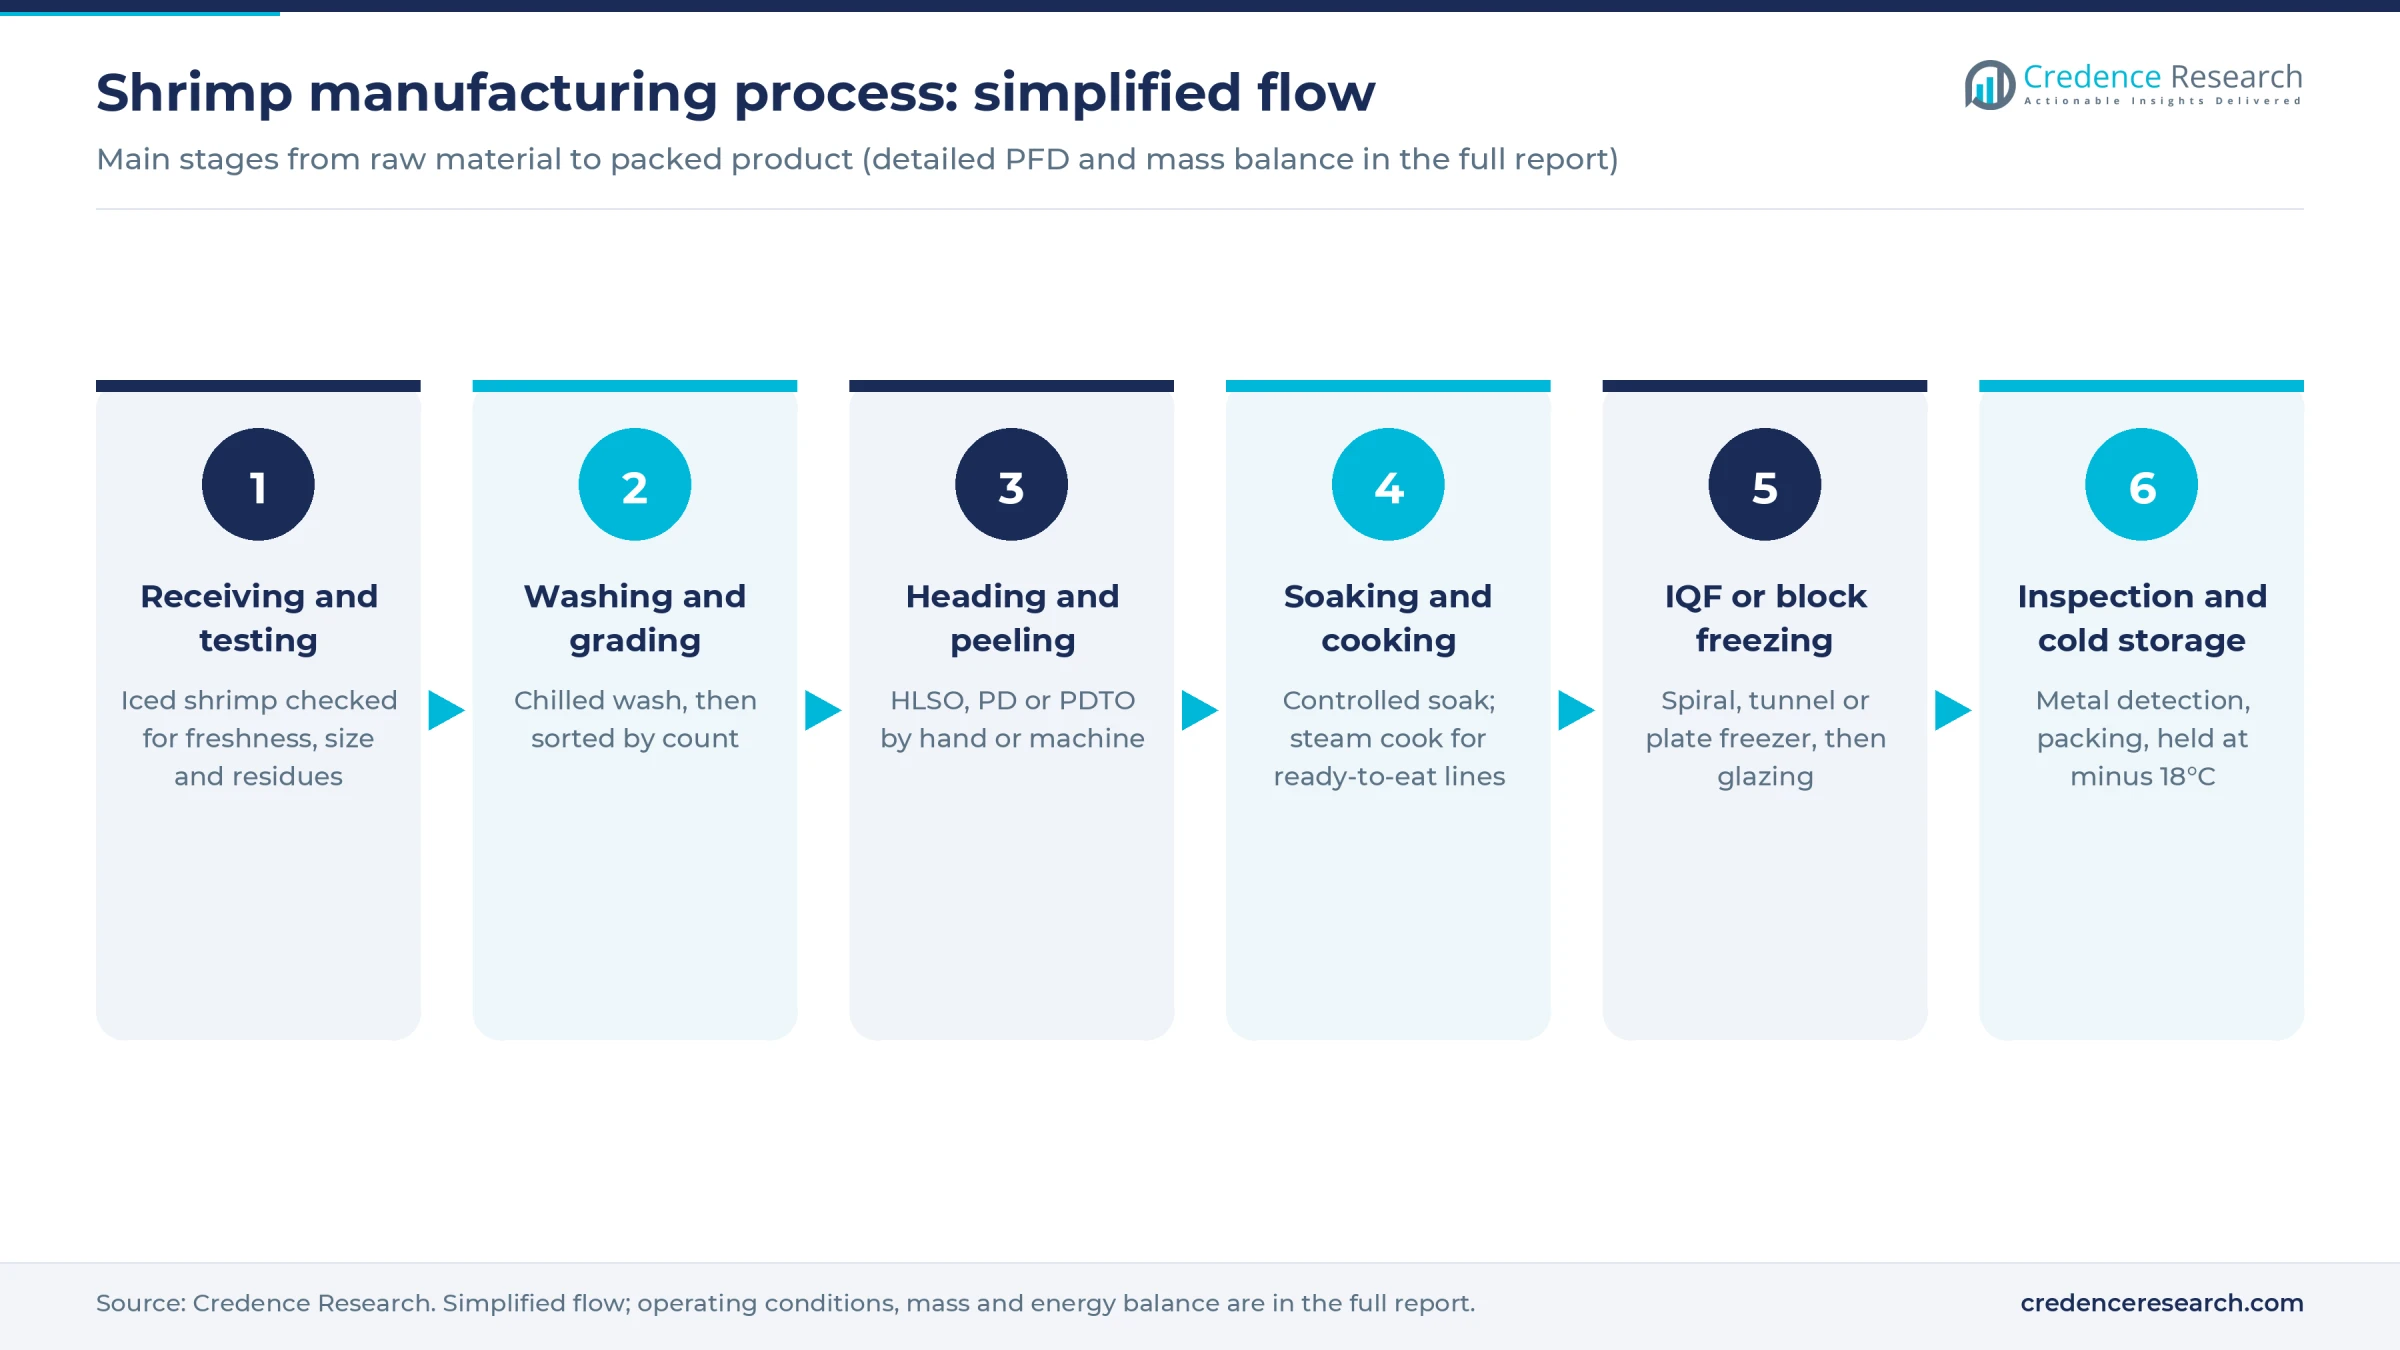
Receiving and testing. Iced shrimp arrives by insulated truck. Each lot is checked for freshness, black spot, size and, for farmed product, antibiotic residues, because a positive result at an importing port can mean a rejected container and closer scrutiny of the whole plant.
Washing and grading. Shrimp is washed in chilled potable water and sorted by count per pound or per kilogram. Count drives price, so grader accuracy has a direct financial effect.
Heading, peeling and deveining. HLSO lines remove heads only. PD and PDTO lines use hand peeling tables or roller peelers. Hand peeling recovers more meat and suits larger sizes, while machine peeling lowers labor per kilogram and suits small sizes and high-wage locations. Head and shell become a by-product for meal, flavor or chitin users.
Soaking. Many specifications allow a controlled soak in salt or food-grade phosphate blends to protect texture and reduce drip loss. Overuse inflates water content and is a known cause of buyer disputes, so inputs and pick-up are measured by lot.
Cooking, where offered. A continuous steam cooker and chilling section produce ready-to-eat shrimp. This step requires physical separation of raw and cooked zones and environmental testing for Listeria, which raises both cost and selling price.
Freezing and packing. Product passes through a spiral or tunnel individually quick frozen (IQF) freezer, or a plate freezer for blocks, then receives a glaze of ice. It clears metal detection and weight checks, then is packed and held at or below minus 18°C until shipment.
Shrimp plant setup cost
This overview models a greenfield plant producing 10,000 tonnes of finished frozen shrimp a year, about 33 tonnes a day over 300 days, using about 16,700 tonnes of head-on raw material at an assumed 60% blended yield. Estimated total CapEx is USD 10–25 million in a shrimp-producing region, excluding working capital.
The range is scaled from disclosed Vietnamese projects with a 0.65 capacity exponent. Nhatrang Seafood's Bac Lieu complex, opened in 2022 at nearly VND 400 billion (about USD 17.2 million) for about 20,000 tonnes a year, scales to about USD 11 million. Viet Uc's USD 8.6 million first phase for 5,000 tonnes scales to about USD 13.5 million. Minh Phu's announced USD 43.3 million, 30,000-tonne project of 2021 gives about USD 24 million after cost escalation, and Thong Thuan's USD 13 million, 6,500-tonne plant of 2014 gives a similar result. Scope differences explain much of the spread, particularly automation, cooked capacity and cold storage.
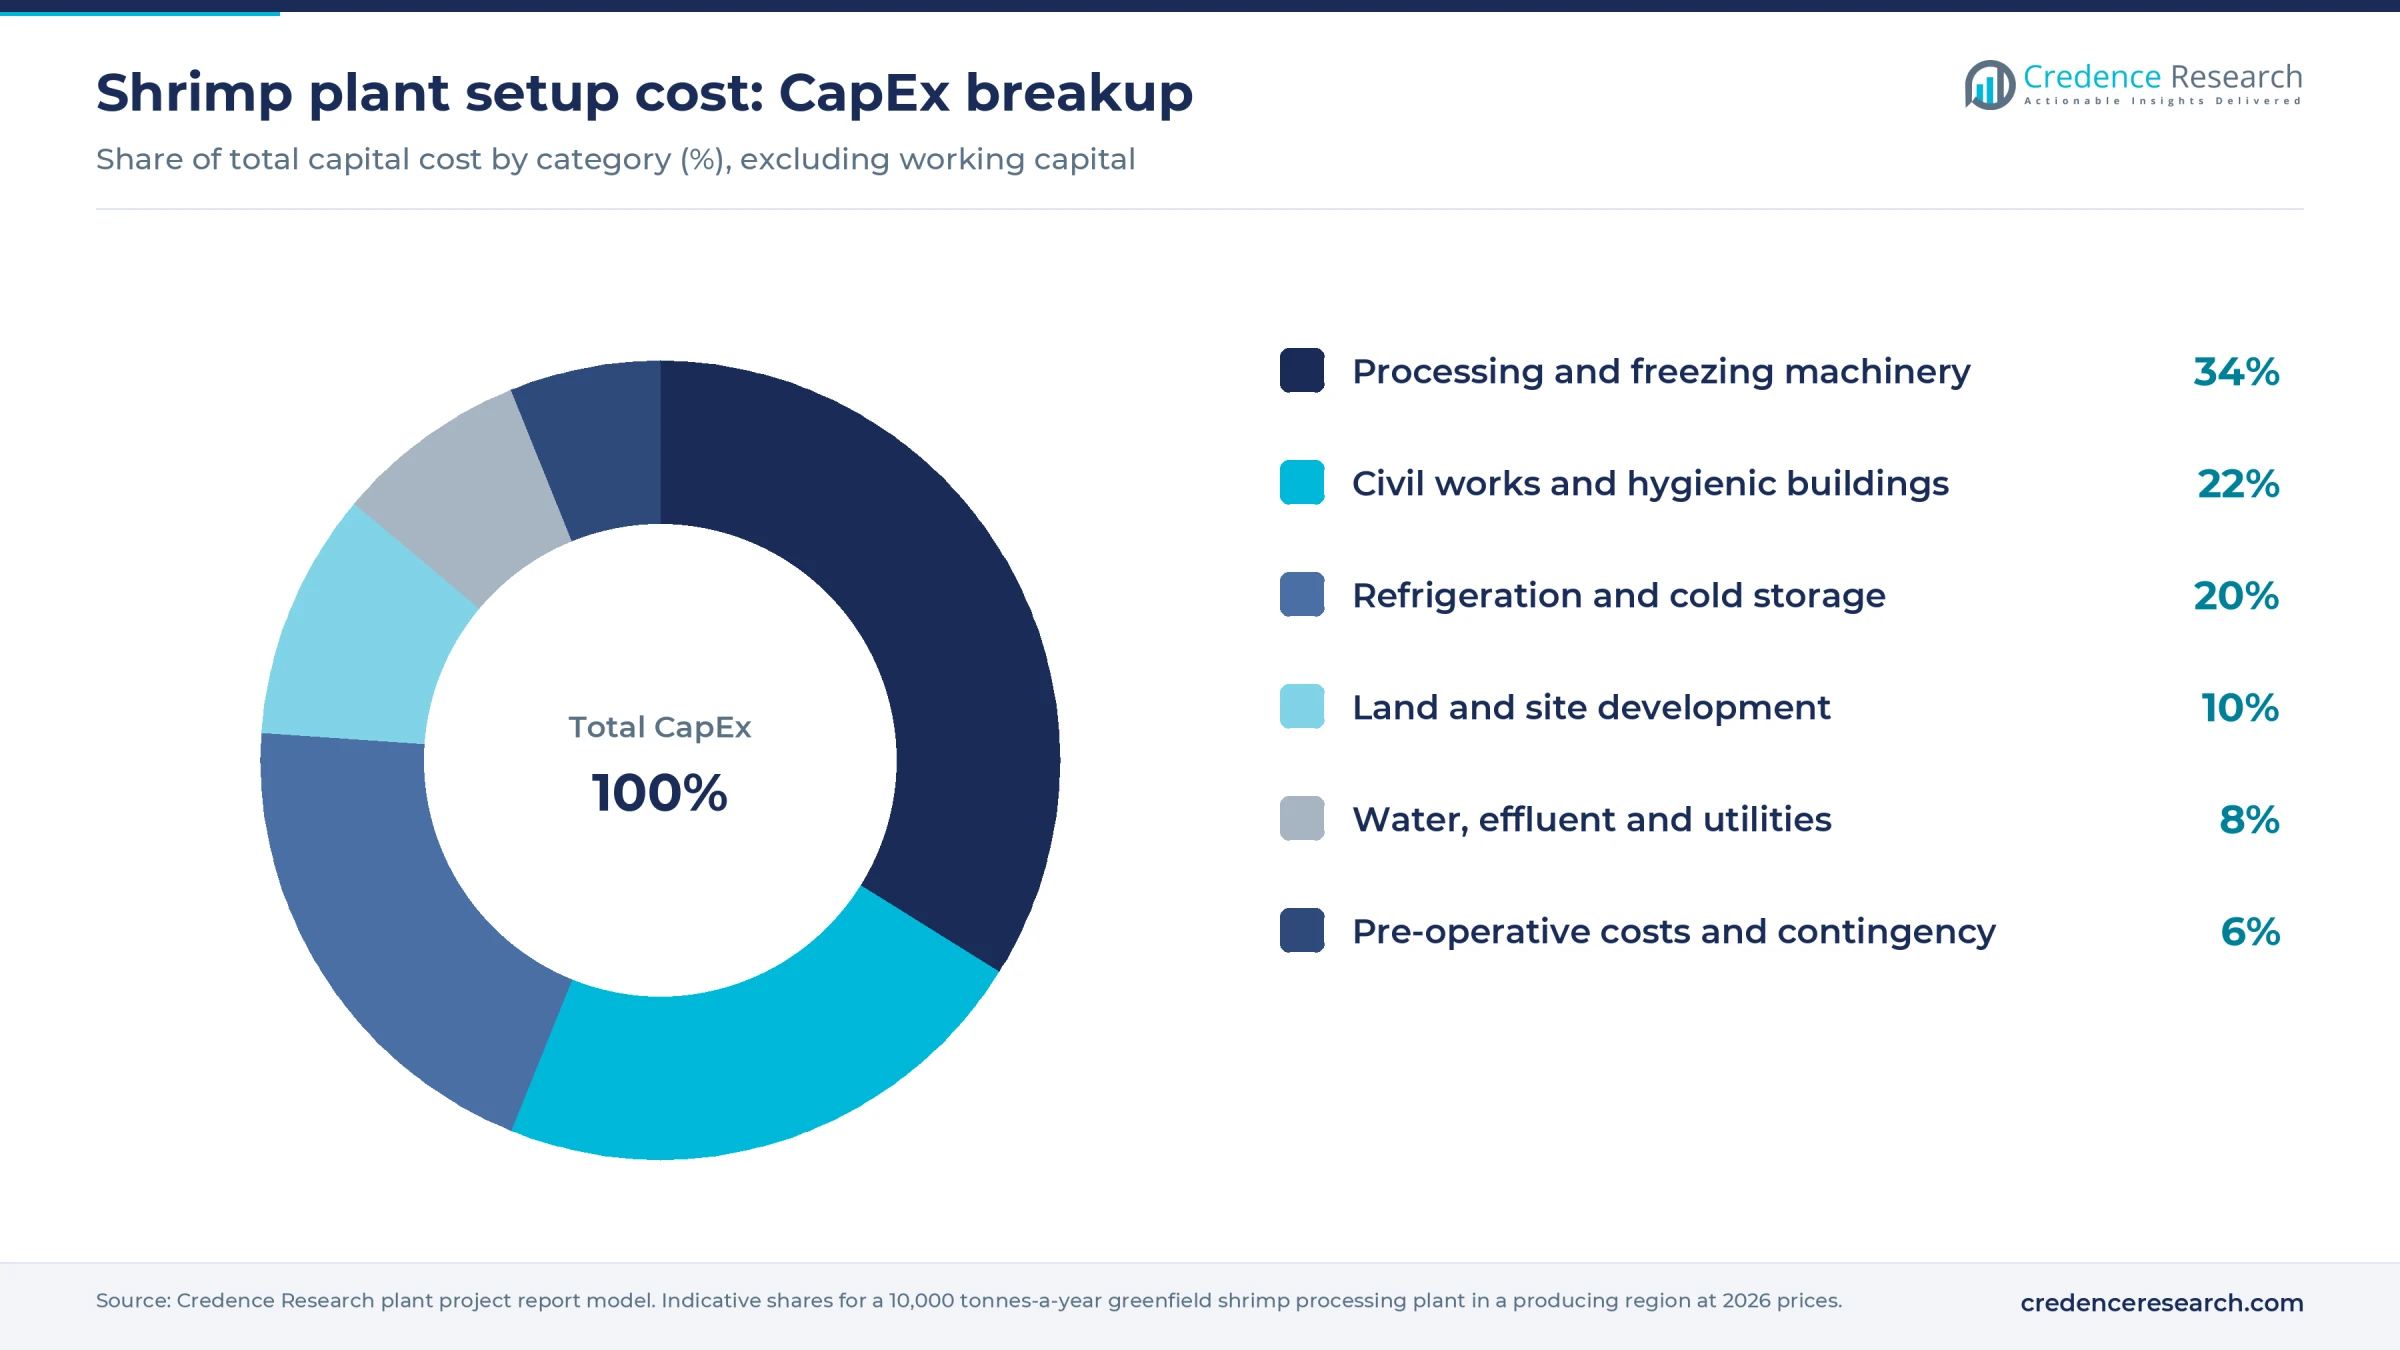
Worked example, land and site development. The plant needs an assumed 3–4 hectares, or 30,000–40,000 square meters, for processing halls, cold store, ice plant, effluent treatment and truck yard. At an assumed USD 20–60 per square meter in an Asian industrial park, land costs USD 0.6–2.4 million. Site works add an assumed USD 0.3–0.8 million, so the row is about 9–13% of CapEx. An assumed USD 40–120 per square meter at a U.S. or EU site would mean USD 1.2–4.8 million for land alone, and higher construction costs would likely put such a project at or above the top of the range. The full report can be customized to any country.
Working capital is large and separate. Thirty to 60 days of raw material, inventory and receivables could tie up an estimated USD 5–11 million, more if the plant buys ahead of harvest peaks.
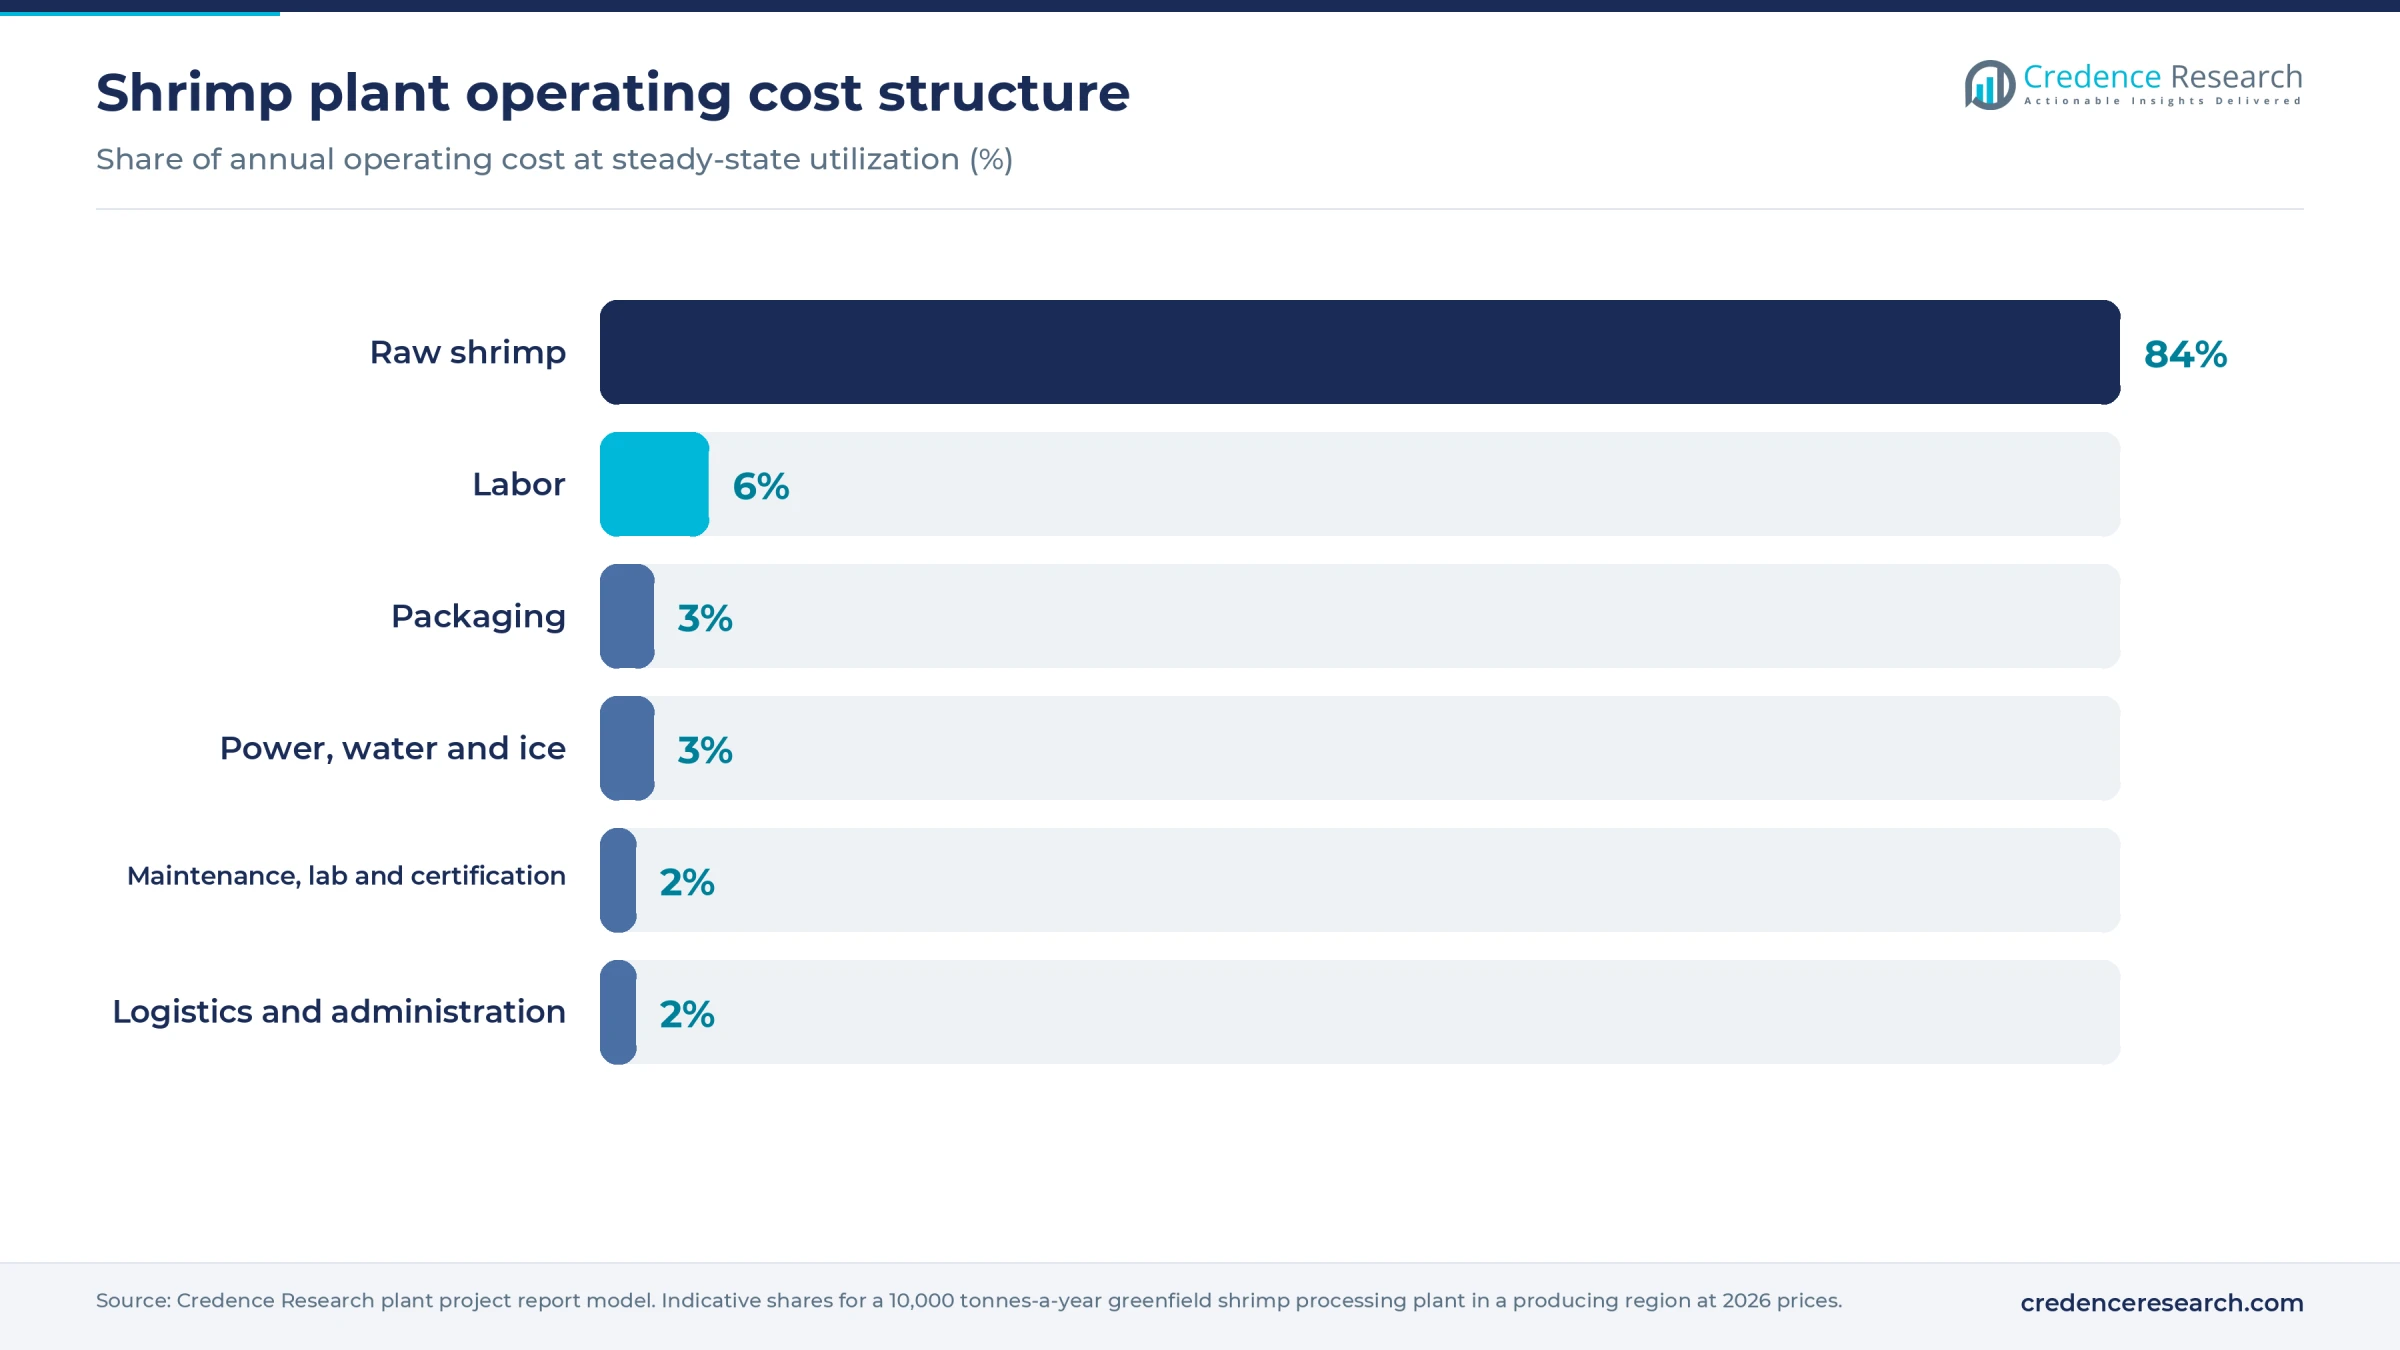
Raw shrimp takes roughly 80–88% of operating cost. Labor rises sharply when the mix moves from shell-on to peeled and cooked items.
Machinery and raw materials for a shrimp plant
A typical plant uses the following equipment, sized in the full report:
- Receiving tanks, ice-slurry holding vats and flake ice machines
- Washers, de-icing conveyors and optical or weight graders
- Hygienic peeling tables, roller peelers and deveining machines
- Soak tumblers, a continuous steam cooker and chiller for cooked lines
- IQF spiral or tunnel freezers, plate freezers and glazing units
- Metal detector or X-ray units, checkweighers and packaging machines
- Ammonia or CO2 refrigeration, cold store, water treatment and effluent treatment
Refrigeration is the utility that sets the design. An undersized system lets product warm during peaks, so plants generally size it to harvest surges rather than to average load.
Raw materials. The main input is fresh shrimp from farms in Ecuador, India, Vietnam, Indonesia, China and Thailand, plus wild catch from the Gulf of Mexico, the North Atlantic, the Arabian Sea and the South China Sea. Because shrimp must arrive iced within hours, a plant should sit inside a farm cluster, with road access to a container port. Plants can import frozen raw material for reprocessing, as Vietnam does with Ecuadorian supply, but this adds freight and duty risk. Other inputs include food-grade soak ingredients, potable water, ice, cartons, polybags and, for breaded lines, batter and crumb.
Shrimp business profit margin and ROI
Shrimp processing is a thin spread business in commodity forms. Margin depends on three things: the spread between raw and finished prices, the recovery rate and the product mix. Vietnamese industry reporting from April 2026 put the global average raw price at about USD 3.31 per kg, nearly 10% below the prior year. At a 60% blended yield, that raw shrimp alone costs about USD 5.50 per kg of finished product.
Against an India-style export realization near USD 6.90 per kg in 2025, an assumed USD 6.70–6.90 for commodity product leaves an estimated gross margin of about 5–9% after raw material and assumed direct conversion costs. A peeled, cooked or retail-packed mix at an assumed USD 8.00–8.25, near the U.S. landed unit value, can reach about 15–18% despite higher conversion costs. The stated range is therefore 5–18%.
At 85% utilization, after assumed overhead and 25% tax, annual cash profit is roughly USD 1–8.5 million. Payback falls in a 3–9 year band. The short end needs a value-added mix, and the long end reflects a commodity mix at low margin. A commodity plant at the floor margin with an expensive build may not recover its investment in that period.
Sensitivity is high. Each USD 0.10 per kg move in raw shrimp shifts gross margin by about 2–2.5 points, which is why contracts and farm relationships matter as much as equipment.
| Metric | Value |
|---|---|
| IRR (post-tax) | Available in report |
| NPV | Available in report |
| ROI | Available in report |
| DSCR | Available in report |
How to start a shrimp business, licenses and approvals
A shrimp plant generally needs business and tax registration, land use and building permits, an environmental permit covering wastewater and refrigerants, occupational safety approvals, food business registration with a documented HACCP plan, and export or import registration. Destination markets matter as much as the home country, because a plant cannot usually ship to a market until its food safety system satisfies that market's rules. Buyer audits against standards such as BRCGS, BAP or ASC often apply as well, although these are commercial rather than legal requirements.
| Market | Food safety and trade | Environment and safety |
|---|---|---|
| United States | FDA food facility registration; Seafood HACCP under 21 CFR Part 123, which also binds importers of foreign product; sulfite declaration on labels where residues apply; NOAA Seafood Import Monitoring Program records for imported shrimp | EPA effluent limits for shrimp processing under 40 CFR Part 408 through an NPDES or pretreatment permit; EPA Risk Management and OSHA Process Safety Management rules for large ammonia systems |
| European Union | Establishment approval under Regulation (EC) No 853/2004, plus hygiene rules in Regulation (EC) No 852/2004; non-EU plants must be listed for export through their national authority | National environmental permit; Industrial Emissions Directive permit above 75 tonnes of finished product a day from animal raw materials, which the modeled plant stays below; EU F-gas rules for refrigerants |
| India | FSSAI central license for exporters; Marine Products Export Development Authority registration; Export Inspection Council approval of the establishment | State pollution control board consent to establish and operate; factory registration under state rules |
Requirements change, so current rules should be confirmed with each authority before design is fixed.
Key shrimp manufacturers and recent developments
The industry combines integrated exporters with farm, feed and processing operations. Leaders include Santa Priscila, Songa and Omarsa in Ecuador; Avanti Frozen Foods, Apex Frozen Foods and Sandhya Aqua in India; Minh Phu, Sao Ta and Nhatrang Seafood in Vietnam; and Thai Union and Charoen Pokphand Foods in Thailand. Apex is reported to run 34,240 tonnes a year of capacity across two Andhra Pradesh plants, a useful scale reference. Buyers can also compare sustainability certification trends in seafood and frozen seafood packaging formats when defining a product range.
- November 2025. Gideon De Oro Seafood Corp. opened a shrimp processing plant in Toledo City, Cebu, with laboratory testing, traceability and a 1-megawatt solar installation, aiming to revive Philippine exports.
- April 2026. Avanti Feeds' board approved a 10% stake, through 3 million USD 1 par shares, in Thai Union's USD 55 million aquaculture feed mill in Ecuador, an unusual link between Indian and Ecuadorian supply chains.
- June 2026. Minh Phu set a target of 68,800 tonnes of finished shrimp for 2026 and said it is widening its value-added range for U.S. restaurant and hotel customers to reduce direct price competition.
What's inside the Shrimp project report PDF
The report runs to 21 chapters. Open a chapter to see its sections.
1. Preface
2. Scope and Methodology
- 2.1 Objectives of the Study
- 2.2 Stakeholders
- 2.3 Research Methodology
- 2.4 Data Sources and Key Assumptions
3. Executive Summary
- 3.1 Market Snapshot
- 3.2 Project at a Glance (Capacity, CapEx, OpEx)
- 3.3 Key Financial Indicators (IRR, NPV, Payback, Break-even)
- 3.4 Feasibility Verdict
4. Product Overview
- 4.1 Shrimp Definition and Properties
- 4.2 Grades and Specifications (BIS / ISO / ASTM)
- 4.3 HS Code and Classification
- 4.4 Key Applications
- 4.5 Substitutes
5. Global Shrimp Market
- 5.1 Market Overview
- 5.2 Historical and Current Market Performance (Volume and Value)
- 5.3 Market Breakup by Grade / Type
- 5.4 Market Breakup by End-Use Industry
- 5.5 Market Breakup by Region
- 5.6 Market Drivers, Restraints and Trends
- 5.7 Value Chain Analysis
- 5.8 Market Forecast
6. Target Country Shrimp Market Analysis
- 6.1 Demand and Supply Analysis
- 6.2 Installed Capacity vs Demand Gap
- 6.3 Import Dependence
- 6.4 Demand Forecast by End-Use
7. Trade Analysis
- 7.1 Imports by Volume, Value and Country
- 7.2 Exports by Volume, Value and Country
- 7.3 Trade Balance and Opportunities
8. Price Analysis
- 8.1 Historical Shrimp Price Trends by Region
- 8.2 Raw Material / Feedstock Price Trends and Linkage
- 8.3 Price Forecast
- 8.4 Margins Across the Value Chain
9. Competitive Landscape
- 9.1 Market Structure
- 9.2 Key Players and Installed Capacities
- 9.3 Profiles of Key Players
- 9.4 Recent Developments (Expansions, M&A, New Plants)
10. Manufacturing Process and Technology
- 10.1 Comparison of Technology Routes
- 10.2 Selected Route and Process Flow Diagram
- 10.3 Unit Operations Involved
- 10.4 Chemical Reactions Involved
- 10.5 Mass Balance and Raw Material Requirements
- 10.6 Energy Balance
- 10.7 Quality Assurance Criteria and Technical Tests
- 10.8 By-products and Waste Handling
- 10.9 Technology Licensors / Providers
11. Project Details, Requirements and Costs
- 11.1 Land, Location and Site Development
- 11.1.1 Site Selection Criteria
- 11.1.2 Location Analysis
- 11.1.3 Land Requirement and Costs
- 11.1.4 Site Development Costs
- 11.2 Plant Layout
- 11.2.1 Layout Principles
- 11.2.2 Proposed Layout
- 11.2.3 Factors Influencing Layout
- 11.3 Civil Works and Buildings
- 11.4 Plant Machinery
- 11.4.1 Machinery Requirements and Specifications
- 11.4.2 Machinery Costs
- 11.4.3 Machinery Suppliers
- 11.5 Raw Materials
- 11.5.1 Requirements per Tonne of Output
- 11.5.2 Procurement and Sourcing
- 11.5.3 Costs
- 11.5.4 Suppliers
- 11.6 Packaging
- 11.6.1 Packaging Requirements
- 11.6.2 Packaging Costs
- 11.6.3 Packaging Suppliers
- 11.7 Storage and Material Handling
- 11.8 Transportation Requirements and Costs
- 11.9 Utilities
- 11.9.1 Power Requirements and Costs
- 11.9.2 Water Requirements and Costs
- 11.9.3 Steam, Fuel and Other Utilities
- 11.10 Manpower Requirements and Wages
12. Environment, Health, Safety and Sustainability
- 12.1 Effluent and Emissions Management
- 12.2 Hazard Classification and Safety Measures
- 12.3 Carbon Footprint
- 12.4 Green / Low-Carbon Process Options
13. Regulatory Procedures, Approvals and Certifications
- 13.1 Licences and Registrations
- 13.2 Environmental Clearances
- 13.3 Product Certifications (BIS, REACH, etc.)
- 13.4 Approval Timeline
14. Project Implementation Schedule
15. Project Economics
- 15.1 Capital Cost of the Project
- 15.2 Techno-Economic Parameters
- 15.3 Capacity Utilization and Ramp-up
- 15.4 Product Pricing and Margins
- 15.5 Income Projections
- 15.6 Expenditure Projections
- 15.7 Working Capital Requirement
- 15.8 Taxation
- 15.9 Depreciation
16. Financial Analysis
- 16.1 Projected Profit and Loss Account
- 16.2 Projected Cash Flow Statement
- 16.3 Projected Balance Sheet
- 16.4 Liquidity Analysis
- 16.5 Profitability Analysis (Payback, NPV, IRR, ROI)
- 16.6 Break-even Analysis
- 16.7 Debt Service Coverage Ratio (DSCR)
- 16.8 Sensitivity Analysis
- 16.9 Scenario and Uncertainty Analysis
17. Funding and Incentives
- 17.1 Means of Finance and Debt-Equity Structure
- 17.2 Loans and Financial Assistance
- 17.3 Government Schemes and Subsidies (PLI, State Policies)
18. Risk Assessment
- 18.1 Key Success Factors
- 18.2 Key Risk Factors
- 18.3 Risk Mitigation
19. Strategic Recommendations
20. Case Study of a Successful Venture
21. Appendix
- 21.1 Detailed Assumptions
- 21.2 Abbreviations
- 21.3 List of Tables and Figures
- 21.4 Sources
This page vs. the full report
| Data point | On this page (free) | In the full report |
|---|---|---|
| Total CapEx | One rounded range at one capacity | Exact figure at three capacities with a line-item breakup |
| CapEx breakup | Category shares (%) only | Cost, quantity and supplier for every machine |
| Operating cost | Share of raw materials, utilities and labor | Per-unit cost sheet with each input price and consumption |
| Profitability | Gross margin range and payback band | Exact IRR, NPV, ROI, break-even and DSCR |
| Financial statements | List of what is included | 10-year P&L, cash flow, balance sheet and Excel model |
| Sensitivity | One directional line | Full sensitivity and scenario tables |
| Process | Simplified flow diagram | Detailed process flow, mass and energy balance, operating conditions |
| Machinery | Names of the main machines | Specifications, capacity, cost and supplier list |
| Market | Headline size, growth and India demand trend | Segment, region, trade and price forecast tables |
| Suppliers and buyers | Supplier types and sourcing hubs | Named suppliers and buyers |
Shrimp project report: FAQs
How much does a shrimp processing plant cost?
What gross margin can a shrimp processor earn?
What is the payback period for a shrimp plant?
Where should a shrimp processing plant be located?
Which HS code applies to frozen shrimp?
Which approvals does a shrimp plant need to export?
What is the biggest risk in shrimp processing?

About the analyst
Priyanka Mor, Senior Consultant
Senior Consultant at Credence Research Inc directing strategic market advisory, cross-border commercial due diligence and enterprise intelligence frameworks for global B2B clients. Combines quantitative modeling with executive advisory, translating macroeconomic variables and supply chain data into go-to-market blueprints, M&A screenings and competitive war-gaming strategies.
Related market research
- Shrimp Market Size, Share, Growth, Trend and Forecast 2032
- Sustainable Seafood Market Size, Trends, Share and Forecast 2032
- Frozen Seafood Packaging Market Size, Growth and Forecast 2032
- Asia Pacific Shrimp Market Size, Share, Growth and Forecast 2032
- India Shrimp Market Size, Share Growth and Forecast 2032
- United States Shrimp Market Size, Growth & Forecast 2032
More plant project reports
- Instant Coffee Manufacturing Plant Project Report (DPR) 2026
- Pectin Manufacturing Plant Project Report (DPR) 2026
- Parboiled White Rice Processing Plant Project Report (DPR) 2026
- Potato Processing Plant Prefeasibility Report 2026
- Corn Starch Manufacturing Plant Project Report (DPR) 2026
- Cassava Starch Manufacturing Plant Project Report (DPR) 2026