
Quick answer
A pectin manufacturing plant extracts the gelling polysaccharide from dried citrus peel or apple pomace using hot dilute acid and alcohol precipitation. This overview models a greenfield plant making 3,000 tonnes a year, with estimated CapEx of USD 30–100 million depending on cost region and peel handling. Gross margin after peel and direct conversion costs is estimated at 25–40%, with payback at 5–12 years, a long horizon set by heavy capital needs.
Viable for processors with secured peel or pomace and solvent recovery expertise, ideally at a low-cost site beside juice plants; hard to justify at international-standard build costs without premium grades.
Pectin plant: key highlights
| Parameter | Indicative value | Note |
|---|---|---|
| Plant capacity | 3,000 tonnes of pectin per year | About 10 tonnes a day over 300 operating days |
| Total CapEx | USD 30–100 million | Greenfield; low end integrated, lower-cost build, high end international-standard plant with fresh peel handling |
| Raw material share of operating cost | 45–60% | About 6–7.5 kg of dried peel per kg of pectin |
| Gross margin | 25–40% | After peel and direct conversion costs, at USD 10.5–14 per kg |
| Payback period | 5–12 years | From commissioning, including ramp-up and customer qualification |
| IRR | Available in report | Post-tax, 10-year model |
| Break-even | Available in report | Capacity utilization basis |
Ranges assume a 3,000 tonnes-per-year greenfield plant, 300 operating days, 85% steady-state utilization and 2026 prices. Dried peel at an assumed USD 400–700 per tonne delivered; blended selling price USD 10.5–14 per kg, within 2024 UN Comtrade export unit values. CapEx is scaled from disclosed plants and excludes working capital; EUR converted at an assumed 1.10 per USD for 2019. The full report can be customized to any country or region.
What is pectin?
Pectin is a plant polysaccharide, chiefly partly methylated polygalacturonic acid, that forms gels and stabilizes acidic liquids. Commercial pectin is a cream to light tan powder standardized by blending with sugar or dextrose to a fixed gel strength, so buyers pay for function rather than for raw weight.
Producers split grades by degree of esterification. High-methoxyl pectin sets in high-sugar, acidic systems such as jam, jelly and fruit confectionery and protects milk protein in drinking yogurt and acidified dairy drinks. Low-methoxyl and amidated grades set with calcium, which suits reduced-sugar spreads and fruit preparations. Smaller volumes go into pharmaceuticals, dietary supplements, gummies and cosmetics. The EU labels these products E 440(i) and E 440(ii). Citrus peel and apple pomace supply nearly all output, while sugar beet pulp yields a niche emulsifying type covered in the sugar beet pectin market study. Pectin is classified under Harmonized System subheading 1302.20, pectic substances, pectinates and pectates.
Pectin market overview and global demand
Pectin is a small, concentrated industry inside the wider texturant market. Credence Research values global food hydrocolloids at USD 7.69 billion in 2024 with a 4.4% CAGR through 2032, which implies about USD 8.03 billion in 2025. Volume estimates conflict: a February 2026 preprint review of the industry, not yet peer reviewed cites about 30,000 tonnes of output in 2009, more than 60,000 tonnes by 2018 and a 70,000-tonne figure for 2020.
Trade data show where value sits. UN Comtrade records for 2024 show reporting countries importing about 54,600 tonnes worth USD 848 million. The U.S. led imports at USD 154 million and about 9,240 tonnes, followed by France, China, Germany and Japan at USD 43–53 million each. Germany led exports at USD 227 million and about 13,230 tonnes, ahead of Brazil at USD 112 million and 11,190 tonnes, China at USD 83 million and 7,440 tonnes, and Czechia and France. Totals omit countries that did not report, and some entries likely reflect re-export or blending.
Export unit values split the market in two. Brazil and China averaged USD 10–11 per kg in 2024, while Czechia, France and Germany averaged USD 15–17, reflecting standardized and specialty grades plus customer service. Spain reported about 15,350 tonnes at only USD 2.67 per kg, which suggests lower-strength material, so that figure is not used as a price guide.
Demand follows jam, dairy drinks, confectionery and clean-label reformulation. Buyers qualify suppliers slowly, and a new plant must pass application trials and audits before volume arrives. Peel availability shapes supply: USDA projected 2025/26 world orange output at 45.9 million tonnes, with 17.1 million tonnes going to processors, Citrus Industry magazine reported in February 2026.
Pectin manufacturing process
Commercial pectin is made by hot dilute acid extraction followed by alcohol precipitation. The U.S. regulation on pectins describes the same route, and EU rules allow only methanol, ethanol or isopropanol as organic precipitants. The chemistry is simple; the cost lies in handling huge volumes of dilute liquor and recovering solvent.
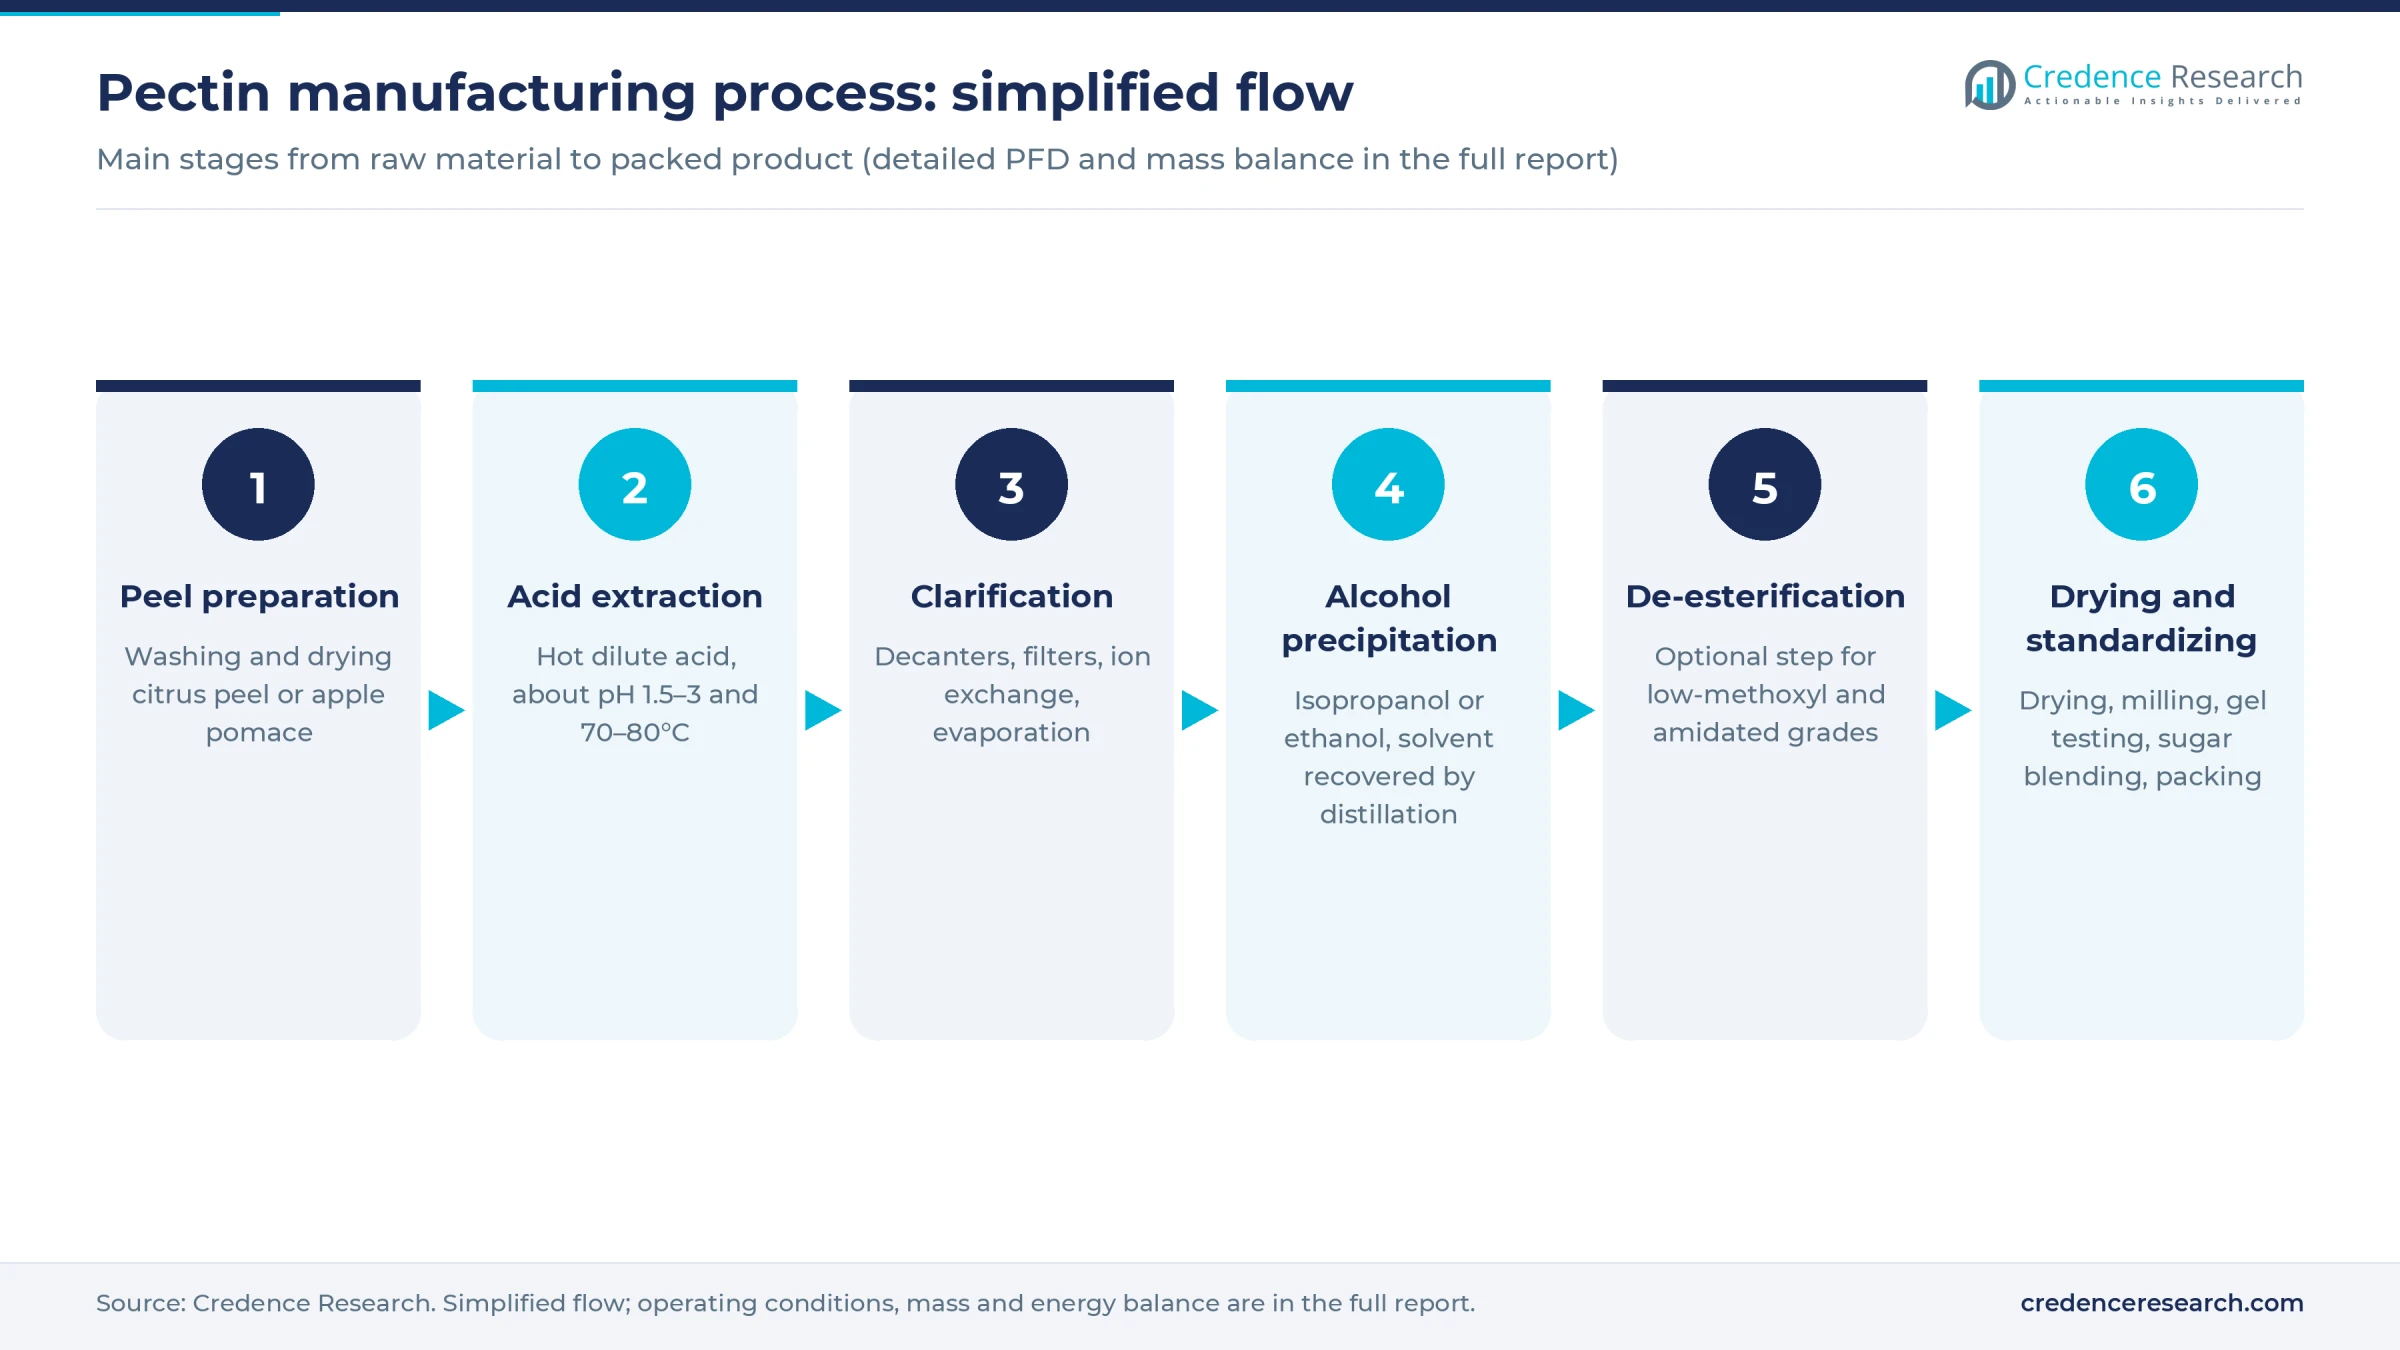
- Peel preparation. Juice plants deliver peel at about 80% moisture. It is washed to remove sugars and bitter compounds, then dried to under 10% moisture for storage, or processed fresh when the plant sits next to the juice line.
- Acid extraction. Peel is held in stirred tanks with mineral acid at about pH 1.5–3 and 70–80°C for roughly 1.5–2 hours. Time, heat and pH set the degree of esterification and therefore the grade.
- Clarification and concentration. Decanters, filters with filter aid and ion exchange columns remove solids and metal ions, and evaporators raise the extract's concentration so that less alcohol is needed.
- Alcohol precipitation. Concentrate is mixed with isopropanol or ethanol, often about two volumes of alcohol per volume of extract, and the pectin separates as fibers. Presses remove liquor, and distillation columns recover alcohol for reuse.
- De-esterification, where needed. Low-methoxyl grades are treated further with acid or alkali, and ammonia yields amidated grades.
- Drying, milling and standardizing. Wet fibers are dried, ground, tested for gel strength or viscosity and blended with sugar to a fixed grade before packing.
Yield typically runs near 3% of wet peel weight, according to the 2026 preprint, which implies about 6–7.5 kg of dried peel per kg of pectin. Spent peel is pressed and sold as cattle feed, a modest credit that also keeps the solid waste out of disposal.
Pectin plant setup cost
This overview models a greenfield plant making 3,000 tonnes a year, about 10 tonnes a day, at an estimated total CapEx of USD 30–100 million. Size matters because alcohol recovery, evaporation, drying and effluent treatment carry high fixed costs, and known industrial plants range from about 1,000 to 6,000 tonnes a year.
The low end rests on two disclosures. T.B.Fruit reported about EUR 25 million in 2019 for a 3,000 tonnes-per-year apple pectin plant in Ukraine's Lviv region, roughly USD 36 million after currency conversion and plant cost escalation. A Turkish government prefeasibility study from 2021 priced a 100 tonnes-per-year unit at about USD 1.9 million, which scales only loosely to about USD 23 million. The high end comes from Cargill's USD 150 million plant at Bebedouro, Brazil, opened in 2021 and cited at about 6,000 tonnes a year in a February 2026 preprint, not by Cargill. Scaled with a standard capacity exponent and escalated, that points to about USD 100–110 million, including fresh peel handling and biomass energy.
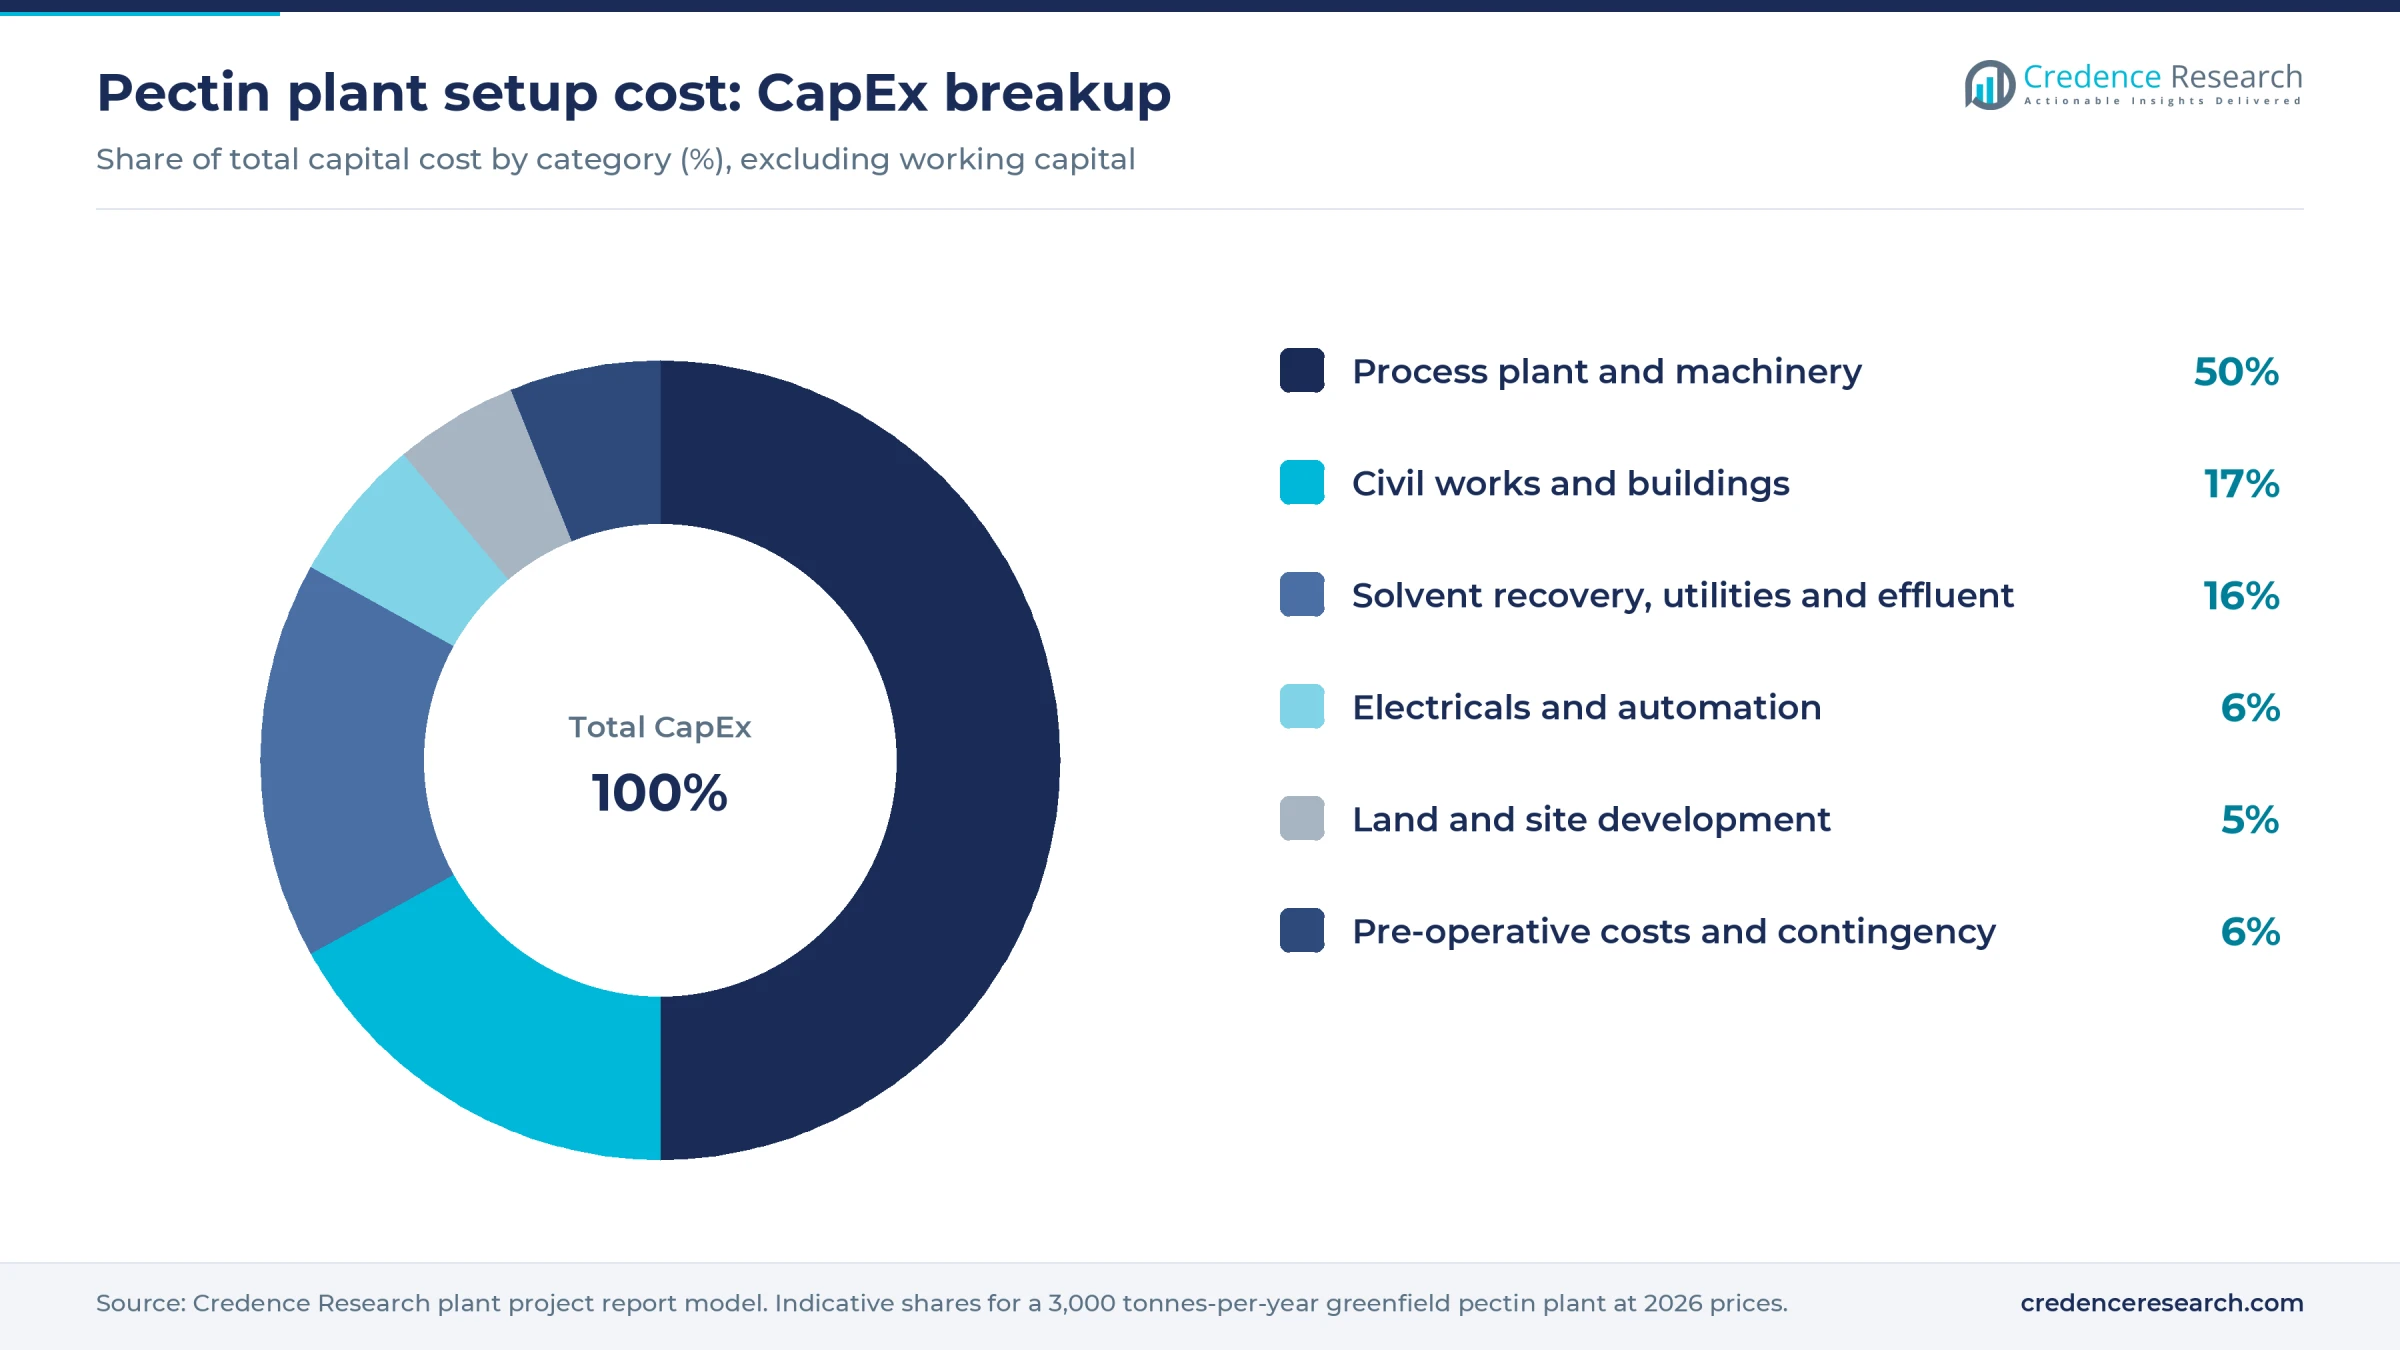
Worked example, land and site development. A 3,000-tonne plant needs an assumed 40,000–60,000 square meters, with separation distances around the solvent tank farm. At an assumed USD 20–60 per square meter in an Asian or Latin American industrial park, the plot costs about USD 0.8–3.6 million, and at an assumed USD 30–80 at a U.S. or EU site, about USD 1.2–4.8 million. Site works add an assumed USD 0.5–1.5 million, so this row runs from about 4% of CapEx at a large low-cost build to about 14% when a high-priced site is paired with a lower-cost build.
Working capital is separate. Peel stock, about two months of receivables and finished goods tie up an estimated USD 6–10 million.
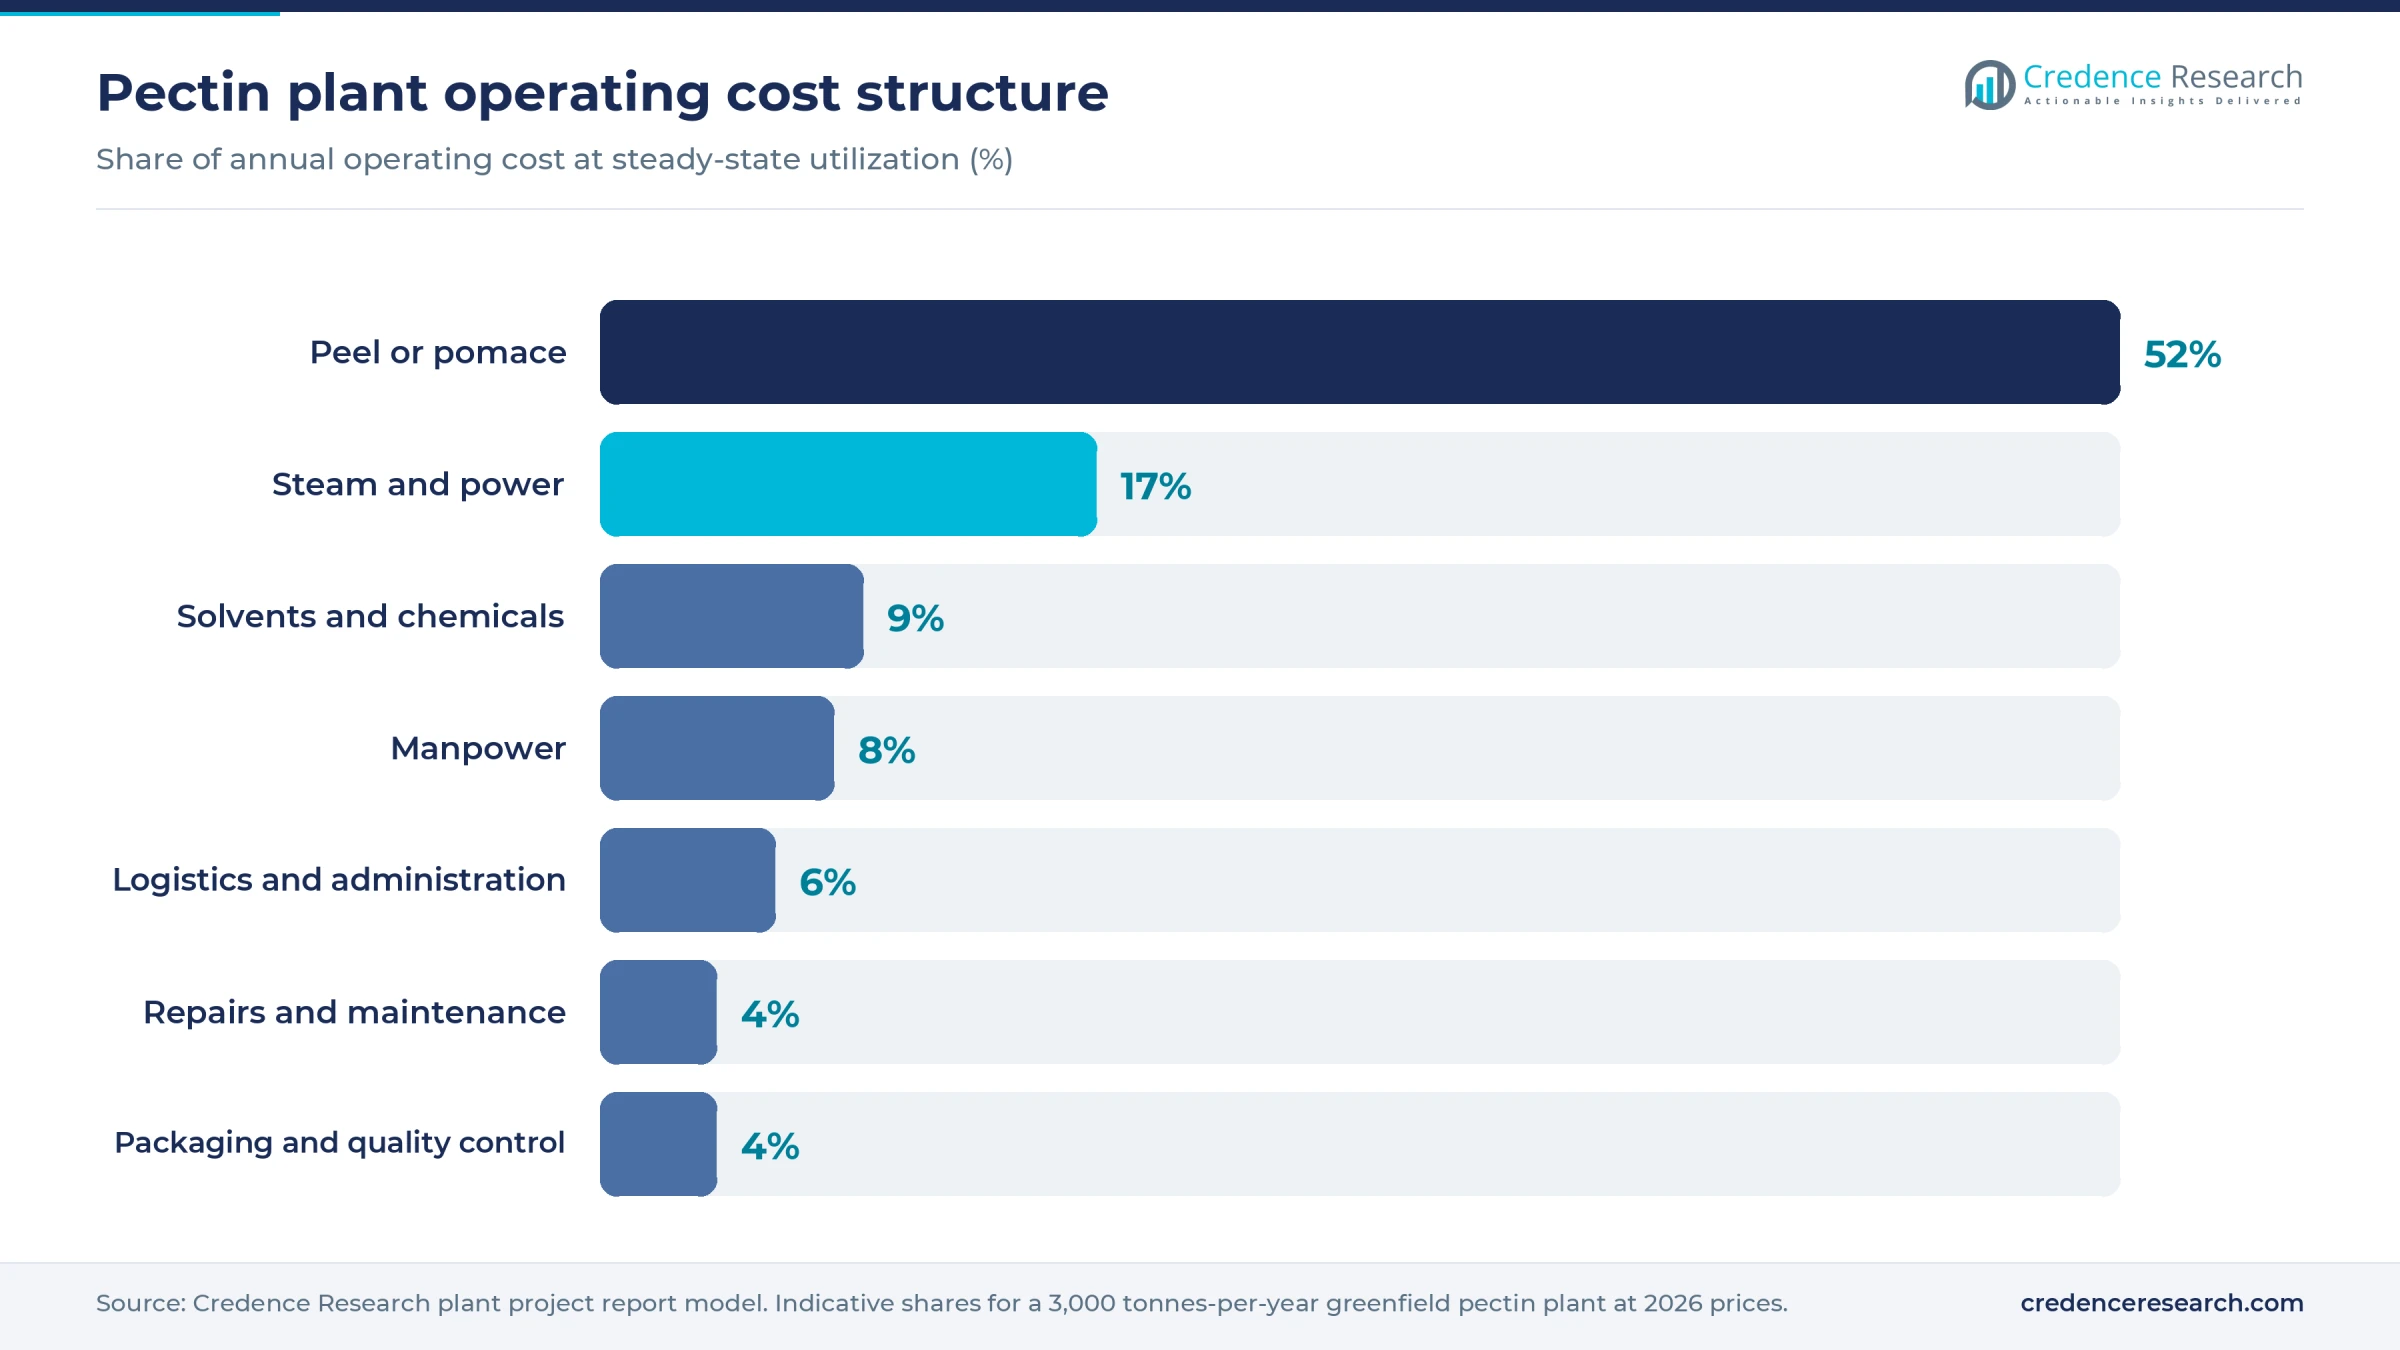
Peel is the largest operating cost, followed by steam and power for evaporation, distillation and drying. Each percentage point of alcohol loss also feeds directly into cost.
Machinery and raw materials for a pectin plant
The main machinery groups are listed below; capacities, specifications and quotations are available in the report.
- Peel handling: washers, presses, rotary dryers, dried peel silos or warehouses
- Extraction: acid-resistant stirred reactors, heat exchangers, decanter centrifuges, filter presses
- Purification: polishing filters, ion exchange columns, multiple-effect evaporators
- Precipitation and recovery: precipitation vessels, explosion-protected presses, alcohol distillation columns, solvent tank farm with inerting
- Finishing: vacuum or fluid bed dryers, mills, sieves, blenders, packing line, quality laboratory for gel strength testing
- Utilities: boiler, cooling towers, water treatment, effluent treatment, peel residue dryer for feed
Dried citrus peel or apple pomace is the main input, supplied by juice processors rather than farms. The 2026 preprint reports a 2009 feedstock mix of about 85% citrus, led by lemon and lime, and 14% apple. Sourcing regions include Brazil and Argentina for orange and lemon, Mexico and Peru for lime and lemon, Spain and Italy for Mediterranean citrus, and China and Eastern Europe for apple. The quality test is pectin content and color, since poorly dried or fermented peel loses gel strength. Citrus greening and weak crops can tighten supply quickly, and rival buyers include citrus fiber makers, as the citrus fiber market grows. Other inputs are nitric or sulfuric acid, isopropanol or ethanol makeup, filter aid, ion exchange resin, sugar for standardizing and boiler fuel.
Pectin business profit margin and ROI
Pectin earns a higher margin than most agricultural ingredients, but capital intensity dilutes the return. For the modeled plant, gross margin after peel and direct conversion costs is estimated at 25–40%, at a blended price of USD 10.5–14 per kg. Payback runs 5–12 years after commissioning, including ramp-up, with the shorter end needing a lower-cost build near USD 30–50 million.
Revenue of about USD 27–36 million a year on 2,550 tonnes must cover heavy fixed costs: technical service, application laboratories, audits and sales. Those overheads, assumed at USD 2–4 million a year, sit below the gross margin line and explain why a healthy margin still gives a long payback. At the high end of the CapEx range, projects rarely clear in 10 years without premium grades or captive peel.
Three things drive margin. Peel contract price matters most: a USD 100 per tonne rise in dried peel that cannot be passed through cuts gross margin by about 5–6 percentage points. UN Comtrade shows citrus and melon peel export values of about USD 1.2–1.7 per kg in 2024 for leading shippers, well above the assumed bulk contract price, though that code also covers small-lot and melon peel. Peel at those values would erase the margin, so long-term supply agreements are essential. Grade mix is next, since European export values run about USD 4–7 per kg above Brazil and China. Alcohol recovery is the third, and small losses compound quickly. Selling only commodity high-methoxyl grades against Asian supply is the main commercial risk.
| Metric | Value |
|---|---|
| Project IRR (post-tax) | Available in report |
| NPV | Available in report |
| Return on investment | Available in report |
| DSCR | Available in report |
| Break-even utilization | Available in report |
How to start a pectin business, licenses and approvals
A pectin plant needs approvals in six areas wherever it is built. These are business and tax registration; land use, zoning and building permits; an environmental permit covering solvent emissions, acidic wastewater and boiler stacks; safety approvals for flammable alcohol storage, explosion zones and pressure equipment; food additive and facility registration; and customs registration for export. The solvent system usually draws the closest scrutiny, so tank farm siting should be settled before land is bought.
| Market | Food product | Environment and safety |
|---|---|---|
| United States | FDA food facility registration and 21 CFR 117; pectins are affirmed as generally recognized as safe under 21 CFR 184.1588 | State air permit covering volatile organic compounds; NPDES or local pretreatment permit; OSHA rules, with process safety management possibly applying to large flammable liquid inventories; a TTB permit where specially denatured alcohol is used |
| European Union | Food business registration under Regulation (EC) No 852/2004; E 440 specifications in Regulation (EU) No 231/2012, as amended; feed registration under Regulation (EC) No 183/2005 for spent peel | National environmental permit, with a plant this size usually below the Industrial Emissions Directive's 300-tonne daily threshold for vegetable raw materials; ATEX rules for explosive atmospheres |
| India | FSSAI central license, required above 2 tonnes a day of installed capacity | State pollution control board consents to establish and operate; factory license and boiler registration; flammable solvent storage approvals, confirmed locally with the Petroleum and Explosives Safety Organisation and state authorities; state excise permission for ethanol |
Pharmaceutical grades must also meet the relevant pharmacopoeia, and large food customers commonly require certified food safety systems such as FSSC 22000, plus kosher and halal certification.
Key pectin manufacturers and recent developments
Pectin supply is concentrated. The International pectin Producers Association lists Cargill, CEAMSA, dsm-firmenich's Yantai unit, Herbstreith & Fox, JRS Silvateam Ingredients, IFF and Tate & Lyle, which acquired CP Kelco in 2024. T.B.Fruit in Ukraine and Chinese makers such as Dangshan Haisheng and Anhui Jinfeng add regional capacity.
- January 2026. The European Commission adopted Regulation (EU) 2026/196, applying from August 2026, which added microbiological criteria to E 440 specifications and set limits on use in foods for young children.
- March 2026. Tate & Lyle extended a partnership with Van Triest CirQlar on citrus pulp co-products from its pectin plant at Grossenbrode, Germany, supporting a target of beneficial use of all waste by 2030.
- June 2026. Ingredion agreed an all-cash offer for Tate & Lyle of about GBP 2.7 billion. Shareholders approved it in July, with completion expected in the second half of 2027, subject to regulatory and court approvals.
Feedstock competition also comes from the citrus peel extract market, which draws on the same citrus by-products.
What's inside the Pectin project report PDF
The report runs to 21 chapters. Open a chapter to see its sections.
1. Preface
2. Scope and Methodology
- 2.1 Objectives of the Study
- 2.2 Stakeholders
- 2.3 Research Methodology
- 2.4 Data Sources and Key Assumptions
3. Executive Summary
- 3.1 Market Snapshot
- 3.2 Project at a Glance (Capacity, CapEx, OpEx)
- 3.3 Key Financial Indicators (IRR, NPV, Payback, Break-even)
- 3.4 Feasibility Verdict
4. Product Overview
- 4.1 Pectin Definition and Properties
- 4.2 Grades and Specifications (BIS / ISO / ASTM)
- 4.3 HS Code and Classification
- 4.4 Key Applications
- 4.5 Substitutes
5. Global Pectin Market
- 5.1 Market Overview
- 5.2 Historical and Current Market Performance (Volume and Value)
- 5.3 Market Breakup by Grade / Type
- 5.4 Market Breakup by End-Use Industry
- 5.5 Market Breakup by Region
- 5.6 Market Drivers, Restraints and Trends
- 5.7 Value Chain Analysis
- 5.8 Market Forecast
6. Target Country Pectin Market Analysis
- 6.1 Demand and Supply Analysis
- 6.2 Installed Capacity vs Demand Gap
- 6.3 Import Dependence
- 6.4 Demand Forecast by End-Use
7. Trade Analysis
- 7.1 Imports by Volume, Value and Country
- 7.2 Exports by Volume, Value and Country
- 7.3 Trade Balance and Opportunities
8. Price Analysis
- 8.1 Historical Pectin Price Trends by Region
- 8.2 Raw Material / Feedstock Price Trends and Linkage
- 8.3 Price Forecast
- 8.4 Margins Across the Value Chain
9. Competitive Landscape
- 9.1 Market Structure
- 9.2 Key Players and Installed Capacities
- 9.3 Profiles of Key Players
- 9.4 Recent Developments (Expansions, M&A, New Plants)
10. Manufacturing Process and Technology
- 10.1 Comparison of Technology Routes
- 10.2 Selected Route and Process Flow Diagram
- 10.3 Unit Operations Involved
- 10.4 Chemical Reactions Involved
- 10.5 Mass Balance and Raw Material Requirements
- 10.6 Energy Balance
- 10.7 Quality Assurance Criteria and Technical Tests
- 10.8 By-products and Waste Handling
- 10.9 Technology Licensors / Providers
11. Project Details, Requirements and Costs
- 11.1 Land, Location and Site Development
- 11.1.1 Site Selection Criteria
- 11.1.2 Location Analysis
- 11.1.3 Land Requirement and Costs
- 11.1.4 Site Development Costs
- 11.2 Plant Layout
- 11.2.1 Layout Principles
- 11.2.2 Proposed Layout
- 11.2.3 Factors Influencing Layout
- 11.3 Civil Works and Buildings
- 11.4 Plant Machinery
- 11.4.1 Machinery Requirements and Specifications
- 11.4.2 Machinery Costs
- 11.4.3 Machinery Suppliers
- 11.5 Raw Materials
- 11.5.1 Requirements per Tonne of Output
- 11.5.2 Procurement and Sourcing
- 11.5.3 Costs
- 11.5.4 Suppliers
- 11.6 Packaging
- 11.6.1 Packaging Requirements
- 11.6.2 Packaging Costs
- 11.6.3 Packaging Suppliers
- 11.7 Storage and Material Handling
- 11.8 Transportation Requirements and Costs
- 11.9 Utilities
- 11.9.1 Power Requirements and Costs
- 11.9.2 Water Requirements and Costs
- 11.9.3 Steam, Fuel and Other Utilities
- 11.10 Manpower Requirements and Wages
12. Environment, Health, Safety and Sustainability
- 12.1 Effluent and Emissions Management
- 12.2 Hazard Classification and Safety Measures
- 12.3 Carbon Footprint
- 12.4 Green / Low-Carbon Process Options
13. Regulatory Procedures, Approvals and Certifications
- 13.1 Licences and Registrations
- 13.2 Environmental Clearances
- 13.3 Product Certifications (BIS, REACH, etc.)
- 13.4 Approval Timeline
14. Project Implementation Schedule
15. Project Economics
- 15.1 Capital Cost of the Project
- 15.2 Techno-Economic Parameters
- 15.3 Capacity Utilization and Ramp-up
- 15.4 Product Pricing and Margins
- 15.5 Income Projections
- 15.6 Expenditure Projections
- 15.7 Working Capital Requirement
- 15.8 Taxation
- 15.9 Depreciation
16. Financial Analysis
- 16.1 Projected Profit and Loss Account
- 16.2 Projected Cash Flow Statement
- 16.3 Projected Balance Sheet
- 16.4 Liquidity Analysis
- 16.5 Profitability Analysis (Payback, NPV, IRR, ROI)
- 16.6 Break-even Analysis
- 16.7 Debt Service Coverage Ratio (DSCR)
- 16.8 Sensitivity Analysis
- 16.9 Scenario and Uncertainty Analysis
17. Funding and Incentives
- 17.1 Means of Finance and Debt-Equity Structure
- 17.2 Loans and Financial Assistance
- 17.3 Government Schemes and Subsidies (PLI, State Policies)
18. Risk Assessment
- 18.1 Key Success Factors
- 18.2 Key Risk Factors
- 18.3 Risk Mitigation
19. Strategic Recommendations
20. Case Study of a Successful Venture
21. Appendix
- 21.1 Detailed Assumptions
- 21.2 Abbreviations
- 21.3 List of Tables and Figures
- 21.4 Sources
This page vs. the full report
| Data point | On this page (free) | In the full report |
|---|---|---|
| Total CapEx | One rounded range at one capacity | Exact figure at three capacities with a line-item breakup |
| CapEx breakup | Category shares (%) only | Cost, quantity and supplier for every machine |
| Operating cost | Share of raw materials, utilities and labor | Per-unit cost sheet with each input price and consumption |
| Profitability | Gross margin range and payback band | Exact IRR, NPV, ROI, break-even and DSCR |
| Financial statements | List of what is included | 10-year P&L, cash flow, balance sheet and Excel model |
| Sensitivity | One directional line | Full sensitivity and scenario tables |
| Process | Simplified flow diagram | Detailed process flow, mass and energy balance, operating conditions |
| Machinery | Names of the main machines | Specifications, capacity, cost and supplier list |
| Market | Headline size, growth and India demand trend | Segment, region, trade and price forecast tables |
| Suppliers and buyers | Supplier types and sourcing hubs | Named suppliers and buyers |
Pectin project report: FAQs
How much does it cost to set up a pectin plant?
What raw material does a pectin plant use?
What profit margin can a pectin plant earn?
Why is pectin made with alcohol?
Which licenses does a pectin plant need?
Where is pectin produced and who buys it?
Should a new pectin plant use fresh or dried peel?

About the analyst
Priyanka Mor, Senior Consultant
Senior Consultant at Credence Research Inc directing strategic market advisory, cross-border commercial due diligence and enterprise intelligence frameworks for global B2B clients. Combines quantitative modeling with executive advisory, translating macroeconomic variables and supply chain data into go-to-market blueprints, M&A screenings and competitive war-gaming strategies.
Related market research
- Food Hydrocolloids Market Size, Trends, Share and Forecast 2032
- Hydrocolloids Market Size, Share, Growth and Forecast 2032
- Sugar Beet Pectin Market Size, Share, Growth and Forecast 2032
- Citrus Fiber Market Size, Trends, Share and Forecast 2032
- Citrus Peel Extract Market Size, Growth and Forecast 2032
- Textural Food Ingredients Market Share, Growth and Forecast 2032
More plant project reports
- Shrimp Processing Plant Project Report (DPR) 2026
- Instant Coffee Manufacturing Plant Project Report (DPR) 2026
- Parboiled White Rice Processing Plant Project Report (DPR) 2026
- Potato Processing Plant Prefeasibility Report 2026
- Corn Starch Manufacturing Plant Project Report (DPR) 2026
- Cassava Starch Manufacturing Plant Project Report (DPR) 2026