
Market Overview
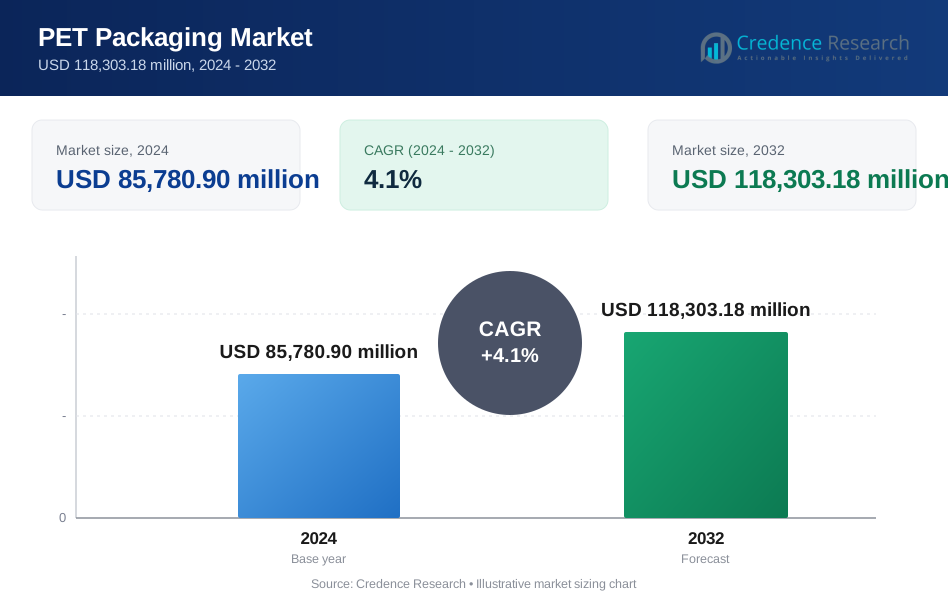
The PET Packaging Market was valued at USD 85,780.90 million in 2024 and is projected to reach USD 118,303.18 million by 2032, growing at a CAGR of 4.1% during the forecast period.
| REPORT ATTRIBUTE | DETAILS |
|---|---|
| Historical Period | 2020-2023 |
| Base Year | 2024 |
| Forecast Period | 2025-2032 |
| PET Packaging Market Size 2024 | USD 85,780.90 Million |
| PET Packaging Market, CAGR | 4.1% |
| PET Packaging Market Size 2032 | USD 118,303.18 Million |
The PET packaging market is led by key players such as Clondalkin Flexible Packaging, Huhtamaki, Berry Global, Constantia Flexibles, Novolex Holdings, Inc., Amcor, Schur Flexibles Group, Sonoco Products Company, Klöckner Pentaplast, and Gerresheimer. These companies focus on developing sustainable rPET solutions, lightweight bottles, and high-barrier packaging formats to meet growing demand from food, beverage, and pharmaceutical sectors. North America leads the market with 34% share, supported by strong consumption of bottled beverages and investment in recycling infrastructure. Europe holds 29% share, driven by strict EU packaging regulations, while Asia-Pacific captures 28% share and remains the fastest-growing region due to rising packaged food demand and cost-efficient PET production capabilities.
 Market Insights
- The PET packaging market was valued at USD 85,780.90 million in 2024 and is projected to reach USD 118,303.18 million by 2032, growing at a CAGR of 4.1% during the forecast period.
- Rising demand from food and beverage industries is the primary driver, with PET bottles and jars holding over 50% share due to their durability, transparency, and cost efficiency.
- Key trends include rapid adoption of recycled PET (rPET), lightweighting technologies, and bio-based PET solutions to meet global sustainability and circular economy targets.
- The market is competitive with players like Amcor, Berry Global, Huhtamaki, and Constantia Flexibles focusing on capacity expansion, partnerships, and innovation in high-barrier, tamper-evident packaging solutions.
- North America leads with 34% share, Europe follows with 29%, and Asia-Pacific holds 28% and is the fastest-growing region, while rigid packaging dominates the market with over 65% share driven by its strength and superior product protection.
Market Segmentation Analysis:
By Packaging Type
Rigid packaging dominated the PET packaging market in 2024, holding over 65% share, driven by high demand for bottles, jars, and trays across food, beverage, and pharmaceutical sectors. Its strength, clarity, and excellent barrier properties make it ideal for protecting perishable goods and liquids. Rigid PET formats are widely used for carbonated drinks, edible oils, and syrups, supporting extended shelf life and brand visibility. Flexible packaging is growing steadily, driven by demand for lightweight pouches and wraps that reduce material usage and transportation costs, aligning with sustainability goals and consumer convenience trends.
- For instance, in August 2025, Constantia Flexibles announced its expanded portfolio for FACHPACK 2025, with highlights including new lines of recyclable polyethylene (PE) and polypropylene (PP) mono-material pouches under its "Ecolutions" range.
By Product Type
Bottles and jars accounted for more than 50% share of the PET packaging market in 2024, supported by extensive use in beverages, dairy, and personal care products. Their shatter-resistance, recyclability, and design flexibility make them the preferred choice for high-volume packaging. Caps and closures follow as a critical segment ensuring product safety and leak prevention. Trays and clamshells are popular in ready-to-eat meals and fresh produce packaging, while bags and pouches are gaining traction due to their portability and reduced environmental footprint.
- For instance, in 2025, Novolex's Eco-Products division earned recognition for its innovations in compostable packaging, including a gold award for its compostable butter wrap and a Stevie award for its reusable foodservice containers. This reflects the company's broader sustainability strategy, which includes offering customers a range of solutions, such as products from its Waddington North America brand that use recycled PET.
By End-User Food and beverage dominated the end-user segment in 2024 with over 60% market share, driven by strong demand for packaged water, carbonated drinks, sauces, and ready meals. PET packaging’s ability to preserve freshness and provide tamper-evidence makes it the first choice for manufacturers. Pharmaceuticals are increasingly adopting PET bottles and jars for syrups and solid dosage forms due to their lightweight and compliant design. The personal care and cosmetics sector contributes significantly with demand for high-clarity PET bottles for shampoos, lotions, and creams. Other end-users include chemicals, automotive fluids, and household products.
Key Growth Drivers
Rising Demand from Food & Beverage Industry
The food and beverage industry drives over 60% of global PET packaging demand, making it the largest growth contributor. Rising consumption of bottled water, carbonated drinks, dairy products, and ready-to-eat meals fuels PET bottle and tray adoption. PET’s transparency, shatter-resistance, and lightweight properties make it ideal for safe, cost-effective transportation and improved shelf visibility. Increased focus on hygiene and convenience post-pandemic has further accelerated demand for single-serve and on-the-go packaging solutions, ensuring PET remains the preferred material across beverage and packaged food categories globally.
- For instance, Krones Group from Germany manufactures high-speed PET bottle filling and packaging systems capable of processing up to 48,000 bottles per hour, widely used in bottled water and carbonated soft drink production lines to ensure hygiene and rapid throughput.
Shift Toward Sustainable and Recyclable Packaging
Growing environmental awareness and stringent regulations on plastic waste are driving adoption of recyclable PET (rPET) and bio-based PET materials. Manufacturers are investing in closed-loop recycling systems and lightweight designs to meet circular economy goals. rPET reduces carbon footprint by up to 70% compared to virgin PET, aligning with global sustainability targets. Brands across beverages, pharmaceuticals, and personal care are adopting rPET bottles and containers to meet consumer demand for eco-friendly solutions and comply with government mandates, boosting overall PET packaging market penetration.
- For instance, Amcor provides rPET packaging and uses barrier technologies to ensure product quality. The company has shown a commitment to increasing renewable energy use across its operations and holds sustainability certifications.
Expansion of Pharmaceutical and Personal Care Sectors
Pharmaceutical and personal care industries are contributing significantly to PET packaging growth. Increasing production of syrups, nutraceuticals, and OTC medicines has boosted demand for PET bottles that offer high clarity and regulatory compliance. Similarly, the personal care sector uses PET containers for shampoos, lotions, and cosmetic products due to their design flexibility and premium appeal. Growth in e-commerce for beauty and healthcare products is further fueling demand for durable, lightweight PET packaging that can withstand long-distance shipping and preserve product integrity.
Key Trends & Opportunities
Adoption of Advanced Recycling Technologies
Chemical recycling and enhanced mechanical recycling processes are gaining traction, enabling production of near-virgin quality rPET. These technologies support higher inclusion rates of recycled content in bottles and containers, helping brands achieve sustainability targets. Packaging converters are partnering with recycling companies to secure feedstock and develop food-grade rPET solutions. This trend creates opportunities for innovation in closed-loop systems and premium rPET packaging for sensitive applications like pharmaceuticals and beverages where purity and performance are critical.
- For instance, revalyu Resources in Nashik, India operates a state-of-the-art chemical PET recycling facility with a combined production capacity of 280 tonnes per day of high-quality recycled PET chips, processing over 35 million post-consumer plastic bottles daily.
Innovation in Lightweight and Functional Packaging
Manufacturers are focusing on reducing resin usage by developing thinner, stronger PET bottles and films without compromising durability. Lightweighting lowers transportation costs and emissions, offering cost benefits for producers and end-users. Additionally, smart packaging features such as tamper-evidence, resealability, and UV protection are being integrated into PET packaging to enhance product safety and shelf life. These innovations are creating opportunities for companies to differentiate offerings and cater to premium, convenience-driven market segments.
- For instance, Amcor manufactures pharma-grade PET bottles with features like UV-blocking additives and tamper-evident closures, and uses production lines with high-speed capabilities. Production speeds of 15,000 units per hour are credible for large-scale operations.
Key Challenges
Fluctuating Raw Material Prices
Volatility in PET resin prices, driven by crude oil fluctuations and supply chain disruptions, creates cost pressure for manufacturers. Rising input costs often force producers to adjust pricing or absorb margin losses, impacting profitability. This challenge is especially critical for small and mid-sized converters competing with large players that benefit from economies of scale. To mitigate risks, companies are investing in recycling infrastructure and exploring alternative raw material sourcing strategies to stabilize production costs and maintain market competitiveness.
Stringent Environmental Regulations
Tightening global regulations on single-use plastics and packaging waste management are challenging PET packaging producers. Compliance with Extended Producer Responsibility (EPR) policies and recycling targets requires significant investment in infrastructure and product redesign. Failure to meet these requirements can result in penalties or restricted market access. Balancing regulatory compliance with cost efficiency and maintaining product performance is a complex challenge, particularly in emerging markets where recycling infrastructure is still developing.
Regional Analysis
North America
North America held 34% share of the PET packaging market in 2024, supported by strong demand from food, beverage, and pharmaceutical sectors. The U.S. leads the region, driven by high consumption of bottled water, soft drinks, and packaged food products. Adoption of recycled PET (rPET) is rising due to state-level recycling mandates and brand commitments to sustainability. Packaging manufacturers are investing in lightweighting technologies and closed-loop recycling systems to meet circular economy goals. Growth is also fueled by e-commerce expansion and demand for durable, tamper-evident PET containers for pharmaceuticals and personal care products.
Europe
Europe accounted for 29% share of the PET packaging market in 2024, led by Germany, France, and the U.K. The region is at the forefront of sustainability efforts, with stringent EU directives pushing higher recycled content in packaging. rPET bottles are widely used in beverages, dairy, and personal care segments to meet corporate and regulatory targets. Demand is also driven by growing consumption of ready-to-eat meals and on-the-go beverages. Innovation in bio-based PET and lightweight designs is accelerating, helping producers reduce carbon footprints while maintaining high-performance packaging across various industries.
Asia-Pacific
Asia-Pacific captured 28% share of the PET packaging market in 2024 and is the fastest-growing region globally. Growth is fueled by rising urbanization, expanding middle-class population, and increased consumption of packaged food and beverages in China, India, and Southeast Asia. The region is a major hub for PET production, benefiting from cost-effective manufacturing and large-scale capacity. Demand for PET bottles, pouches, and trays is increasing with the expansion of e-commerce, pharmaceuticals, and personal care industries. Government initiatives promoting recycling infrastructure and sustainability programs are further supporting the transition toward rPET adoption in packaging solutions.
Latin America
Latin America held 5% share of the PET packaging market in 2024, with Brazil and Mexico leading regional demand. Rising consumption of carbonated beverages, dairy products, and packaged food is driving PET bottle adoption. Growth is supported by expanding retail networks, urbanization, and foreign investment in local packaging production facilities. Regional players are gradually incorporating recycled PET into packaging to align with global sustainability standards. The pharmaceutical and personal care sectors are also contributing to PET demand as healthcare access improves and consumer preferences shift toward branded and safe packaging solutions.
Middle East & Africa
Middle East & Africa accounted for 4% share of the PET packaging market in 2024, driven by growing food and beverage production and import activities. GCC countries dominate demand due to higher per-capita beverage consumption and rapid retail expansion. Investments in local PET manufacturing capacity are supporting cost-efficient supply chains. In Africa, rising population and urbanization are boosting demand for affordable PET bottles and containers for water and essential consumer goods. Government-backed recycling programs and private sector partnerships are beginning to encourage rPET adoption, creating long-term opportunities for sustainable packaging solutions.
Market Segmentations:
By Packaging Type
- Rigid Packaging
- Flexible Packaging
By Product Type
- Bottles & Jars
- Caps & Closures
- Trays & Clamshells
- Bags & Pouches
By End-User
- Food & Beverage
- Pharmaceutical
- Personal Care & Cosmetics
- Others
By Geography
- North America
- U.S.
- Canada
- Mexico
- Europe
- Germany
- France
- U.K.
- Italy
- Spain
- Rest of Europe
- Asia Pacific
- China
- Japan
- India
- South Korea
- South-east Asia
- Rest of Asia Pacific
- Latin America
- Brazil
- Argentina
- Rest of Latin America
- Middle East & Africa
- GCC Countries
- South Africa
- Rest of the Middle East and Africa
Competitive Landscape
The competitive landscape of the PET packaging market is shaped by leading players such as Clondalkin Flexible Packaging, Huhtamaki, Berry Global, Constantia Flexibles, Novolex Holdings, Inc., Amcor, Schur Flexibles Group, Sonoco Products Company, Klöckner Pentaplast, and Gerresheimer. These companies focus on delivering innovative PET bottles, trays, and flexible packaging solutions that meet global food safety and sustainability standards. Key strategies include investing in rPET production, lightweighting technologies, and advanced recycling systems to reduce environmental impact. Partnerships with beverage and food brands help ensure a consistent supply of sustainable packaging. Many players are also expanding capacity in Asia-Pacific to serve growing demand from emerging markets. The competitive environment is further driven by product differentiation through tamper-evident designs, improved barrier properties, and smart labeling solutions. Continuous innovation and alignment with circular economy goals remain critical to strengthening market presence and gaining a competitive advantage.
Key Player Analysis
- Clondalkin Flexible Packaging
- Huhtamaki
- Berry Global
- Constantia Flexibles
- Novolex Holdings, Inc.
- Amcor
- Schur Flexibles Group
- Sonoco Products Company
- Klöckner Pentaplast
- Gerresheimer
Recent Developments
- In August 2025, Constantia Flexibles announced a major investment and expanded its product portfolio at FACHPACK 2025, reinforcing premium flexible packaging offerings.
- In May 2025, Amcor revealed its “Bottles of the Year 2025” packaging designs, emphasizing new PET-based bottle innovations for consumer health, beverage, and pharma applications.
- In 2025, Clondalkin Flexible Packaging (Bury site) launched a recycled shrink sleeve product made from PET for flexible packaging applications.
- In 2025, Gerresheimer AG introduced a web-based, audit-proof product database that includes documentation for its entire plastic primary packaging portfolio.
Report Coverage
The research report offers an in-depth analysis based on Packaging Type, Product Type, End-User and Geography. It details leading market players, providing an overview of their business, product offerings, investments, revenue streams, and key applications. Additionally, the report includes insights into the competitive environment, SWOT analysis, current market trends, as well as the primary drivers and constraints. Furthermore, it discusses various factors that have driven market expansion in recent years. The report also explores market dynamics, regulatory scenarios, and technological advancements that are shaping the industry. It assesses the impact of external factors and global economic changes on market growth. Lastly, it provides strategic recommendations for new entrants and established companies to navigate the complexities of the market.
Future Outlook
- Demand for PET packaging will grow with rising consumption of packaged food and beverages worldwide.
- Adoption of recycled PET (rPET) will increase as brands aim for higher recycled content targets.
- Bio-based PET production will expand to meet sustainability regulations and reduce carbon emissions.
- Lightweight PET packaging will become more common to cut material use and shipping costs.
- Smart packaging with tamper-evidence and traceability features will gain market traction.
- Asia-Pacific will remain the fastest-growing region driven by manufacturing capacity and urbanization.
- Pharmaceutical and personal care sectors will boost demand for high-clarity PET containers.
- Investment in advanced recycling infrastructure will support circular economy initiatives globally.
- Partnerships between PET manufacturers and food and beverage companies will strengthen supply chains.
- Innovation in multilayer PET with enhanced barrier properties will support longer shelf life for sensitive products.
Request a Free Sample
Fill in your details and we'll send you a free sample report.
- Sample data tables & charts
- Research methodology
Need a Custom Version of This Report?
Tailor the scope, geography, or segments to your exact requirements.
- Custom geography or segment scope
- Direct access to our analyst team
Frequently Asked Questions
What is the current market size for PET Packaging market, and what is its projected size in 2032?
At what Compound Annual Growth Rate is the PET Packaging market projected to grow between 2025 and 2032?
Which PET Packaging market segment held the largest share in 2024?
What are the primary factors fueling the growth of the PET Packaging market?
Who are the leading companies in the PET Packaging market?
Which region commanded the largest share of the PET Packaging market in 2024?
Table of Content
Chapter 1. Report Introduction
- 1.1 Report Description & Purpose
- 1.1.1 Report Title & Market Definition
- 1.1.2 Unique Selling Propositions (USP) & Key Differentiators
- 1.1.3 Value Proposition for Stakeholders
- 1.2 Research Objectives
- 1.2.1 Market Sizing Objectives (Volume & Revenue)
- 1.2.2 Segmentation Objectives
- 1.2.3 Competitive Intelligence Objectives
- 1.2.4 Forecast & Scenario Objectives
- 1.3 Report Scope
- 1.3.1 PET Packaging Scope – Types & Subtypes Covered
- 1.3.2 Geographic Scope – Regions & Countries Covered
- 1.3.3 Historical Period, Base Year & Forecast Period (2024; forecast to 2032)
- 1.3.4 Inclusions & Exclusions
- 1.4 HS Code & Classification Framework
- 1.5 Currency, Units & Pricing Basis
- 1.6 Target Stakeholders
- 1.7 Limitations & Assumptions
Chapter 2. Executive Summary
- 2.1 Global PET Packaging Market Snapshot
- 2.1.1 Market Size – Historical (2024) & Forecast (2024-2032) (2024: USD 85,780.90 million → 2032: USD 118,303.18 million)
- 2.1.2 Volume & Revenue – Global Totals
- 2.1.3 Key Market Highlights – Top Five Facts
- 2.2 PET Packaging Market Segmentation Snapshot
- 2.2.1 Market Split by Region – 2024 vs. 2032
- 2.3 Competitive Snapshot
- 2.3.1 Top 10 Players by Revenue Share – 2024
- 2.3.2 Top 10 Players by Volume Share – 2024
- 2.3.3 Recent Strategic Developments (18-Month Summary)
- 2.4 Key Investment Highlights & Strategic Conclusions
Chapter 3. PET Packaging Market Dynamics & Industry Analysis
- 3.1 Market Overview & Context
- 3.1.1 PET Packaging Market Position in the Broader Automotive Value Chain
- 3.1.2 OEM vs. Replacement Market Dynamics
- 3.1.3 Market Maturity & Development Stage by Region
- 3.2 PET Packaging Market Drivers
- 3.3 PET Packaging Market Restraints & Challenges
- 3.4 PET Packaging Market Opportunities
- 3.5 Porter's Five Forces Analysis
- 3.5.1 Threat of New Entrants
- 3.5.2 Bargaining Power of Suppliers
- 3.5.3 Bargaining Power of Buyers
- 3.5.4 Threat of Substitutes
- 3.5.5 Competitive Rivalry – Intensity Assessment
- 3.6 PET Packaging Value Chain Analysis
- 3.6.1 Upstream – Raw Material/Input Suppliers
- 3.6.1.1 Raw Material/Input 1
- 3.6.1.2 Raw Material/Input 2
- 3.6.1.3 Raw Material/Input 3
- 3.6.2 Midstream – Production/Manufacturing/Service Delivery
- 3.6.2.1 Production/Process Overview
- 3.6.2.2 Key Facility Locations & Capacity by Manufacturer
- 3.6.3 Downstream – Distribution & End Consumer
- 3.6.3.1 Primary Channel – B2B/OEM
- 3.6.3.2 Secondary Channels – Dealer, Retail, Online, Direct
- 3.6.4 Value Chain Profitability Analysis
- 3.6.1 Upstream – Raw Material/Input Suppliers
- 3.7 PESTEL Analysis
- 3.7.1 Political Factors
- 3.7.2 Economic Factors
- 3.7.3 Social Factors
- 3.7.4 Technological Factors
- 3.7.5 Environmental Factors
- 3.7.6 Legal Factors
- 3.8 PET Packaging Supply Chain Analysis
- 3.8.1 Raw Material/Input Supply Risk Assessment
- 3.8.2 Manufacturing Concentration Risk (Geographic Exposure)
- 3.8.3 Trade Disruption Impact Analysis
- 3.9 Regulatory & Policy Landscape
Note: The regulatory and policy landscape section covers regulations based on their applicability to the market, PET Packaging category, geography, and scope of the study. Only regulatory frameworks with a material impact on operations, compliance, trade, sustainability, or market access are analyzed in detail.
Chapter 4. Key Investment Pockets & Opportunity Analysis
- 4.1 PET Packaging Market Attractiveness Analysis
- 4.1.1 By Region – Investment Attractiveness Matrix (Volume × CAGR)
- 4.2 Absolute Revenue Growth Opportunity
- 4.2.1 By Region – Absolute USD Growth Through 2032
- 4.3 Incremental Volume Opportunity
- 4.3.1 By Region – Incremental Volume Through 2032
- 4.3.2 Segment – Incremental Volume
- 4.4 Emerging Submarket Opportunity Deep Dive (Subject to Applicability)
- 4.5 Emerging Market Opportunity Scorecards
- 4.5.1 United States
- 4.5.2 Europe
- 4.5.3 Asia
- 4.5.4 Middle East & Africa
Note: Emerging Market Opportunity Scorecards will be included based on relevance and strategic importance. Regions listed are indicative and may vary depending on data availability and market dynamics.
Chapter 5. PET Packaging Import-Export Analysis & Trade Flows
- 5.1 Global Trade Overview
- 5.1.1 Global Export Value by Country (2024)
- 5.1.2 Global Export Volume by Country (2024)
- 5.1.3 Global Import Value by Country (2024)
- 5.1.4 Global Import Volume by Country (2024)
- 5.1.5 Net Trade Balance by Country (2024)
- 5.2 Export Analysis – Segment
- 5.2.1 Type 1 (HS Code)
- 5.2.2 Type 2 (HS Code)
- 5.2.3 Type 3 (HS Code)
- 5.2.4 Type 4 (HS Code)
- 5.2.5 Type 5 (HS Code)
- 5.3 Import Analysis – Segment
- 5.3.1 Type 1 (HS Code)
- 5.3.2 Type 2 (HS Code)
- 5.3.3 Type 3 (HS Code)
- 5.3.4 Type 4 (HS Code)
- 5.3.5 Type 5 (HS Code)
- 5.4 Average Unit Trade Prices
- 5.4.1 Average Export Price – Segment & Country
- 5.4.2 Average Import Price – Segment & Source Country
- 5.4.3 Price Trends (2024)
- 5.5 Key Trade Route Analysis
- 5.5.1 Trade Route 1
- 5.5.2 Trade Route 2
- 5.5.3 Trade Route 3
- 5.5.4 Trade Route 4
- 5.5.5 Trade Route 5
- 5.6 Trade Policy Impact Assessment
- 5.6.1 US Anti-Dumping & Section 301 Tariffs
- 5.6.2 EU Customs Union Impact
- 5.6.3 Major Free Trade Agreements
- 5.6.4 USMCA Rules of Origin
Note: Trade policy analysis will be included only where relevant to the PET Packaging market.
Chapter 6. Competitive Landscape & Company Benchmarking
- 6.1 PET Packaging Market Concentration & Structure
- 6.1.1 Herfindahl-Hirschman Index (HHI) – vs. 2024
- 6.1.2 Tier 1, Tier 2 & Tier 3 Market Structure
- 6.1.3 Global, Regional & Local Player Dynamics
- 6.2 PET Packaging Market Share Analysis – 2024
- 6.2.1 Global Revenue Share by Company
- 6.2.2 Global Volume Share by Company
- 6.2.3 Regional Revenue Share
- 6.2.4 Market Share Evolution ( vs. 2024)
- 6.2.5 OEM Segment Share by Company
- 6.2.6 Replacement Segment Share by Company
- 6.3 Production/Delivery Capacity & Facility Analysis
- 6.3.1 Global Installed Capacity
- 6.3.2 Capacity Utilization Rates
- 6.3.3 Production/Output Volume
- 6.3.4 Facility Locations & Capacity Map
- 6.3.5 Planned Capacity Additions
- 6.4 PET Packaging Competitive Benchmarking Matrix
- 6.4.1 Revenue, Volume, CAGR & Profitability Comparison
- 6.4.2 Channel Revenue Mix
- 6.4.3 Geographic Revenue Exposure
- 6.4.4 R&D Intensity
- 6.4.5 Sustainability Maturity
- 6.5 Strategic Developments in PET Packaging (Last 24 Months)
- 6.5.1 Mergers, Acquisitions & Divestments
- 6.5.2 New PET Packaging Launches
- 6.5.3 Facility Expansions
- 6.5.4 Strategic Alliances, Joint Ventures & Partnerships
- 6.5.5 Distribution Expansion & Market Entry
- 6.5.6 Sustainability & ESG Initiatives
- 6.6 Competitive Strategy Mapping
- 6.6.1 Leader, Challenger, Follower & Niche Classification
- 6.6.2 Pricing Strategy Comparison
- 6.6.3 Channel Strategy Matrix
Note: Strategic developments are included based on their materiality and the availability of reliable information.
Chapter 7. Global PET Packaging Market – By Distribution Channel
- 7.1 Segment Overview
- 7.1.1 Volume & Revenue Split by Channel (2024 & 2032)
- 7.1.2 Channel Mix Evolution (2024-2032)
Chapter 8. Regional Market Analysis – Global Overview
- 8.1 Global Regional Overview
- 8.1.1 Regional Volume Share
- 8.1.2 Regional Revenue Share
- 8.1.3 Regional Volume by Region
- 8.1.4 Regional Revenue by Region
- 8.1.5 Regional Forecast Through 2032
- 8.2 Cross-Regional Segment Analysis
- 8.2.1 By Distribution Channel
- 8.2.2 By Brand/Price Tier
Chapter 9. North America PET Packaging Market
- 9.1 United States
- 9.2 Canada
- 9.3 Mexico
Chapter 10. Europe PET Packaging Market
- 10.1 Germany
- 10.2 France
- 10.3 Italy
- 10.4 United Kingdom
- 10.5 Spain
- 10.6 Poland
- 10.7 Russia
- 10.8 Netherlands
- 10.9 Belgium
- 10.10 Sweden
- 10.11 Denmark
- 10.12 Norway
- 10.13 Rest of Europe
Chapter 11. Asia Pacific PET Packaging Market
- 11.1 China
- 11.2 India
- 11.3 Japan
- 11.4 South Korea
- 11.5 Thailand
- 11.6 Indonesia
- 11.7 Vietnam
- 11.8 Malaysia
- 11.9 Australia
- 11.10 Rest of Asia Pacific
Chapter 12. Latin America PET Packaging Market
- 12.1 Brazil
- 12.2 Argentina
- 12.3 Colombia
- 12.4 Chile
- 12.5 Rest of Latin America
Chapter 13. Middle East PET Packaging Market
- 13.1 Saudi Arabia
- 13.2 United Arab Emirates
- 13.3 Turkey
- 13.4 Israel
- 13.5 Iran
- 13.6 Rest of the Middle East
Chapter 14. Africa PET Packaging Market
- 14.1 South Africa
- 14.2 Egypt
- 14.3 Nigeria
- 14.4 Morocco
- 14.5 Rest of Africa
Chapter 15. PET Packaging Company Profiles
- 15.1 [Company 01]
- 15.1.1 Company Overview
- 15.1.2 Key Management Personnel
- 15.1.3 Products & Services Portfolio
- 15.1.4 Financial Performance
- 15.1.5 Key Market Focus & Geographic Presence
- 15.1.6 Recent Developments & Strategic Initiatives
Note: The company profile list is preliminary and may change based on research findings, market developments, data availability, and client requirements.
Chapter 16. Appendices
- Appendix A – List of Abbreviations & Acronyms
- Appendix B – Industry Classification Code Reference – Full Series
- Appendix C – Production & Capacity Data Tables
- Appendix D – End-Use & Demand Base Tables
- Appendix E – Consumption & Replacement Rate Assumptions
- Appendix F – ASP Reference Tables
- Appendix G – Manufacturing & Facility Database
- Appendix H – Import-Export Data Tables
- Appendix I – Regulatory Summary Tables
- Appendix J – Primary Research Participant List (Anonymized)
- Appendix K – Primary Research Questionnaire Framework
- Appendix L – Data Sources & Bibliography
- Appendix M – Market Size Divergence & Source Comparison
Chapter 17. Research Methodology
- 17.1 Research Framework & Philosophy
- 17.2 Secondary Research – Sources, Hierarchy & Data Extraction
- 17.3 Data Modeling – Bottom-Up & Top-Down Market Sizing
- 17.4 Primary Research – Stakeholder Framework, LOI & Sample Sizes
- 17.5 Forecast Methodology – Regression, Scenario & Sensitivity Analysis
- 17.6 Quality Control – Four-Layer Validation Framework
- 17.7 Limitations & Standard Assumptions
- 17.8 Disclaimer
