
Quick answer
A rare earth magnet plant turns neodymium-praseodymium alloy into sintered magnets for electric vehicle motors, wind generators, robots and electronics. A 2,000 tonne per year greenfield plant outside China needs about USD 90–360 million of fixed CapEx, depending on site and scope. Gross margin usually runs 12–24%, and payback takes about 6–14 years without subsidies. Secure feedstock and long-term offtake matter more than equipment.
A strategic rather than quick-return project, viable with qualified feedstock, multi-year offtake and public support, and risky when competing on Chinese commodity prices.
Rare Earth Magnet plant: key highlights
| Parameter | Indicative value | Note |
|---|---|---|
| Plant capacity | 2,000 TPA finished magnets | Sintered NdFeB, alloy to coated parts, no oxide separation |
| Total CapEx | USD 90–360 million | Outside China, from disclosed plants; excludes working capital of about USD 30 million |
| Raw material share of operating cost | 72–82% | Pr-Nd metal is the largest item |
| Gross margin | 12–24% | At an assumed USD 70–85 per kg finished price |
| Payback period | 6–14 years | At 80% utilization, USD 90–170 million CapEx, before subsidies |
| IRR | Available in report | Post-tax, 10-year model |
| Break-even | Available in report | Capacity utilization basis |
Ranges assume a 2,000 TPA sintered NdFeB greenfield plant outside China, 2026 prices, 80% utilization, Pr-Nd metal near USD 130 per kg (July 2026 quote at an assumed 7.1 yuan per USD), an assumed finished price of USD 70–85 per kg, EUR 1 = USD 1.15 and 90 rupees per USD (both assumed). Benchmarks are disclosed plants scaled by tonnage. The full report is customizable to any country.
What is a rare earth magnet?
A rare earth magnet is a permanent magnet built on an alloy of rare earth elements with iron or cobalt. It stores far more magnetic energy per kilogram than ferrite or alnico, so a motor can be smaller and lighter for the same torque. Neodymium-iron-boron (NdFeB) dominates by volume, and samarium-cobalt (SmCo) serves high-temperature aerospace and defense niches.
Sintered NdFeB, the focus of this report, contains 28–35% rare earths by weight, with the rest mostly iron and about 1% boron. Grades run from N35 to N52 for strength, and suffixes such as H, SH and UH signal the heat resistance gained by adding dysprosium or terbium. Bonded magnets are a separate, lower-strength route. The Harmonized System classifies metal permanent magnets under HS 8505.11. Buyers include makers of electric vehicle traction motors, wind generators, industrial servo motors, air conditioner compressors, robots, speakers and medical imaging systems. Cheaper ceramic magnets compete where size and weight matter less.
Rare earth magnet market overview and global demand
Supply concentration, more than demand growth alone, explains the current investment wave. The International Energy Agency says China made 94% of the world's sintered magnets in 2024, up from about half in 2005, and held 91% of refined magnet rare earths. It also says magnet rare earth demand has doubled since 2015 and should grow by another third by 2030 under current policies. Existing capacity outside China covers well under a fifth of the agency's projected 2035 magnet demand there.
Chinese industry data put China's NdFeB output at about 330,000 tonnes in 2025, with an industry operating rate of 67.3% that December. That spare capacity is the core competitive threat to any new entrant. Chinese customs data show rare earth magnet exports of 48,055 tonnes in January–September 2026, up 20% from a year earlier, including 6,165 tonnes in September alone.
Credence Research values the upstream rare earth metals market at about USD 7.0 billion in 2025, based on its USD 6.38 billion for 2024 and a 9.8% CAGR. That figure covers metals rather than finished magnets, so it signals the input pool, not magnet sales. Pull comes from the electric vehicle traction motor market, direct-drive offshore wind and, increasingly, humanoid robots, which may use 2–4 kg of magnet per unit.
Policy now shapes trade as much as price does. China introduced licensing on magnets containing seven heavy rare earths in April 2025, the United States added a 25% Section 301 duty on Chinese permanent magnets from January 2026, and India launched a 72.8 billion rupee incentive scheme. Buyers outside China therefore increasingly pay for origin, not just performance.
Rare earth magnet manufacturing process
Sintered NdFeB production is a powder metallurgy route with one constant concern, oxygen. Fine alloy powder oxidizes rapidly and can ignite, while each extra fraction of a percent of oxygen weakens the finished magnet. Hence most of the line from milling to sintering runs under nitrogen, argon or vacuum.
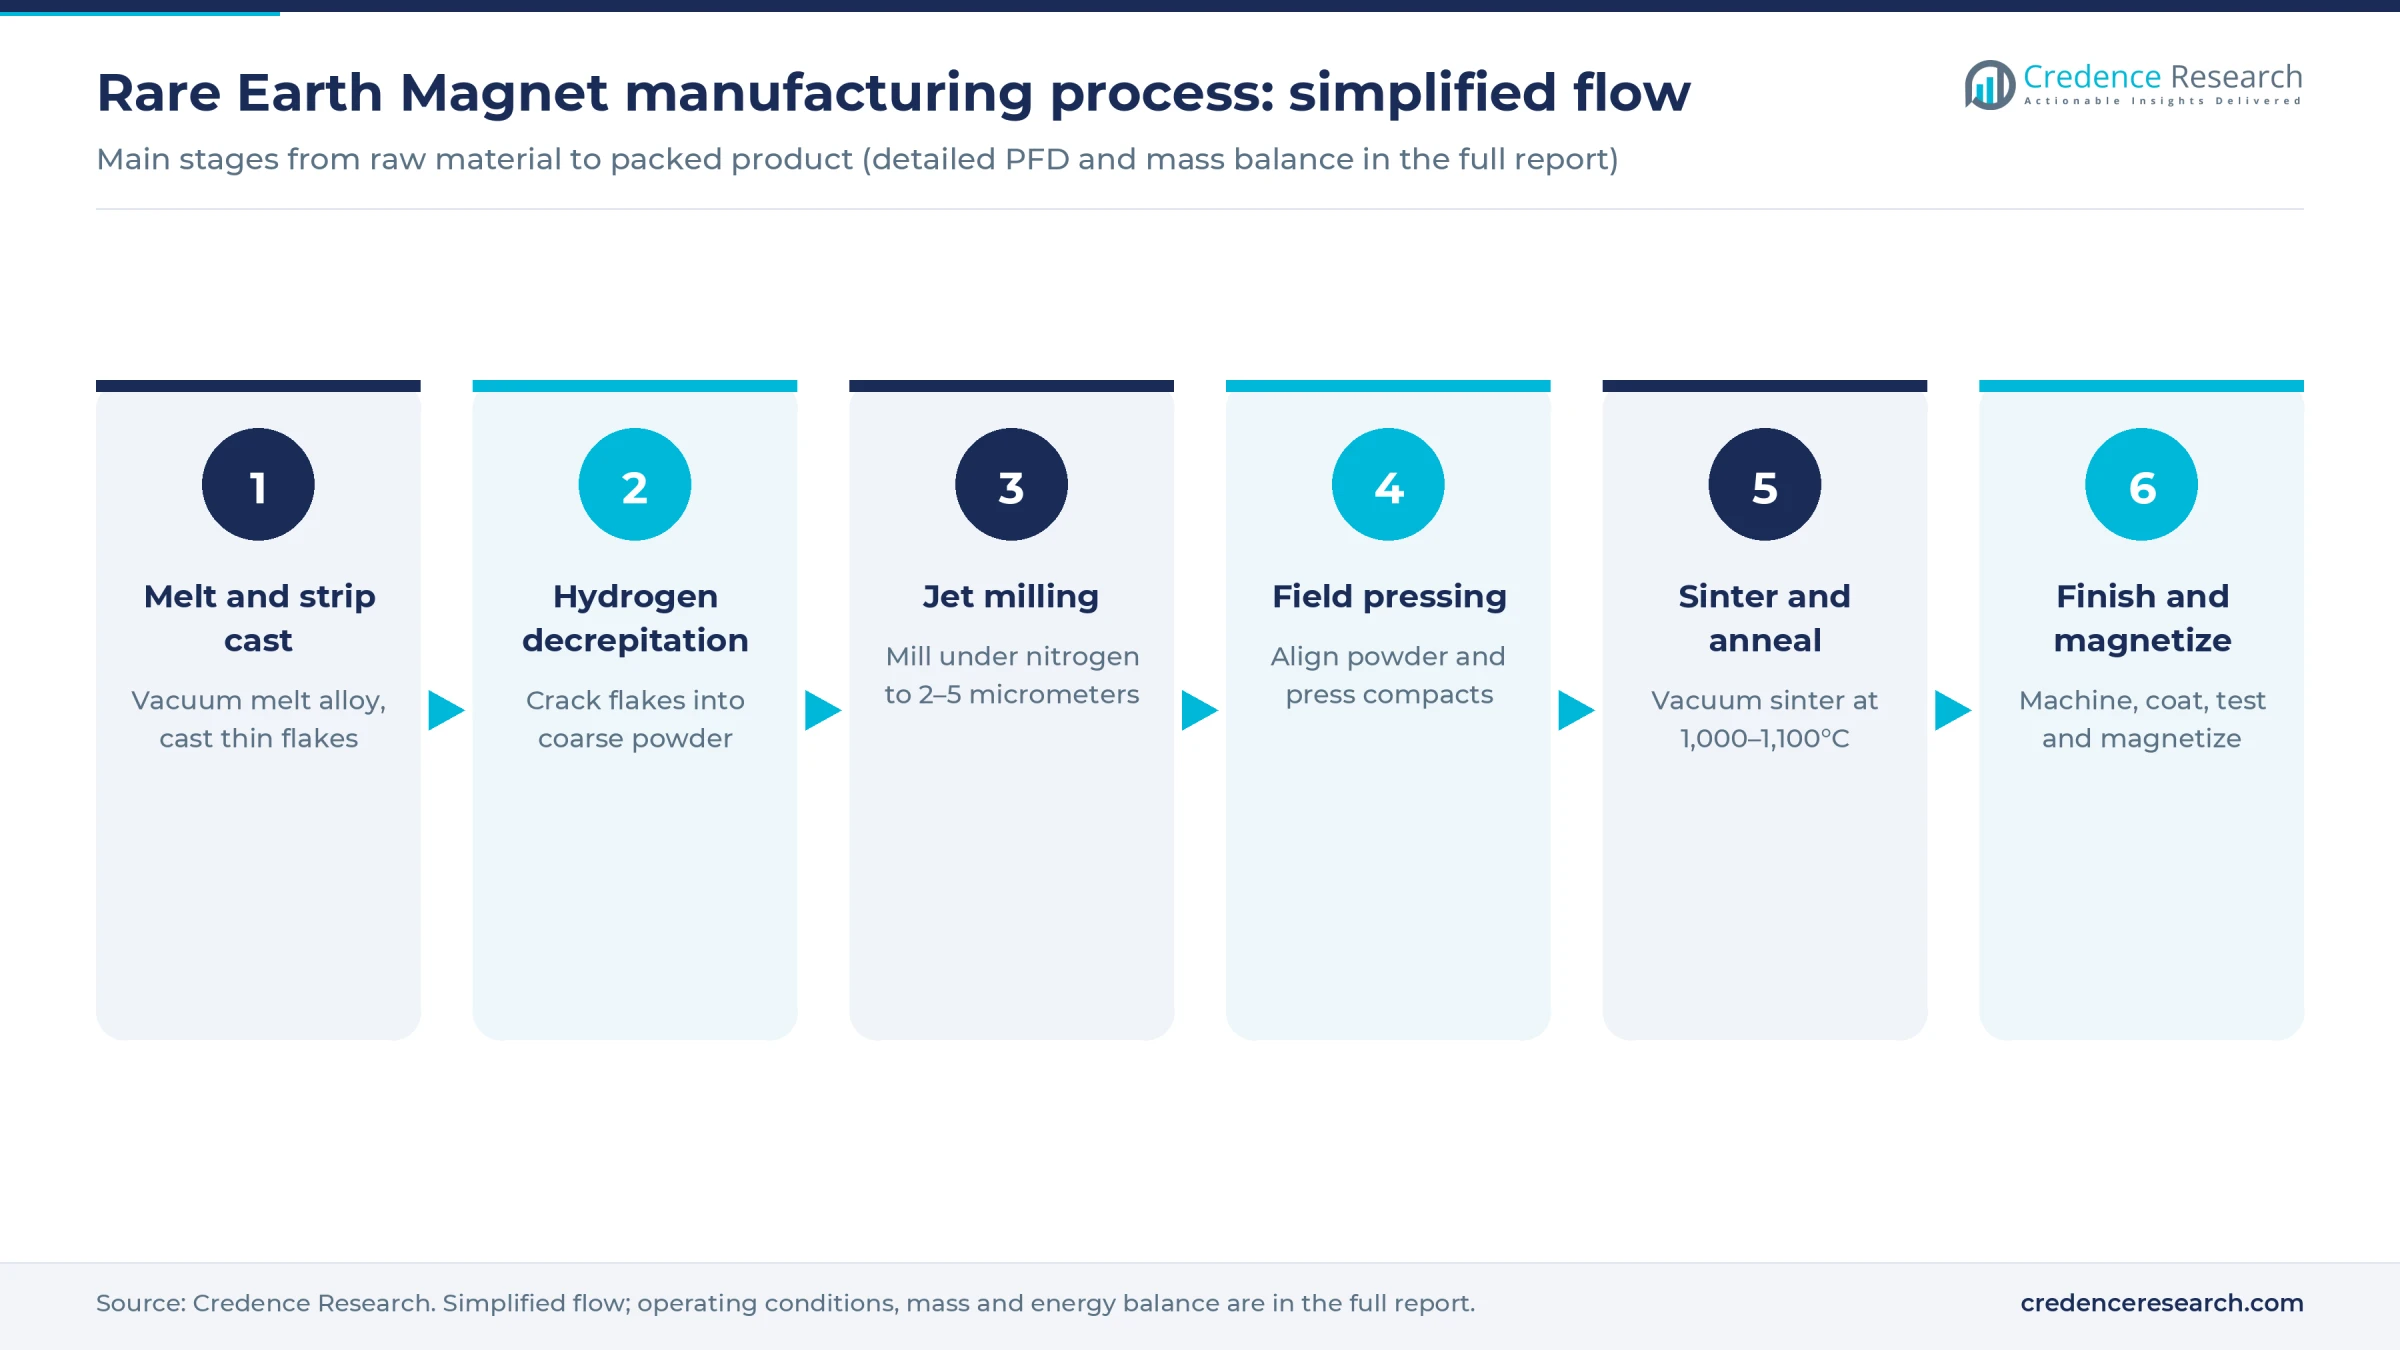
- Alloy melting and strip casting. Weighed Pr-Nd metal, iron, ferroboron and additives melt in a vacuum induction furnace, then cast onto a cooled copper wheel as flakes 200–400 micrometers thick. Fast cooling avoids free iron, which would damage magnetic properties.
- Hydrogen decrepitation. Flakes absorb hydrogen in a rotary furnace, swell and crack along grain boundaries into coarse powder. Heating then drives most hydrogen back out.
- Jet milling. High-speed nitrogen collides particles to a mean size of 2–5 micrometers. Each particle should be nearly a single crystal, which sets up the alignment step.
- Field pressing. Powder is aligned in a strong magnetic field and pressed into green compacts, often followed by cold isostatic pressing for density.
- Sintering and annealing. Compacts sinter in vacuum at 1,000–1,100°C and shrink to near full density, then anneal in two stages at 850–950°C and 400–600°C to develop coercivity.
- Machining, coating and magnetizing. Blanks are sliced, ground or wire cut to shape, plated with nickel or zinc or coated with epoxy, inspected and magnetized.
Grain boundary diffusion is now the key cost lever for high-temperature grades. Thin finished parts are coated with a dysprosium or terbium compound and heated so that the heavy rare earth stays at the grain edges. That achieves heat resistance with much less heavy rare earth than bulk alloying, although it works best on thin sections.
Machining is also where value leaks. Slicing and grinding can remove a fifth or more of the blank, assumed at 20–25% here, so swarf recycling and near-net pressing directly affect margins. Automotive buyers usually require months of sample approval and process freezes, so plants should expect a long commercial ramp.
Rare earth magnet plant setup cost
The indicative build is a 2,000 tonne per year plant that buys Pr-Nd metal and makes finished, coated magnets, without oxide separation. Fixed CapEx comes to about USD 90–360 million outside China, with working capital of about USD 30 million on top. The full report can recast the figures for any country.
The width of that range reflects what real projects disclose. Neo Performance Materials' Estonia plant cost about EUR 75 million for 2,000 tonnes, or roughly USD 43,000 a tonne, and sets the low end. MP Materials' planned Texas plant works out to about USD 180,000 a tonne at 7,000 tonnes, which gives USD 360 million at this capacity and sets the high end. Proterial's planned Indian plant, at about USD 210,000 a tonne, shows that smaller projects can cost more, although scopes differ and not all are disclosed. At the other extreme, Innuovo's Chinese blank expansion budgeted only about USD 12,000 a tonne, which shows the cost gap new entrants face.
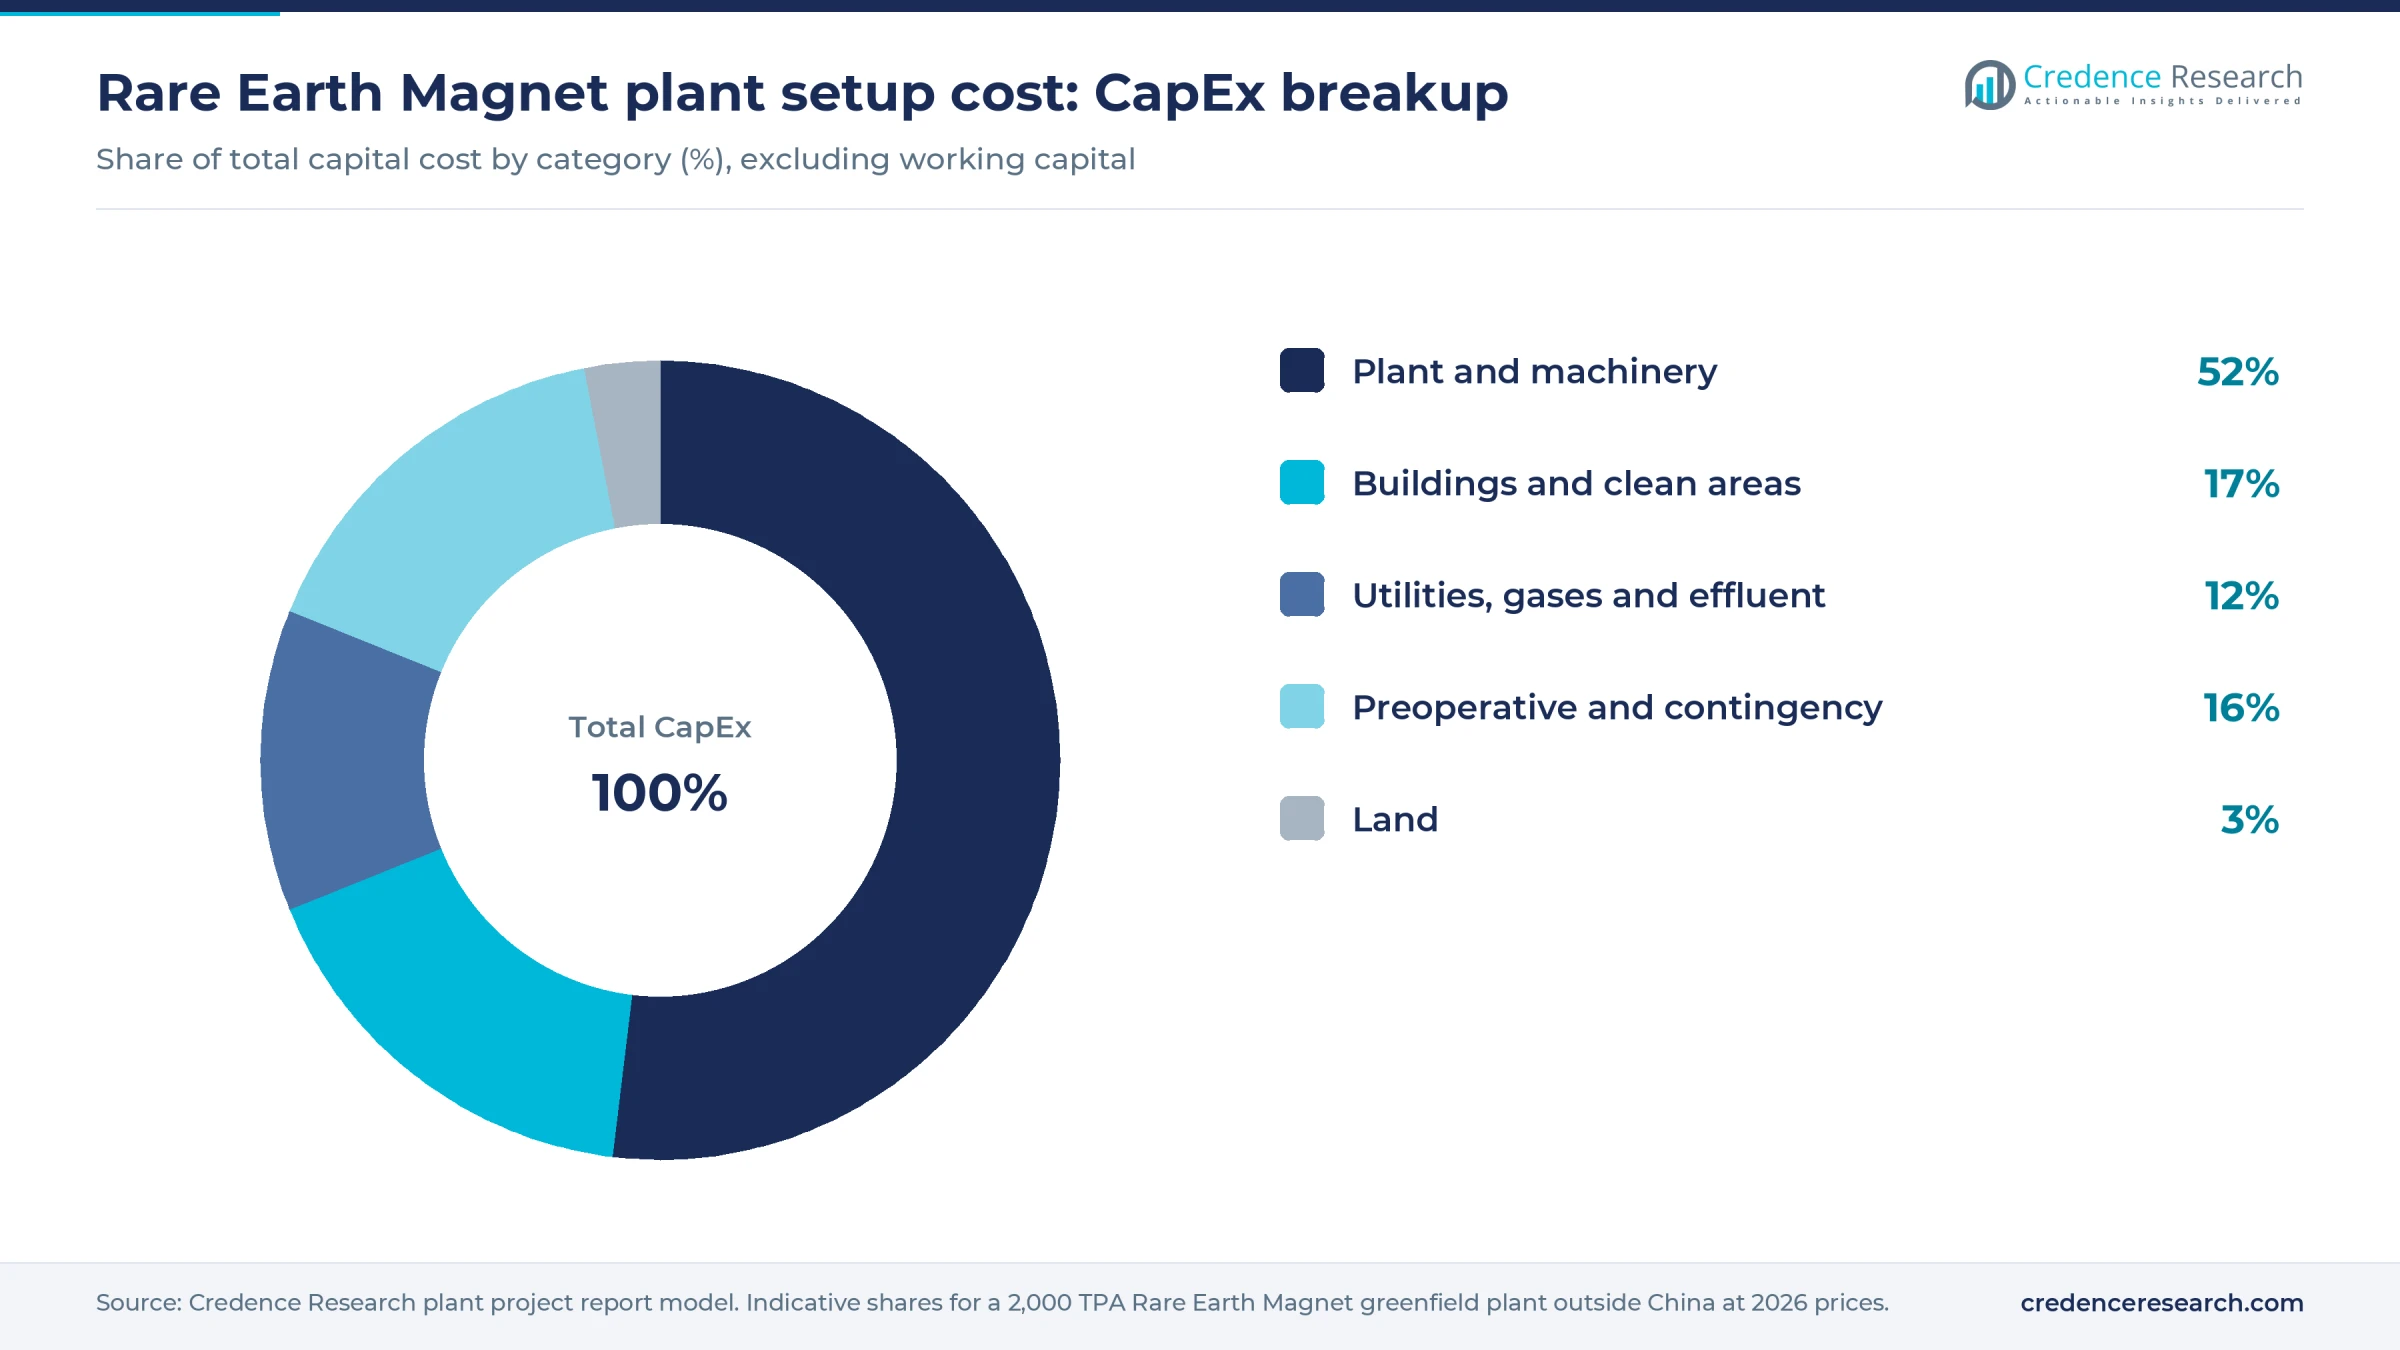
Land shows how a row is built. A 2,000 tonne plant might occupy about 15 acres, or 60,000 square meters. At an assumed USD 30–120 per square meter across Asian, East European and U.S. industrial parks, land costs USD 1.8–7.2 million, about 2–3% of CapEx. Land barely changes the investment decision here, unlike in most process industries.
Plant and machinery take about half of the budget, because furnaces, jet mills, inert-gas presses, machining and coating lines repeat across many parallel trains. Buildings carry a premium for dry, low-oxygen and clean areas. Utilities include nitrogen, argon, hydrogen handling, dust control and plating effluent treatment.
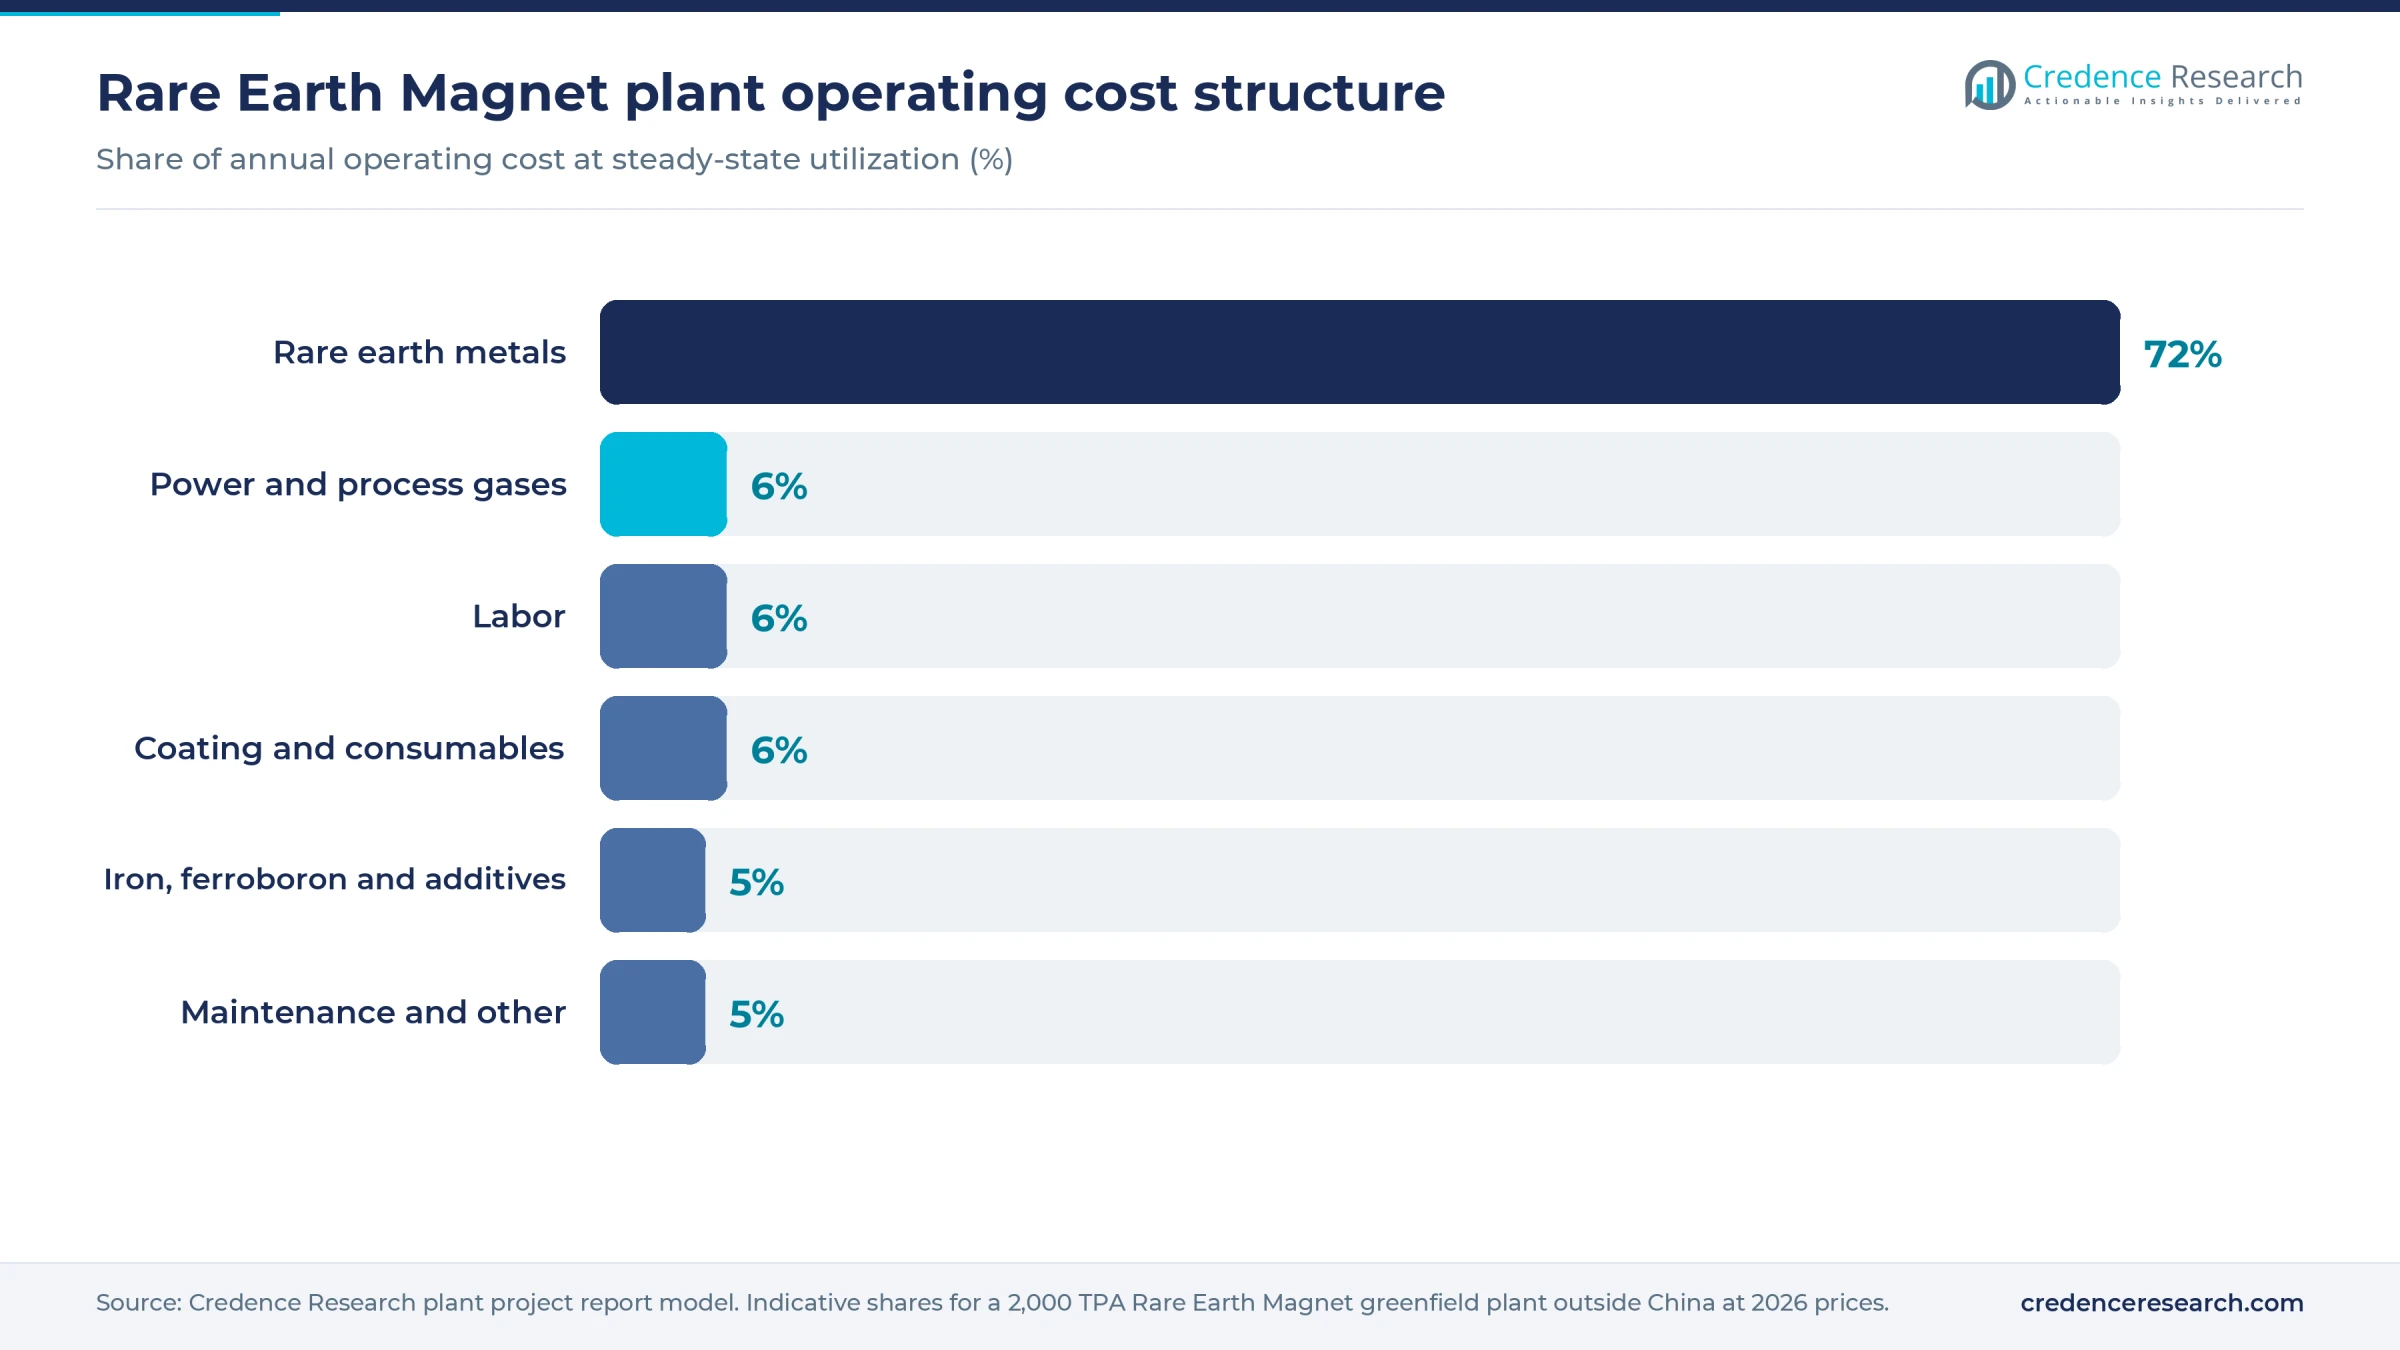
Operating cost is dominated by rare earths, which is why price risk sits at the center of every lender's review. A 10% move in Pr-Nd metal shifts unit cost by roughly 7%, and the effect on margin depends on how quickly contracts pass it through.
Machinery and raw materials for a rare earth magnet plant
Core equipment for a sintered NdFeB line includes the following items.
- Vacuum induction melting and strip casting furnaces
- Rotary hydrogen decrepitation furnaces and nitrogen jet mills
- Glove-box field presses and cold isostatic presses
- Vacuum sintering and aging furnaces, plus grain boundary diffusion coating and heat treatment
- Slicing machines, grinders, wire cutters and multi-wire saws
- Nickel, zinc or epoxy coating lines with effluent treatment
- Magnetizers and a lab with hysteresigraphs, oxygen analyzers and salt-spray testing
- Inert gas plant, hydrogen storage, chillers and combustible dust collection
Feedstock access decides whether a plant can run at all. The IEA puts China at 60% of mined magnet rare earths and 91% of refined output. Light Pr-Nd supply outside China comes from Australia and Malaysia, the United States and, in smaller quantities, Vietnam and Estonia. Dysprosium and terbium are tighter still, drawn largely from southern China and Myanmar, with new separation lines in Malaysia and Estonia. Recycled streams, tracked in the recovered rare earth chemicals market, offer a further route, which matters to defense buyers. Iron is widely available, ferroboron depends on boron from Turkey and the United States, and cobalt additive comes mainly from the Democratic Republic of Congo.
Rare earth magnet business profit margin and ROI
Magnet margins are a spread between rare earth input and contract price. Listed producer JL MAG reported gross margin of about 10% in 2024 and about 20% in 2025, and about 23% for the 12 months through June 2026. That broadly supports the 12–24% band.
The bottom-up calculation points the same way. Pr-Nd metal quoted at 910–920 yuan per kg in July 2026 is about USD 130 at an assumed 7.1 yuan. After machining loss and scrap credit, a kilogram of finished magnet uses about 0.33 kg of Pr-Nd, or USD 43, plus an assumed USD 6–9 of heavy rare earths and other alloy. Conversion, assumed at USD 10–14, brings cash cost to about USD 59–66 per kg. At an assumed USD 70–85 selling price, the matched margin is 12–24%. Chinese blank quotes of 212–222 yuan per kg for N38 and 357–377 yuan for 38UH in October 2026 show how much lower commodity pricing can sit, so plants need origin premiums to reach this band.
At 80% utilization, cash profit after overheads and tax is about USD 8–20 million a year, or USD 14–20 million in the upper half of the margin band. Against USD 120–200 million of fixed and working capital at USD 90–170 million of fixed CapEx, that upper band implies a payback of about 6–14 years. Weaker margins or CapEx near the top of the range push it past 15 years. India's scheme equals roughly USD 160 million per 1,200 tonne beneficiary if split evenly.
| Metric | Value |
|---|---|
| Project IRR (post-tax) | Available in report |
| NPV | Available in report |
| ROI | Available in report |
| DSCR | Available in report |
| Break-even utilization | Available in report |
How to start a rare earth magnet business, licenses and approvals
Every plant needs business and tax registration, land use and building permits, an environmental permit covering air emissions, plating wastewater and sludge, and occupational safety approval. Hydrogen storage and combustible metal powder usually draw specific fire and explosion reviews. Magnets rarely need a product license, so buyers set the real bar through automotive quality certification such as IATF 16949, material declarations and origin evidence. Export and import registration applies to traded feedstock and product.
| Market | Key approvals for rare earth magnets |
|---|---|
| United States | State air permit under the Clean Air Act; EPA hazardous waste rules (RCRA) and metal finishing pretreatment limits (40 CFR Part 433) for plating; OSHA hydrogen standard (29 CFR 1910.103). Defense sales must meet DFARS 252.225-7052, which from Jan. 1, 2027, excludes China, Russia, Iran and North Korea across the NdFeB supply chain, from mining onward. |
| European Union | National environmental permit, under the Industrial Emissions Directive 2010/75/EU where surface treatment thresholds are met; REACH obligations with ECHA for substances made or imported; ATEX Directive 1999/92/EC for explosive atmospheres; magnet labeling rules under Critical Raw Materials Act Regulation (EU) 2024/1252. |
| India | Consent to Establish and Consent to Operate from the State Pollution Control Board; hazardous waste authorization; factory registration; PESO approval for hydrogen storage; Ministry of Heavy Industries bid process for scheme incentives. |
Key rare earth magnet manufacturers and recent developments
China anchors the industry through JL MAG, Zhong Ke San Huan, Ningbo Yunsheng, Zhenghai Magnetic and Innuovo. Japan's Shin-Etsu Chemical, TDK and Proterial lead on advanced grades. Outside Asia, Vacuumschmelze's eVAC unit has been ramping toward 2,000 tonnes a year in South Carolina, Neo Performance Materials runs its Estonian plant, and MP Materials makes magnets in Texas. Arnold Magnetic Technologies serves SmCo and specialty buyers. Downstream demand from the wind turbine generator market supports long-term offtake.
- February 2026. MP Materials announced a USD 1.25 billion NdFeB plant in Texas of about 7,000 tonnes a year, with commissioning targeted for 2028.
- June 2026. USA Rare Earth announced a USD 1.2 billion site in Cherokee County, South Carolina, for 6,400 tonnes a year of magnets and 5,000 tonnes of metals and alloys, with commissioning expected in 2028.
- October 2026. Nexon Geochem unveiled a 12.5 billion rupee, 600 tonne a year sintered NdFeB plant in Andhra Pradesh, targeting first operations in April 2029, as Autocar Professional reported.
What's inside the Rare Earth Magnet project report PDF
The report runs to 21 chapters. Open a chapter to see its sections.
1. Preface
2. Scope and Methodology
- 2.1 Objectives of the Study
- 2.2 Stakeholders
- 2.3 Research Methodology
- 2.4 Data Sources and Key Assumptions
3. Executive Summary
- 3.1 Market Snapshot
- 3.2 Project at a Glance (Capacity, CapEx, OpEx)
- 3.3 Key Financial Indicators (IRR, NPV, Payback, Break-even)
- 3.4 Feasibility Verdict
4. Product Overview
- 4.1 Rare Earth Magnet Definition and Properties
- 4.2 Grades and Specifications (BIS / ISO / ASTM)
- 4.3 HS Code and Classification
- 4.4 Key Applications
- 4.5 Substitutes
5. Global Rare Earth Magnet Market
- 5.1 Market Overview
- 5.2 Historical and Current Market Performance (Volume and Value)
- 5.3 Market Breakup by Grade / Type
- 5.4 Market Breakup by End-Use Industry
- 5.5 Market Breakup by Region
- 5.6 Market Drivers, Restraints and Trends
- 5.7 Value Chain Analysis
- 5.8 Market Forecast
6. Target Country Rare Earth Magnet Market Analysis
- 6.1 Demand and Supply Analysis
- 6.2 Installed Capacity vs Demand Gap
- 6.3 Import Dependence
- 6.4 Demand Forecast by End-Use
7. Trade Analysis
- 7.1 Imports by Volume, Value and Country
- 7.2 Exports by Volume, Value and Country
- 7.3 Trade Balance and Opportunities
8. Price Analysis
- 8.1 Historical Rare Earth Magnet Price Trends by Region
- 8.2 Raw Material / Feedstock Price Trends and Linkage
- 8.3 Price Forecast
- 8.4 Margins Across the Value Chain
9. Competitive Landscape
- 9.1 Market Structure
- 9.2 Key Players and Installed Capacities
- 9.3 Profiles of Key Players
- 9.4 Recent Developments (Expansions, M&A, New Plants)
10. Manufacturing Process and Technology
- 10.1 Comparison of Technology Routes
- 10.2 Selected Route and Process Flow Diagram
- 10.3 Unit Operations Involved
- 10.4 Chemical Reactions Involved
- 10.5 Mass Balance and Raw Material Requirements
- 10.6 Energy Balance
- 10.7 Quality Assurance Criteria and Technical Tests
- 10.8 By-products and Waste Handling
- 10.9 Technology Licensors / Providers
11. Project Details, Requirements and Costs
- 11.1 Land, Location and Site Development
- 11.1.1 Site Selection Criteria
- 11.1.2 Location Analysis
- 11.1.3 Land Requirement and Costs
- 11.1.4 Site Development Costs
- 11.2 Plant Layout
- 11.2.1 Layout Principles
- 11.2.2 Proposed Layout
- 11.2.3 Factors Influencing Layout
- 11.3 Civil Works and Buildings
- 11.4 Plant Machinery
- 11.4.1 Machinery Requirements and Specifications
- 11.4.2 Machinery Costs
- 11.4.3 Machinery Suppliers
- 11.5 Raw Materials
- 11.5.1 Requirements per Tonne of Output
- 11.5.2 Procurement and Sourcing
- 11.5.3 Costs
- 11.5.4 Suppliers
- 11.6 Packaging
- 11.6.1 Packaging Requirements
- 11.6.2 Packaging Costs
- 11.6.3 Packaging Suppliers
- 11.7 Storage and Material Handling
- 11.8 Transportation Requirements and Costs
- 11.9 Utilities
- 11.9.1 Power Requirements and Costs
- 11.9.2 Water Requirements and Costs
- 11.9.3 Steam, Fuel and Other Utilities
- 11.10 Manpower Requirements and Wages
12. Environment, Health, Safety and Sustainability
- 12.1 Effluent and Emissions Management
- 12.2 Hazard Classification and Safety Measures
- 12.3 Carbon Footprint
- 12.4 Green / Low-Carbon Process Options
13. Regulatory Procedures, Approvals and Certifications
- 13.1 Licences and Registrations
- 13.2 Environmental Clearances
- 13.3 Product Certifications (BIS, REACH, etc.)
- 13.4 Approval Timeline
14. Project Implementation Schedule
15. Project Economics
- 15.1 Capital Cost of the Project
- 15.2 Techno-Economic Parameters
- 15.3 Capacity Utilization and Ramp-up
- 15.4 Product Pricing and Margins
- 15.5 Income Projections
- 15.6 Expenditure Projections
- 15.7 Working Capital Requirement
- 15.8 Taxation
- 15.9 Depreciation
16. Financial Analysis
- 16.1 Projected Profit and Loss Account
- 16.2 Projected Cash Flow Statement
- 16.3 Projected Balance Sheet
- 16.4 Liquidity Analysis
- 16.5 Profitability Analysis (Payback, NPV, IRR, ROI)
- 16.6 Break-even Analysis
- 16.7 Debt Service Coverage Ratio (DSCR)
- 16.8 Sensitivity Analysis
- 16.9 Scenario and Uncertainty Analysis
17. Funding and Incentives
- 17.1 Means of Finance and Debt-Equity Structure
- 17.2 Loans and Financial Assistance
- 17.3 Government Schemes and Subsidies (PLI, State Policies)
18. Risk Assessment
- 18.1 Key Success Factors
- 18.2 Key Risk Factors
- 18.3 Risk Mitigation
19. Strategic Recommendations
20. Case Study of a Successful Venture
21. Appendix
- 21.1 Detailed Assumptions
- 21.2 Abbreviations
- 21.3 List of Tables and Figures
- 21.4 Sources
This page vs. the full report
| Data point | On this page (free) | In the full report |
|---|---|---|
| Total CapEx | One rounded range at one capacity | Exact figure at three capacities with a line-item breakup |
| CapEx breakup | Category shares (%) only | Cost, quantity and supplier for every machine |
| Operating cost | Share of raw materials, utilities and labor | Per-unit cost sheet with each input price and consumption |
| Profitability | Gross margin range and payback band | Exact IRR, NPV, ROI, break-even and DSCR |
| Financial statements | List of what is included | 10-year P&L, cash flow, balance sheet and Excel model |
| Sensitivity | One directional line | Full sensitivity and scenario tables |
| Process | Simplified flow diagram | Detailed process flow, mass and energy balance, operating conditions |
| Machinery | Names of the main machines | Specifications, capacity, cost and supplier list |
| Market | Headline size, growth and India demand trend | Segment, region, trade and price forecast tables |
| Suppliers and buyers | Supplier types and sourcing hubs | Named suppliers and buyers |
Rare Earth Magnet project report: FAQs
How much does it cost to set up a rare earth magnet plant?
What raw materials does a rare earth magnet plant need?
What is the profit margin in rare earth magnet manufacturing?
What is the payback period for a rare earth magnet plant?
Which licenses does a rare earth magnet plant need?
Why are so many magnet plants being built outside China?
Should a new plant make heavy rare earth grades?

About the analyst
Nisha Gupta, Senior Research Analyst
Nisha Gupta is a Senior Research Analyst at Credence Research Inc. who works across industry domains, including packaging, automotive parts and machinery. Her focus is the modelling engine behind each study: she builds quantitative market databases and econometric forecasting frameworks, and developed automated Excel-based market modelling templates that cut client turnaround time by 30%.
Related market research
- Rare Earth Metals Market Size, Share & Growth Report 2032
- Electric Vehicle Traction Motor Market Size, Share and Forecast 2032
- Wind Turbine Generator Market Size, Growth and Forecast 2032
- Ceramic Magnets Market Size, Share and Growth Report 2032
- Recovered Rare Earth Element Chemicals Market Size and Forecast 2032
- Magnetic Bearing Market Size, Trends, Share & Forecast 2032
More plant project reports
- Shrimp Processing Plant Project Report (DPR) 2026
- Instant Coffee Manufacturing Plant Project Report (DPR) 2026
- LED Light Manufacturing Plant Project Report (DPR) 2026
- PET Bottle Manufacturing Plant Project Report (DPR) 2026
- Pectin Manufacturing Plant Project Report (DPR) 2026
- Paper Cups Manufacturing Plant Project Report (DPR) 2026