
Quick answer
An LED light assembly plant making about 5 million bulbs, battens and downlights a year, with in-house SMT, aging and photometric testing, needs total CapEx of roughly USD 1.2–2.0 million in an Asian industrial park, including land and working capital margin. Gross margin typically runs 15–22% of ex-factory price, and payback falls in a 3.5–6 year band at 65–75% utilization, longer if commodity bulbs dominate the mix.
Feasible for entrants with an OEM contract, a regional brand or a battens and downlights mix; a plant selling only commodity bulbs competes with Chinese export prices and thin margins.
LED Light plant: key highlights
| Parameter | Indicative value | Note |
|---|---|---|
| Plant capacity | 5 million units per year | About 16,700 units a day, two shifts, 300 working days |
| Total CapEx | USD 1.2–2.0 million | Asian industrial park; land, shed, SMT, assembly, lab, working capital margin |
| Raw material share of operating cost | 80–86% | LED packages, driver parts, housings, aluminum, optics |
| Gross margin | 15–22% | On ex-factory price after components and direct conversion |
| Payback period | 3.5–6 years | At 65–75% utilization from year two, including ramp-up |
| IRR | Available in report | Post-tax, 10-year model |
| Break-even | Available in report | Capacity utilization basis |
Ranges assume a 5 million units a year plant (about 70% bulbs, 30% battens and downlights) on 2,500 sq m in an Asian industrial park, a 1,500 sq m shed, bought-in housings and driver parts, one SMT line, 2026 prices, 65–75% utilization from year two, assumed land and building rates and assumed blended ex-factory prices of USD 0.80–1.25 per unit. U.S. or EU sites cost more. The full report can be customized to any country.
What is an LED light?
An LED light is a solid-state light source in which semiconductor chips emit light when current passes through them, usually blue chips coated with phosphor to produce white light. The finished product combines LED packages on a metal-core circuit board, a driver that converts mains power to constant current, a heat sink or housing, and a diffuser or optic. Because there is no filament or mercury, efficacy and service life depend mainly on thermal design and driver quality.
Product forms split into retrofit lamps such as A-shape bulbs and tubes, and integrated luminaires such as battens, downlights, panels, high bays, floodlights and streetlights. Grades follow wattage, lumens per watt, color temperature, color rendering, surge rating and smart control. Internationally, LED lamps fall under HS subheading 8539.52, LED modules under 8539.51 and many LED luminaires under heading 9405, so a plant's product mix decides its customs lines. Buyers include households, retailers, electrical distributors, building contractors, utilities and public lighting programs, and brand owners that outsource production to contract makers.
LED light market overview and global demand
Credence Research puts the world market at USD 89.5 billion in 2024, rising at an 11.1% CAGR to about USD 207.8 billion by 2032 in its global market sizing study. That implies about USD 99.5 billion in 2025, a value derived from the 2024 figure and the CAGR rather than a separately reported number. New plants also weigh the wider luminaires market alongside lamps.
Demand is shifting from first conversion to replacement and upgrades. The International Energy Agency said in 2026 that LEDs hold more than 85% of lighting sales in China and more than 75% in India, with Africa, Southeast Asia and Latin America at 50–85%. It also estimates that about 30% of residential lamps worldwide have not been upgraded, and nearly 15% are early-generation LEDs nearing end of life. Minimum efficiency standards cover about 110 countries, and the Minamata Convention on Mercury is pushing fluorescent lamps out of the market.
China dominates world supply, and a Global Lighting Forum summary of China Association of Lighting Industry data shows it exported about USD 11.4 billion of lighting products in the first quarter of 2026, down 3.5% year on year, including about 4.6 billion LED light sources. Shipments to the United States fell 22% to about USD 2.3 billion, while Europe rose 8% to about USD 3.1 billion and Africa rose 13%. Those shifts, along with tariffs, give assembly outside China a clearer case. Efficacy keeps rising too, with average LEDs sold today near 100 lumens per watt and the best products near 230, so model ranges age quickly.
LED light manufacturing process
Few mid-size plants make their own LED chips, since wafer and chip fabrication is a far larger investment. A typical plant buys packaged LEDs and components, then adds value through surface mount assembly, final assembly, aging and photometric testing. Entry-level units skip SMT altogether and screw together bought-in boards, which is cheap but leaves little margin and no control over quality.
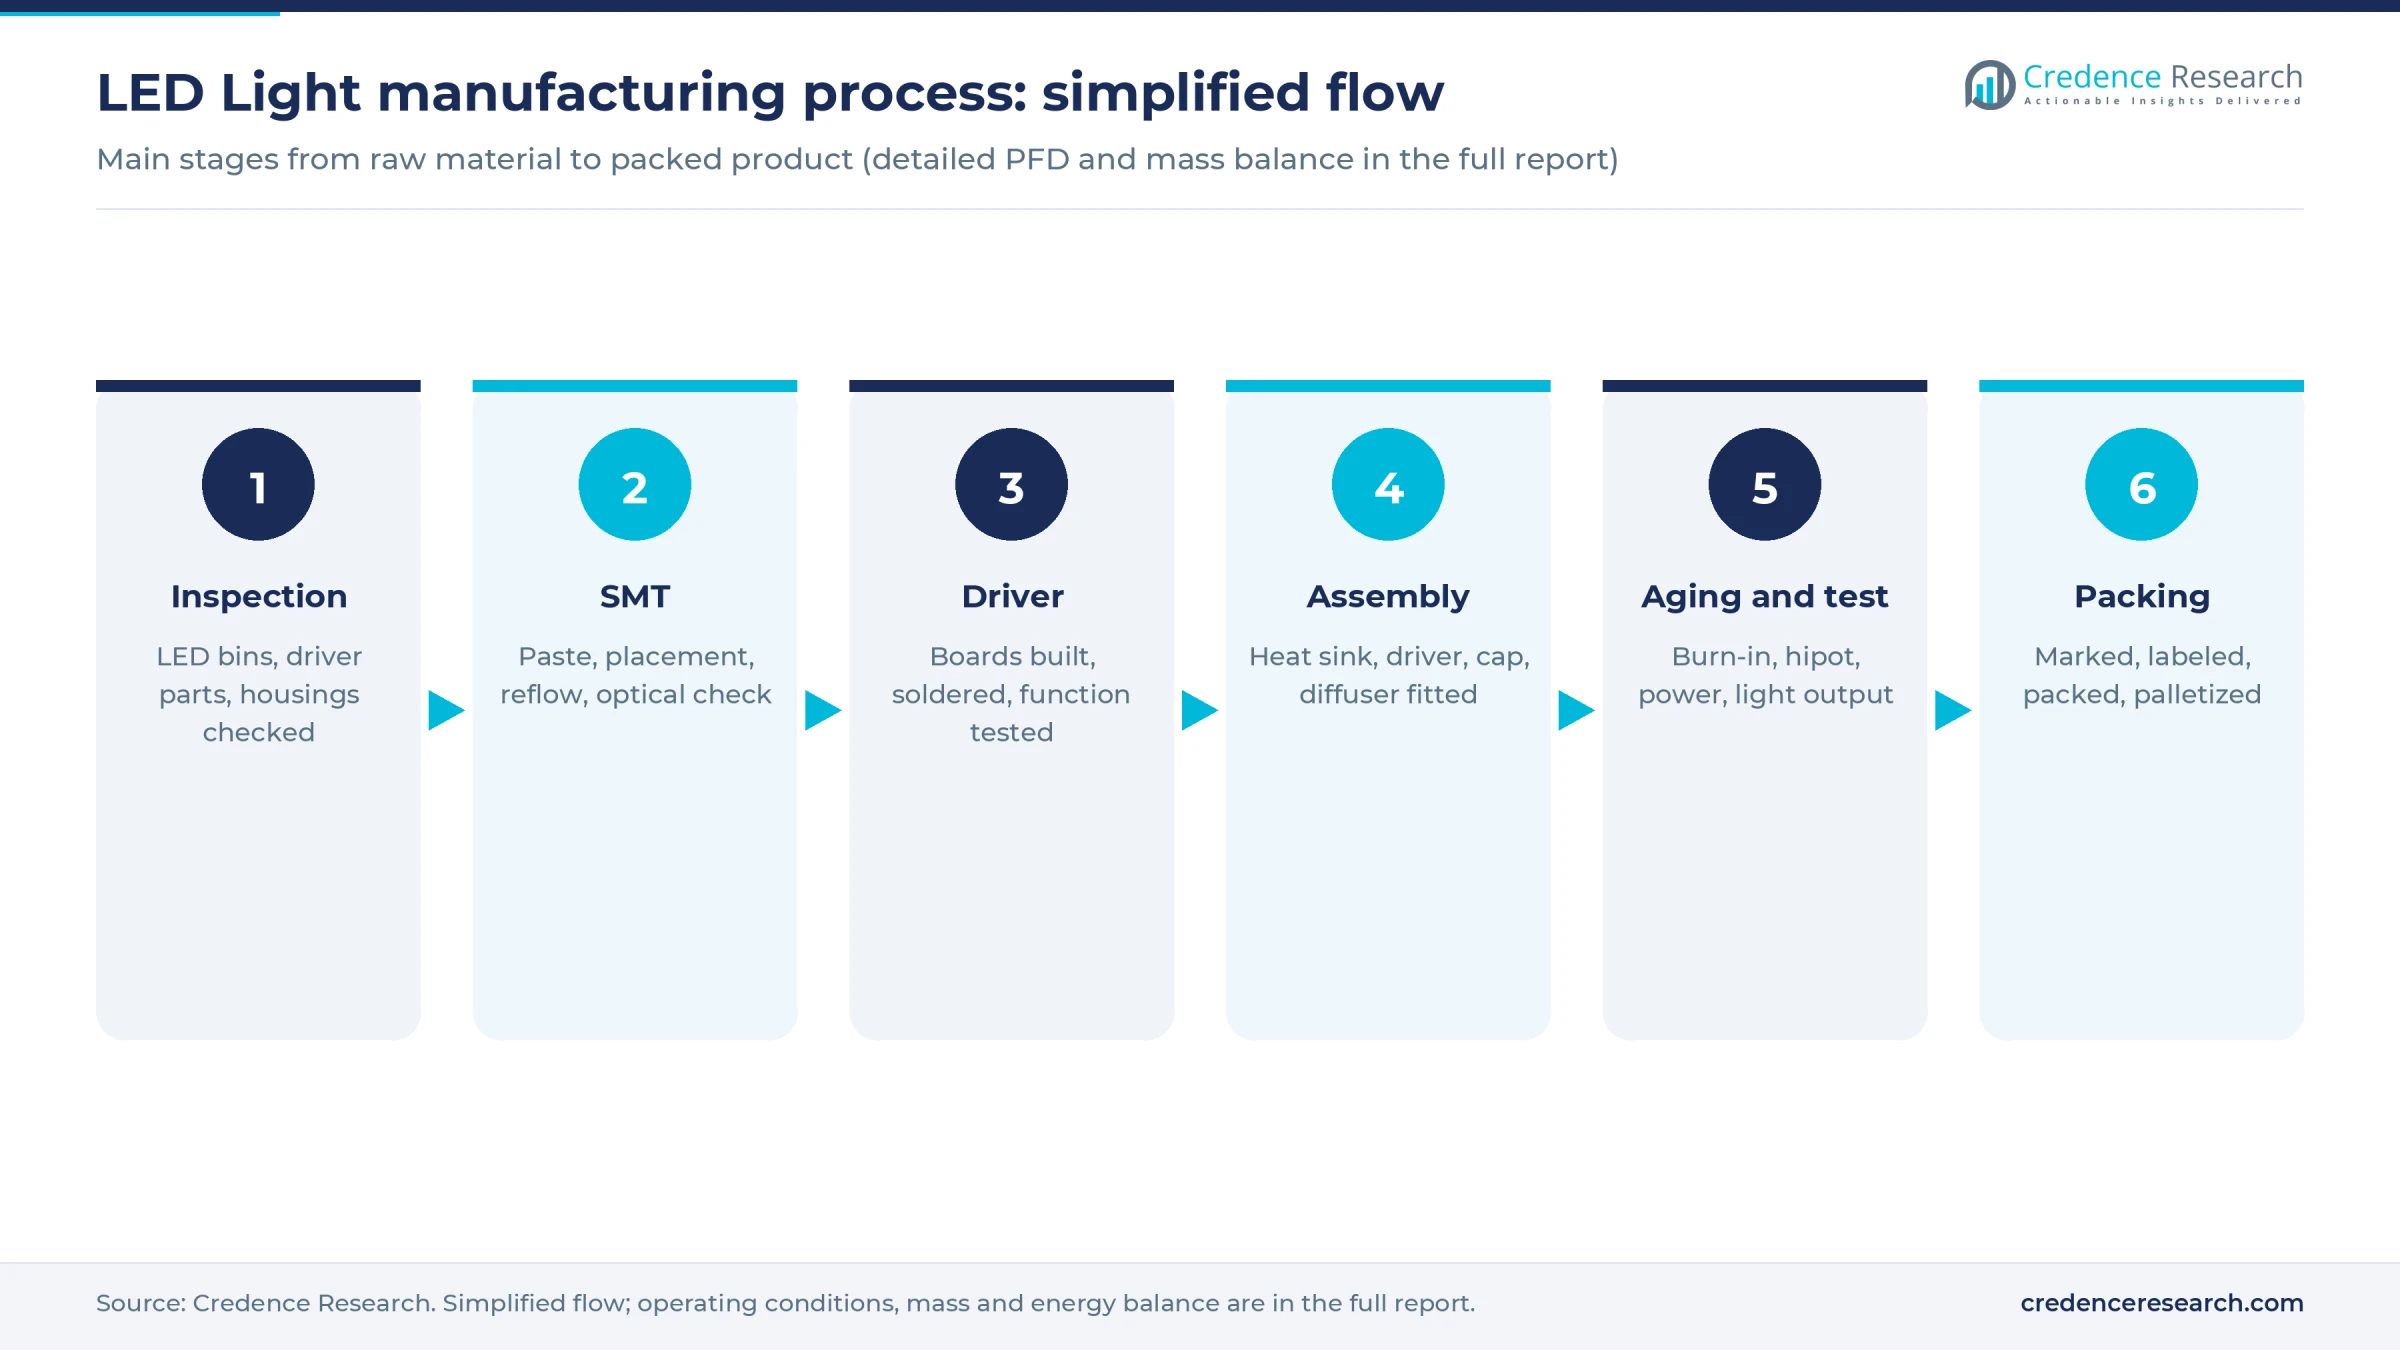
- Incoming inspection. LED packages are checked for color bin, forward voltage and flux, while driver parts, aluminum heat sinks, diffusers and caps are checked against drawings. Moisture-sensitive LEDs stay in dry storage until use.
- Surface mount assembly. A stencil printer applies solder paste to metal-core boards, pick-and-place machines set the LEDs, and a reflow oven fixes them. Automated optical inspection catches misplaced or tilted parts before they reach assembly.
- Driver assembly. Driver boards are populated by SMT and insertion, wave or selective soldered and function tested. Surge protection and capacitor choice largely set field life, so this step accounts for many warranty differences between makers.
- Final assembly. Thermal paste or adhesive joins the LED board to the heat sink, the driver is connected and potted where needed, and caps or end fittings are crimped or riveted. Diffusers are then fixed by snap fit or adhesive.
- Aging and testing. Units run for several hours on burn-in racks, then pass high-voltage, power-factor and light-output checks. Samples go through an integrating sphere, surge and thermal tests, with longer lumen maintenance tests to support the rated life on the label.
- Packing. Products are laser marked or printed with ratings, then packed with the energy label, safety mark and barcode, and palletized for dispatch.
Yield is lost mainly in soldering faults, mixed color bins and driver failures at aging, so first-pass test results are the plant's most useful daily number. A failed lamp at the distributor costs far more than one caught on the rack.
LED light plant setup cost
For a plant rated at 5 million units a year, about 16,700 a day on two shifts, total project cost lands at roughly USD 1.2–2.0 million in an Asian industrial park, the cost region used for this range. The spread mainly reflects land and how much of the SMT line is bought new. The full report can be customized to any country, and U.S. or EU sites can reach two to three times this figure (assumed).
Land shows how the build works. A plant of this size needs about 2,500 sq m for the shed, stores and truck access. At an assumed USD 30–70 per sq m for an estate with good road links, land costs about USD 75,000–175,000. Leased plots avoid that cost and raise annual rent instead.
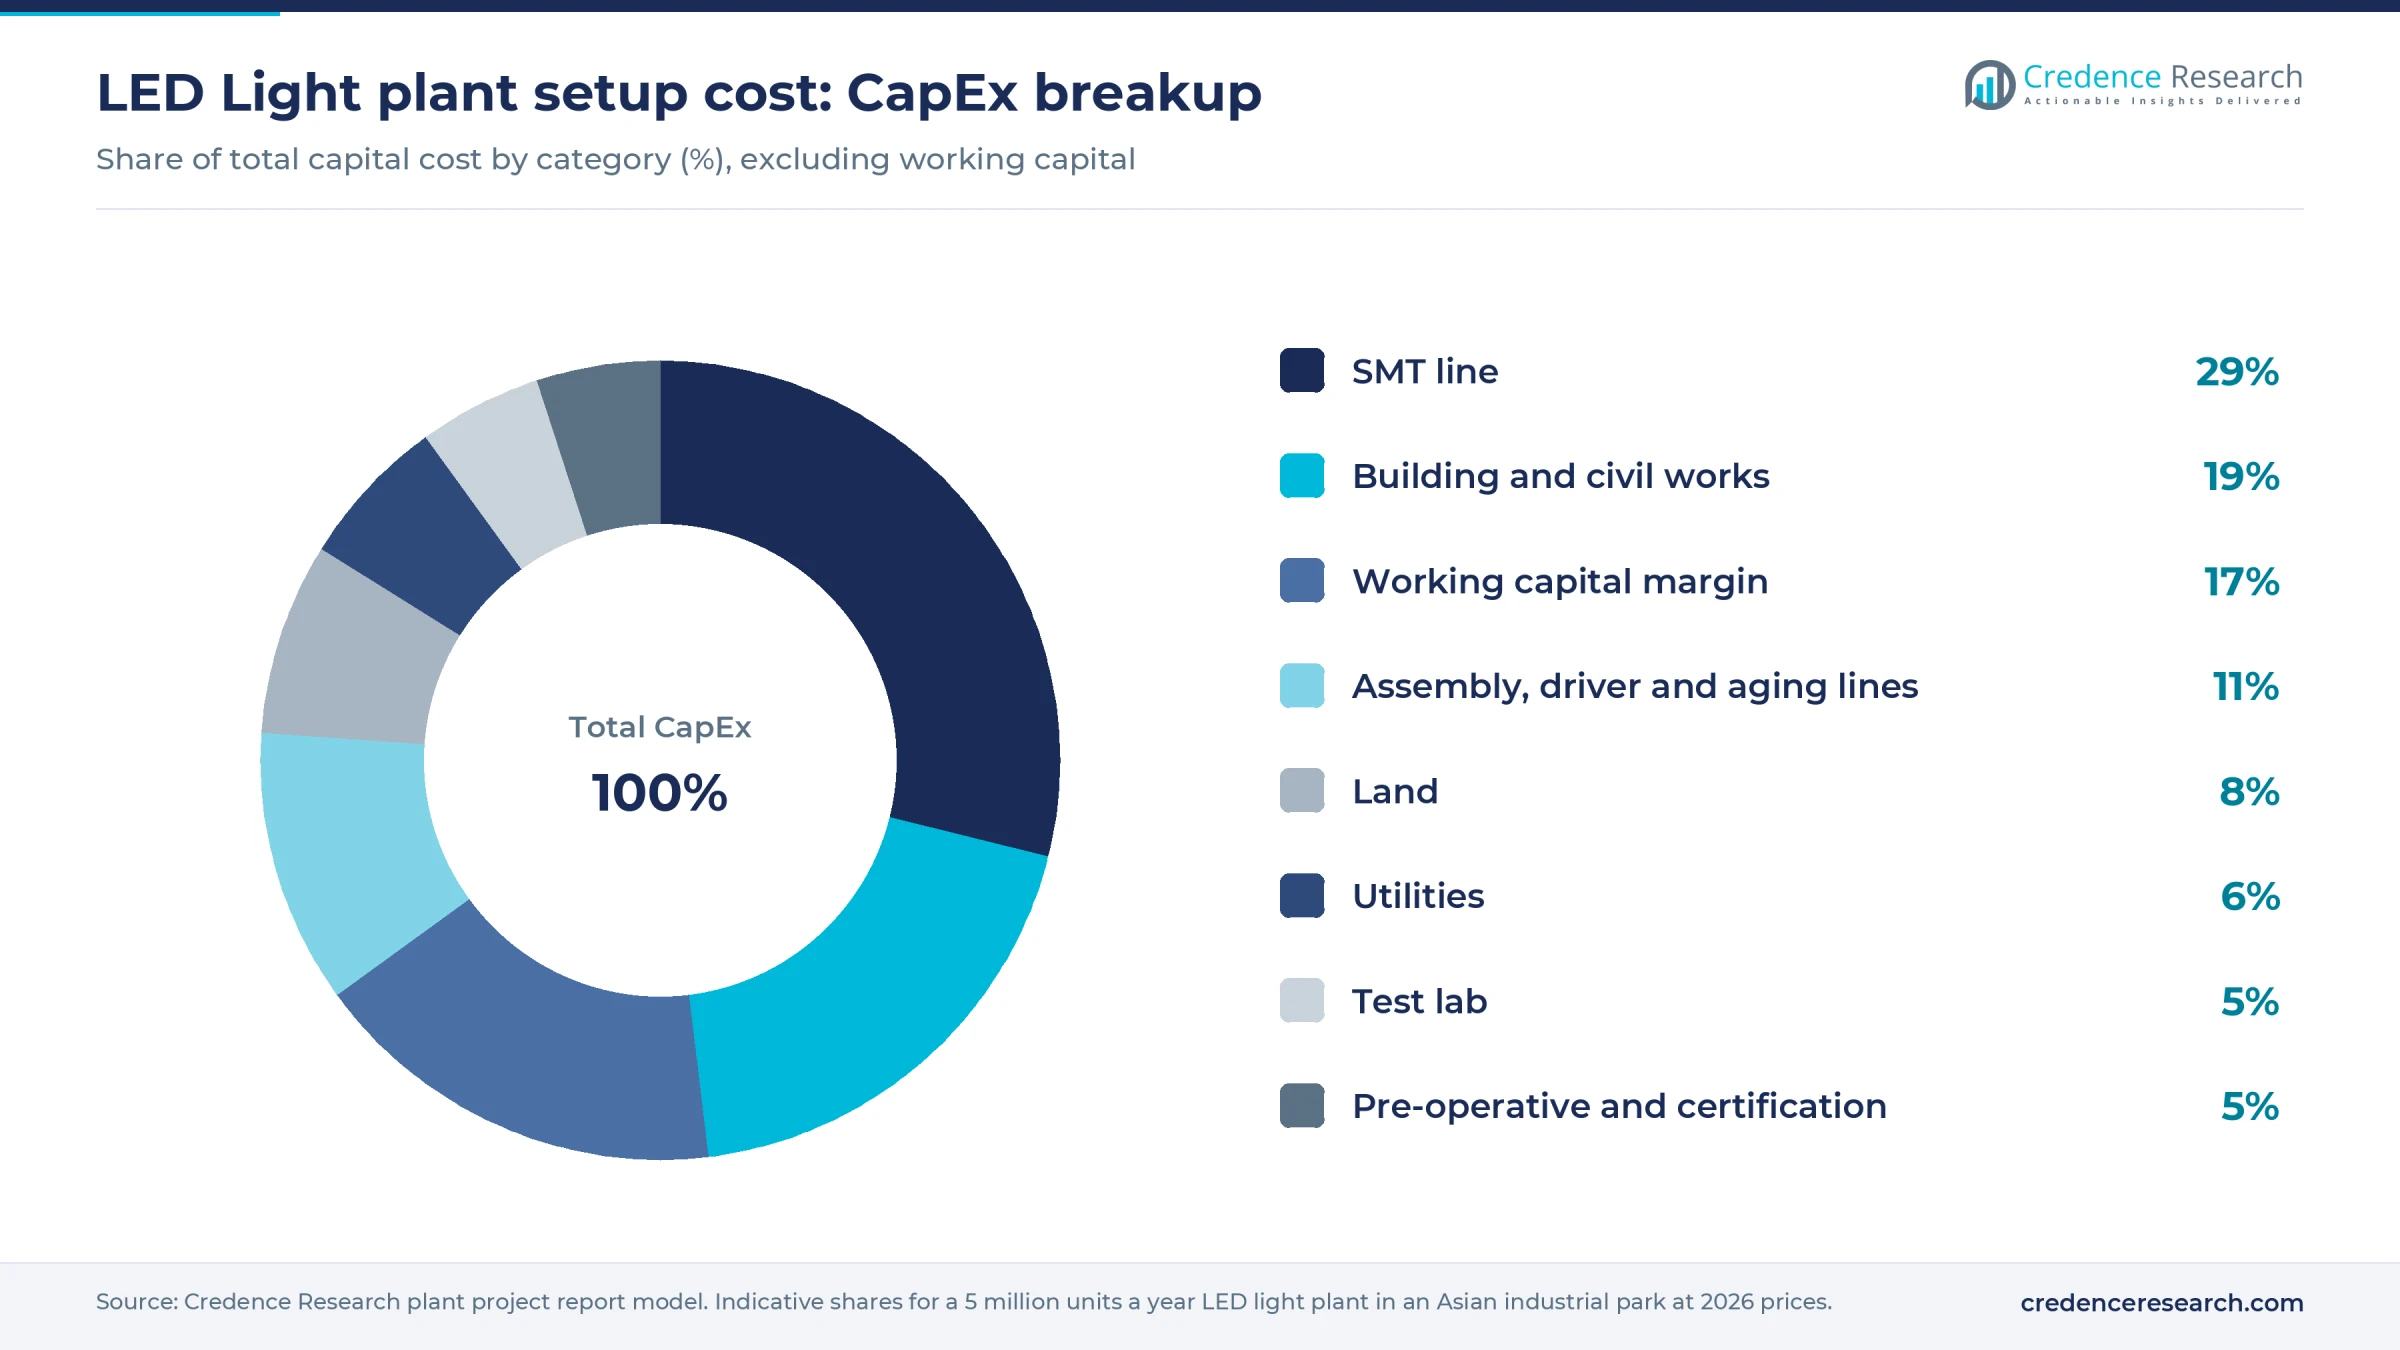
A 1,500 sq m shed with static-safe flooring and air-conditioned SMT space adds about USD 240,000–360,000 at an assumed USD 160–240 per sq m. The SMT line is the largest item at about USD 350,000–600,000. Output of about 1,040 units an hour at 30 placements per unit needs about 50,000 placements an hour of nominal capacity at normal line efficiency, and one vendor's published prices for lines of 20,000–50,000 placements an hour run USD 200,000–500,000 before feeders and inspection. Final assembly, driver lines and aging racks take USD 120,000–220,000 (assumed), the test lab USD 50,000–100,000 (assumed), utilities USD 80,000–130,000 (assumed) and pre-operative costs with certification USD 60,000–110,000 (assumed). Working capital margin is about USD 200,000–350,000.
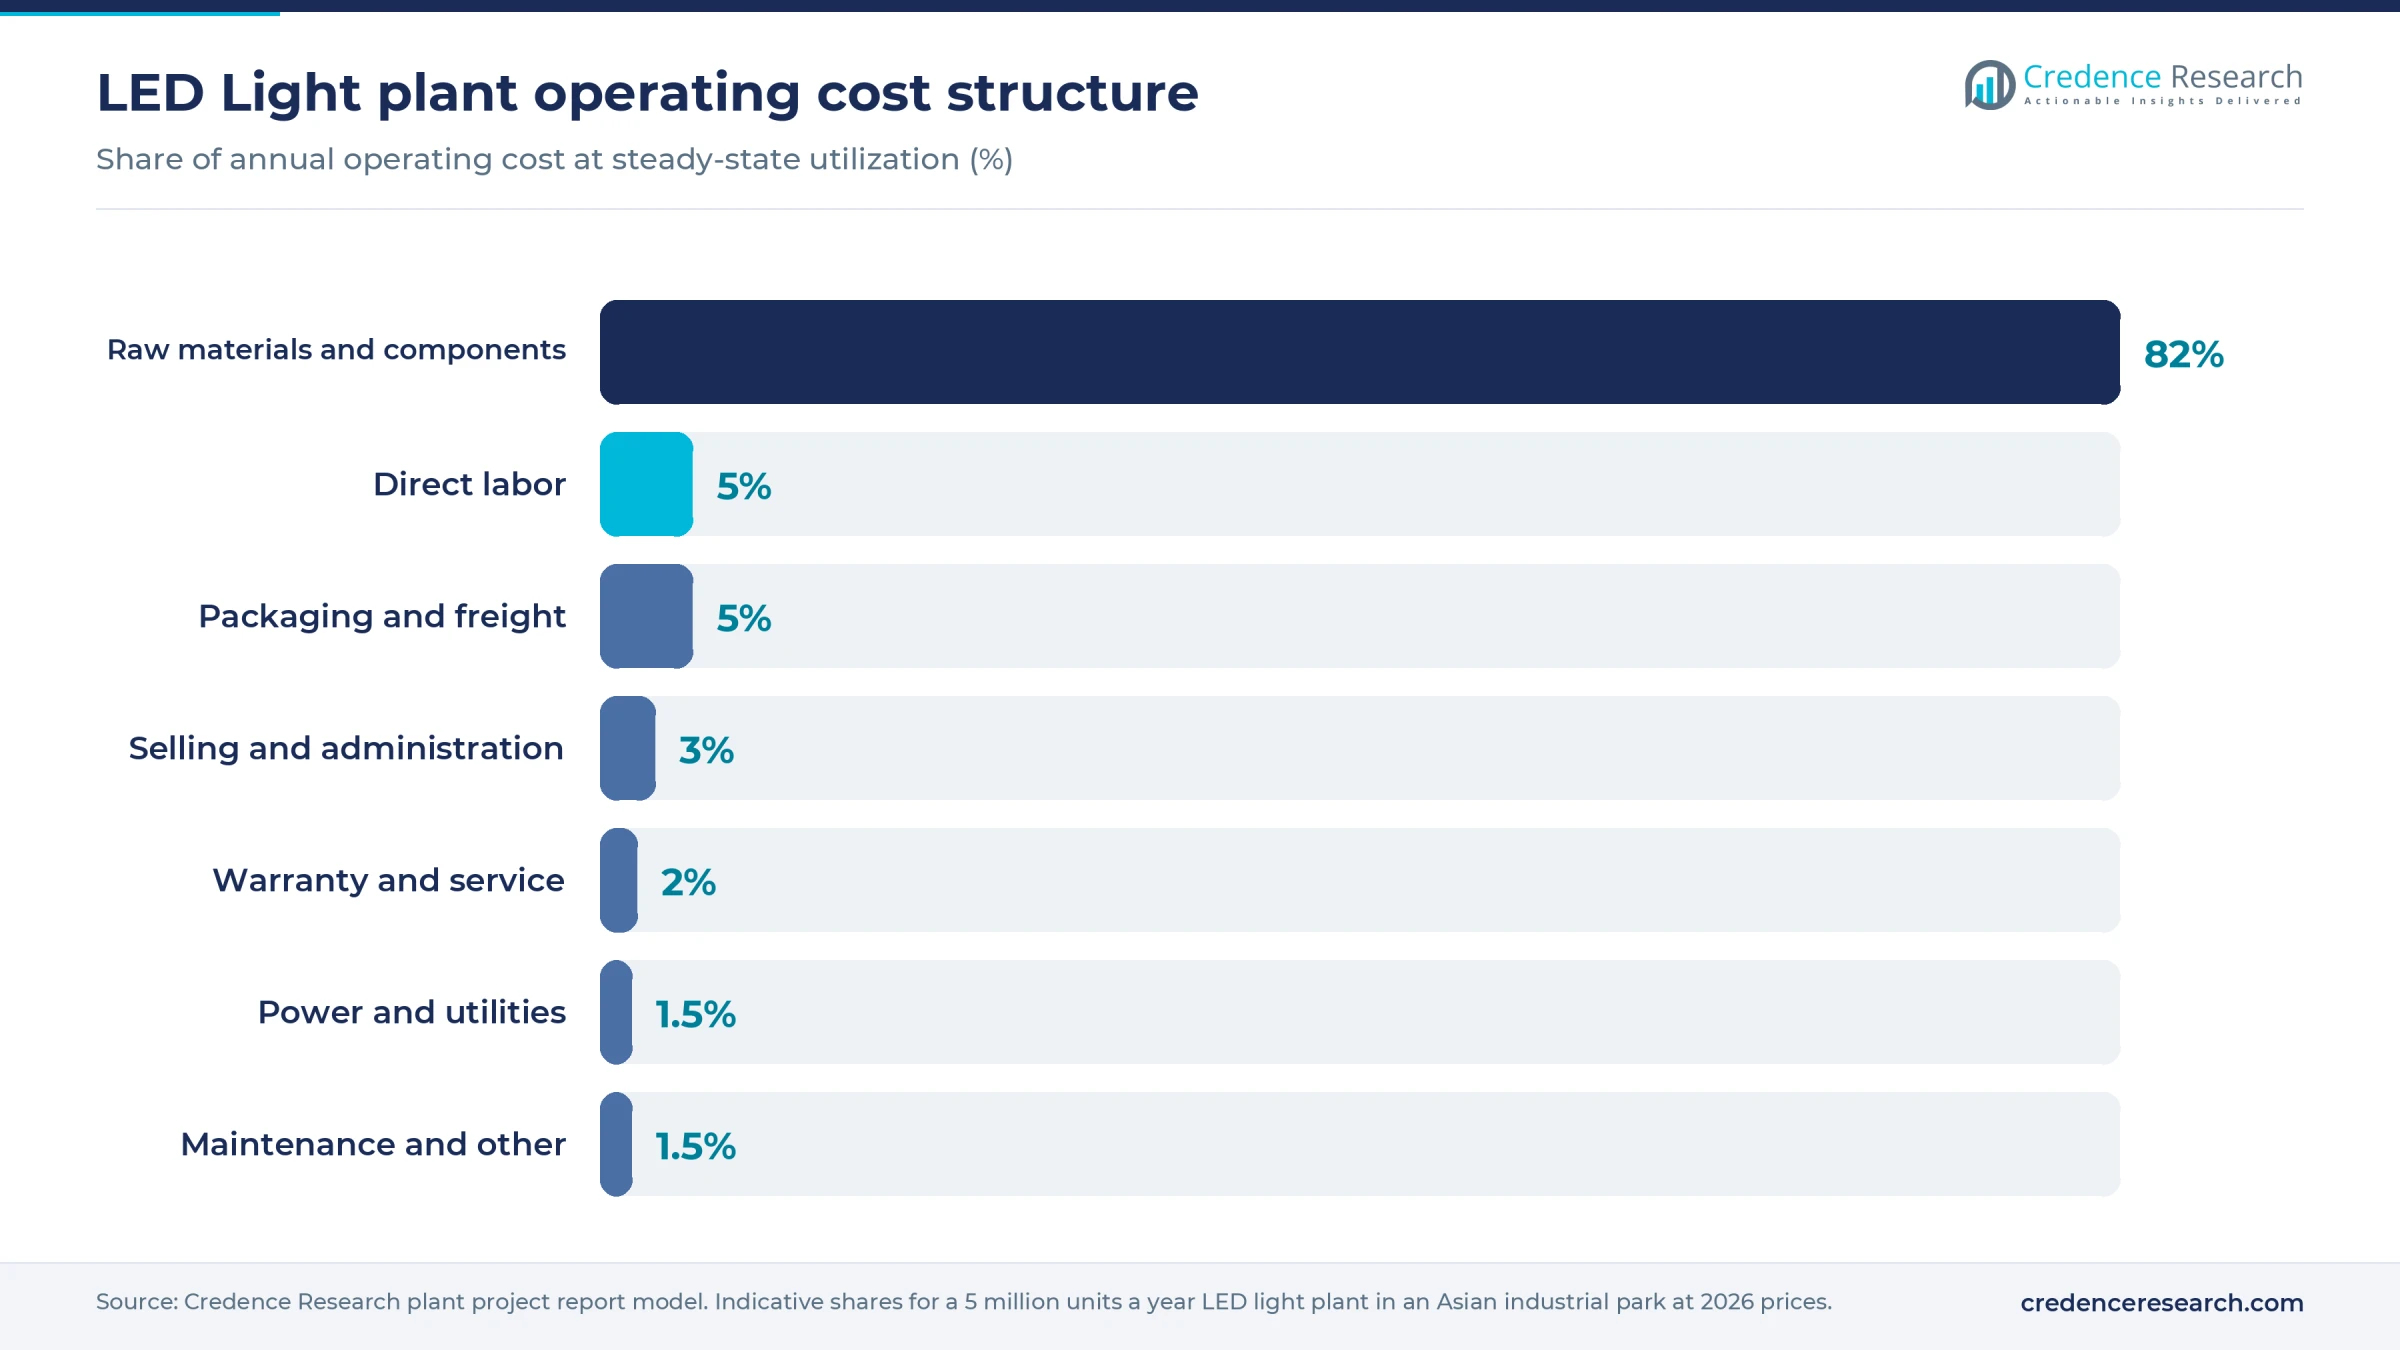
Operating cost is dominated by bought components, so purchasing skill matters more here than labor or power. Direct labor is small but rises with hand-finished luminaires.
Machinery and raw materials for an LED light plant
The core machinery list covers a solder paste printer, pick-and-place machines, a reflow oven, automated optical inspection, insertion and selective soldering stations for drivers, assembly conveyors, cap crimping and riveting machines, aging racks and packing lines. Support equipment includes dry cabinets, static-safe workstations, an air compressor, a transformer, a backup generator and air conditioning. The test lab needs an integrating sphere with spectroradiometer, power analyzer, surge generator, hipot tester and thermal chamber, and larger makers add a goniophotometer for luminaires. Injection molding is optional, since most small plants buy housings.
Raw materials are LED packages, metal-core circuit boards, driver ICs, capacitors, inductors and resistors, aluminum or thermally conductive plastic heat sinks, polycarbonate diffusers, lamp caps, solder paste, thermal compound and cartons. Phosphor is part of the bought-in package, so the phosphor materials market affects chip pricing indirectly.
Sourcing for these inputs is global. China supplies most LED packages, driver parts and caps, while Taiwan, Japan, South Korea and Germany supply higher-specification LEDs and semiconductors. Metal-core boards and aluminum extrusions come largely from China, with India and Southeast Asia growing as secondary sources. Plants serving U.S. buyers increasingly need a non-China supply plan to manage tariff exposure.
LED light business profit margin and ROI
Margins depend on product mix, purchasing and warranty cost. Commodity bulbs compete with Chinese exports: China's first-quarter 2026 light source shipments of about USD 1.3 billion across 4.9 billion general lighting units imply an average near USD 0.27 a unit, a rough indication that includes low-specification products. A published Tamil Nadu project profile from 2021 leaves 20–35% of selling price after materials at small scale, more on inverter bulbs than ordinary models. At 5 million units a year, with components at an assumed 72–78% of sales and direct conversion at 6–7%, gross margin comes to about 15–22%.
At 70% utilization the plant sells about 3.5 million units, which at the assumed blended price gives sales of about USD 2.8–4.4 million. After selling, freight, warranty and administrative costs of 7–9% of sales, cash profit of about USD 300,000–500,000 supports a payback of 3.5–6 years on a midpoint investment near USD 1.6 million, including ramp-up. A bulb-heavy mix at the bottom of the margin range would take longer. The largest risks are buyer price cuts, component inflation and field failures. Signify's finance chief called margin pressure at its Chinese lamp unit Klite structural in July 2026, citing component shortages and input cost inflation.
| Metric | Value |
|---|---|
| Gross margin | 15–22% |
| Payback period | 3.5–6 years |
| IRR (post-tax) | Available in report |
| NPV | Available in report |
| ROI | Available in report |
| DSCR | Available in report |
Sensitivity is strongest to component cost: if LED packages and driver parts are about 45% of the material bill (assumed), a sustained 10% price rise without a list price revision trims gross margin by about 3 percentage points.
How to start an LED light business, licenses and approvals
A new plant needs business and tax registration, land use and building permits, an environmental permit or consent, occupational safety registration, and import-export registration for components. Dry assembly and SMT are usually low-impact, though solder fumes, flux, potting compounds and electronic scrap still need controls. Market access depends on product approvals for each model family: electrical safety, electromagnetic compatibility, restricted substances and energy efficiency, all backed by test reports.
| Market | Product safety and EMC | Energy and labeling |
|---|---|---|
| United States | Listing by a nationally recognized testing laboratory to UL 1993 for self-ballasted lamps, UL 8750 for LED equipment and UL 1598 for luminaires; FCC limits on electromagnetic interference | DOE general service lamp efficacy rule adopted in April 2024 with compliance from July 2028; FTC Lighting Facts label under 16 CFR Part 305 |
| European Union | CE marking under the Low Voltage Directive 2014/35/EU and EMC Directive 2014/30/EU, plus RoHS 2011/65/EU and WEEE registration | Ecodesign Regulation (EU) 2019/2020 and energy label Regulation (EU) 2019/2015, with product registration in the EPREL database |
| India | Bureau of Indian Standards registration under the Compulsory Registration Scheme, to IS 16102 for self-ballasted lamps and IS 10322 for luminaires; the revised standards move in by Feb. 2, 2027 | Bureau of Energy Efficiency star label for self-ballasted LED lamps |
Rules change often in this category, so applicants should confirm current status with the regulator before fixing a design. U.S. federal lamp rules in particular have shifted across administrations, and any model must clear the rule in force on the date of sale.
Key LED light manufacturers and recent developments
Global supply mixes large brands with contract makers. Leading names include Signify in the Netherlands, Acuity Brands in the United States, Panasonic in Japan, Zumtobel Group in Austria, Opple Lighting and NVC Lighting in China, and Havells, Crompton Greaves Consumer Electricals, Surya Roshni and Jaquar in India. Contract makers also hold real weight, including Lightanium Technologies, the 50:50 venture Signify and Dixon Technologies formed in India in 2025 to build bulbs, downlights and battens.
- January 2026. Signify announced a EUR 180 million cost plan affecting about 900 jobs, and in June it placed commoditized manufacturing under an all-options review.
- March 2026. Jaquar Group said it is investing more than USD 11 million in a new lighting plant at Bhiwadi, India, and another USD 6–7 million could follow.
- October 2026. Online bidding opened for equipment from the closed Cree Lighting USA plant in Racine County, Wisconsin, after Phoenix Lighting said in September it had bought equipment and rights tied to the product lines.
For a new entrant, these moves point the same way: large Western brands are stepping back from commodity output, while Asian assembly is growing. That opens OEM work and can bring used lab and assembly equipment to market. Demand for connected products, tracked in the smart lighting market, offers a route away from pure price competition.
What's inside the LED Light project report PDF
The report runs to 21 chapters. Open a chapter to see its sections.
1. Preface
2. Scope and Methodology
- 2.1 Objectives of the Study
- 2.2 Stakeholders
- 2.3 Research Methodology
- 2.4 Data Sources and Key Assumptions
3. Executive Summary
- 3.1 Market Snapshot
- 3.2 Project at a Glance (Capacity, CapEx, OpEx)
- 3.3 Key Financial Indicators (IRR, NPV, Payback, Break-even)
- 3.4 Feasibility Verdict
4. Product Overview
- 4.1 LED Light Definition and Properties
- 4.2 Grades and Specifications (BIS / ISO / ASTM)
- 4.3 HS Code and Classification
- 4.4 Key Applications
- 4.5 Substitutes
5. Global LED Light Market
- 5.1 Market Overview
- 5.2 Historical and Current Market Performance (Volume and Value)
- 5.3 Market Breakup by Grade / Type
- 5.4 Market Breakup by End-Use Industry
- 5.5 Market Breakup by Region
- 5.6 Market Drivers, Restraints and Trends
- 5.7 Value Chain Analysis
- 5.8 Market Forecast
6. Target Country LED Light Market Analysis
- 6.1 Demand and Supply Analysis
- 6.2 Installed Capacity vs Demand Gap
- 6.3 Import Dependence
- 6.4 Demand Forecast by End-Use
7. Trade Analysis
- 7.1 Imports by Volume, Value and Country
- 7.2 Exports by Volume, Value and Country
- 7.3 Trade Balance and Opportunities
8. Price Analysis
- 8.1 Historical LED Light Price Trends by Region
- 8.2 Raw Material / Feedstock Price Trends and Linkage
- 8.3 Price Forecast
- 8.4 Margins Across the Value Chain
9. Competitive Landscape
- 9.1 Market Structure
- 9.2 Key Players and Installed Capacities
- 9.3 Profiles of Key Players
- 9.4 Recent Developments (Expansions, M&A, New Plants)
10. Manufacturing Process and Technology
- 10.1 Comparison of Technology Routes
- 10.2 Selected Route and Process Flow Diagram
- 10.3 Unit Operations Involved
- 10.4 Chemical Reactions Involved
- 10.5 Mass Balance and Raw Material Requirements
- 10.6 Energy Balance
- 10.7 Quality Assurance Criteria and Technical Tests
- 10.8 By-products and Waste Handling
- 10.9 Technology Licensors / Providers
11. Project Details, Requirements and Costs
- 11.1 Land, Location and Site Development
- 11.1.1 Site Selection Criteria
- 11.1.2 Location Analysis
- 11.1.3 Land Requirement and Costs
- 11.1.4 Site Development Costs
- 11.2 Plant Layout
- 11.2.1 Layout Principles
- 11.2.2 Proposed Layout
- 11.2.3 Factors Influencing Layout
- 11.3 Civil Works and Buildings
- 11.4 Plant Machinery
- 11.4.1 Machinery Requirements and Specifications
- 11.4.2 Machinery Costs
- 11.4.3 Machinery Suppliers
- 11.5 Raw Materials
- 11.5.1 Requirements per Tonne of Output
- 11.5.2 Procurement and Sourcing
- 11.5.3 Costs
- 11.5.4 Suppliers
- 11.6 Packaging
- 11.6.1 Packaging Requirements
- 11.6.2 Packaging Costs
- 11.6.3 Packaging Suppliers
- 11.7 Storage and Material Handling
- 11.8 Transportation Requirements and Costs
- 11.9 Utilities
- 11.9.1 Power Requirements and Costs
- 11.9.2 Water Requirements and Costs
- 11.9.3 Steam, Fuel and Other Utilities
- 11.10 Manpower Requirements and Wages
12. Environment, Health, Safety and Sustainability
- 12.1 Effluent and Emissions Management
- 12.2 Hazard Classification and Safety Measures
- 12.3 Carbon Footprint
- 12.4 Green / Low-Carbon Process Options
13. Regulatory Procedures, Approvals and Certifications
- 13.1 Licences and Registrations
- 13.2 Environmental Clearances
- 13.3 Product Certifications (BIS, REACH, etc.)
- 13.4 Approval Timeline
14. Project Implementation Schedule
15. Project Economics
- 15.1 Capital Cost of the Project
- 15.2 Techno-Economic Parameters
- 15.3 Capacity Utilization and Ramp-up
- 15.4 Product Pricing and Margins
- 15.5 Income Projections
- 15.6 Expenditure Projections
- 15.7 Working Capital Requirement
- 15.8 Taxation
- 15.9 Depreciation
16. Financial Analysis
- 16.1 Projected Profit and Loss Account
- 16.2 Projected Cash Flow Statement
- 16.3 Projected Balance Sheet
- 16.4 Liquidity Analysis
- 16.5 Profitability Analysis (Payback, NPV, IRR, ROI)
- 16.6 Break-even Analysis
- 16.7 Debt Service Coverage Ratio (DSCR)
- 16.8 Sensitivity Analysis
- 16.9 Scenario and Uncertainty Analysis
17. Funding and Incentives
- 17.1 Means of Finance and Debt-Equity Structure
- 17.2 Loans and Financial Assistance
- 17.3 Government Schemes and Subsidies (PLI, State Policies)
18. Risk Assessment
- 18.1 Key Success Factors
- 18.2 Key Risk Factors
- 18.3 Risk Mitigation
19. Strategic Recommendations
20. Case Study of a Successful Venture
21. Appendix
- 21.1 Detailed Assumptions
- 21.2 Abbreviations
- 21.3 List of Tables and Figures
- 21.4 Sources
This page vs. the full report
| Data point | On this page (free) | In the full report |
|---|---|---|
| Total CapEx | One rounded range at one capacity | Exact figure at three capacities with a line-item breakup |
| CapEx breakup | Category shares (%) only | Cost, quantity and supplier for every machine |
| Operating cost | Share of raw materials, utilities and labor | Per-unit cost sheet with each input price and consumption |
| Profitability | Gross margin range and payback band | Exact IRR, NPV, ROI, break-even and DSCR |
| Financial statements | List of what is included | 10-year P&L, cash flow, balance sheet and Excel model |
| Sensitivity | One directional line | Full sensitivity and scenario tables |
| Process | Simplified flow diagram | Detailed process flow, mass and energy balance, operating conditions |
| Machinery | Names of the main machines | Specifications, capacity, cost and supplier list |
| Market | Headline size, growth and India demand trend | Segment, region, trade and price forecast tables |
| Suppliers and buyers | Supplier types and sourcing hubs | Named suppliers and buyers |
LED Light project report: FAQs
How much does it cost to set up an LED light manufacturing plant?
Can an LED light plant start without an SMT line?
What certifications does an LED light need?
What is the profit margin in LED light manufacturing?
What is the payback period for an LED light plant?
Where do LED light plants source components?
Should a new plant make bulbs or luminaires?

About the analyst
Amit Jain, Senior Consultant – ICT & Emerging Technologies
Strategic market intelligence and consulting leader at Credence Research Inc with 20+ years across the global ICT sector, specializing in quantitative market sizing, technology lifecycle forecasting, competitive intelligence and commercial due diligence for enterprise clients worldwide.
Related market research
- LED Lights Market Size, Growth, Trend, Share and Forecast 2032
- Lighting Fixtures and Luminaires Market Size, Share and Forecast 2032
- LED Panels/Troffers Market Size, Trends, Share and Forecast 2032
- LED Phosphor Materials Market Size, Growth and Forecast 2032
- Buck-boost LED Drivers Market Size, Growth and Forecast 2032
- Smart Lighting Market Size, Share and Growth Report 2032
More plant project reports
- Shrimp Processing Plant Project Report (DPR) 2026
- Instant Coffee Manufacturing Plant Project Report (DPR) 2026
- Rare Earth Magnet Manufacturing Plant Project Report (DPR) 2026
- PET Bottle Manufacturing Plant Project Report (DPR) 2026
- Pectin Manufacturing Plant Project Report (DPR) 2026
- Paper Cups Manufacturing Plant Project Report (DPR) 2026