
Quick answer
A fruit juice plant washes, extracts, pasteurizes and aseptically packs juice from citrus, apple, mango and other fruit. This overview models a greenfield multi-fruit plant handling 10 tonnes of fruit an hour, with estimated CapEx of USD 12–25 million depending on cost region. Gross margin after fruit, packaging and direct conversion is estimated at 18–30%, with payback at 5–12 years, because seasonal supply limits utilization.
Viable near reliable orchards with contracted private-label demand, but a long-payback project where a single fruit or weak utilization can undo the case.
Fruit Juice plant: key highlights
| Parameter | Indicative value | Note |
|---|---|---|
| Plant capacity | 10 tonnes of fruit an hour | 40,000 tonnes a year at nameplate; about 14,000 tonnes of juice sold at 75% utilization |
| Total CapEx | USD 12–25 million | Greenfield multi-fruit plant, excludes USD 3–6 million working capital |
| Raw material share of operating cost | 55–65% | Delivered fruit; packaging is next |
| Gross margin | 18–30% | After fruit, packaging and direct conversion |
| Payback period | 5–12 years | Includes ramp-up; depends on fruit cost and contracts |
| IRR | Available in report | Post-tax, 10-year model |
| Break-even | Available in report | Capacity utilization basis |
Ranges assume a 10 tonnes-per-hour greenfield multi-fruit plant, 16-hour days, 250 days, 75% utilization and 2026 prices. Fruit at USD 230–250 per ton, packaging, conversion and selling price of USD 0.95–1.15 per kg are assumed, informed by 2024 Comtrade export unit values. Ugandan shillings at about 3,570 per USD, from a 2025 press conversion. The full report can be customized to any country or region.
What is fruit juice?
Fruit juice is the liquid extracted from sound, ripe fruit, sold either as not-from-concentrate juice or rebuilt from concentrate with water. Processors handle three broad grades. Not-from-concentrate juice keeps a fresher flavor but is bulky to ship. Concentrate removes most of the water, so it travels and stores cheaply. Puree and pulp keep the fruit fiber and suit mango, banana and guava, which do not press clear.
The Harmonized System places these goods under heading 2009, at 6-digit level. Orange juice falls under 2009.11 (frozen), 2009.12 (not frozen, Brix of 20 or less) and 2009.19 (other). Apple falls under 2009.71 and 2009.79, juice of other single fruits under 2009.89, and blends under 2009.90.
Buyers are retail and private-label brands, foodservice operators, and beverage, dairy and bakery manufacturers using juice as an ingredient. The choice of grade decides the whole plant design, because a bulk concentrate factory and a retail packing plant share little beyond the fruit reception area. This overview models a multi-fruit plant that sells packaged not-from-concentrate juice.
Fruit juice market overview and global demand
Credence Research values the broader global juice concentrates market at about USD 86.6 billion in 2025, a figure derived from its USD 81.79 billion for 2024 and a 5.9% CAGR. It sizes the apple juice category at USD 18.99 billion for 2024, with a 4.7% CAGR. These scopes overlap and include finished goods, so neither figure represents this plant's addressable trade.
Trade gives a firmer view. UN Comtrade reporters recorded 2024 exports of about USD 19.8 billion and 11.9 million tonnes under heading 2009. Brazil led with USD 3.5 billion, followed by the Netherlands at USD 2 billion, then Spain, China, Germany, Thailand and Poland. The Netherlands largely reflects European re-export and blending. The United States was the top importer at about USD 4.3 billion, ahead of the Netherlands, Germany, the United Kingdom, France, China and Japan.
Orange juice remains the benchmark product. USDA's Foreign Agricultural Service projected 2025–26 output at about 1.4 million tons, of which Brazil supplies about 1 million, consumption up 4% to 1.2 million tons, and exports of 1.3 million tons.
Prices have been the main story. CitrusBR data show Brazil shipped 746,900 tons in FCOJ equivalent in 2025–26, nearly flat, while revenue fell about 30% to USD 2.38 billion. By September 2026, European prices stood near USD 2,800 per ton for concentrate and USD 950 for not-from-concentrate juice. An investor should treat the record prices of 2024 as an exception, not a planning base.
Fruit juice manufacturing process
The modeled plant receives fresh fruit in season and packs shelf-stable juice in aseptic cartons or PET bottles. The sequence below varies by fruit, and most of the design effort goes into keeping several fruits on one line without flavor carryover.
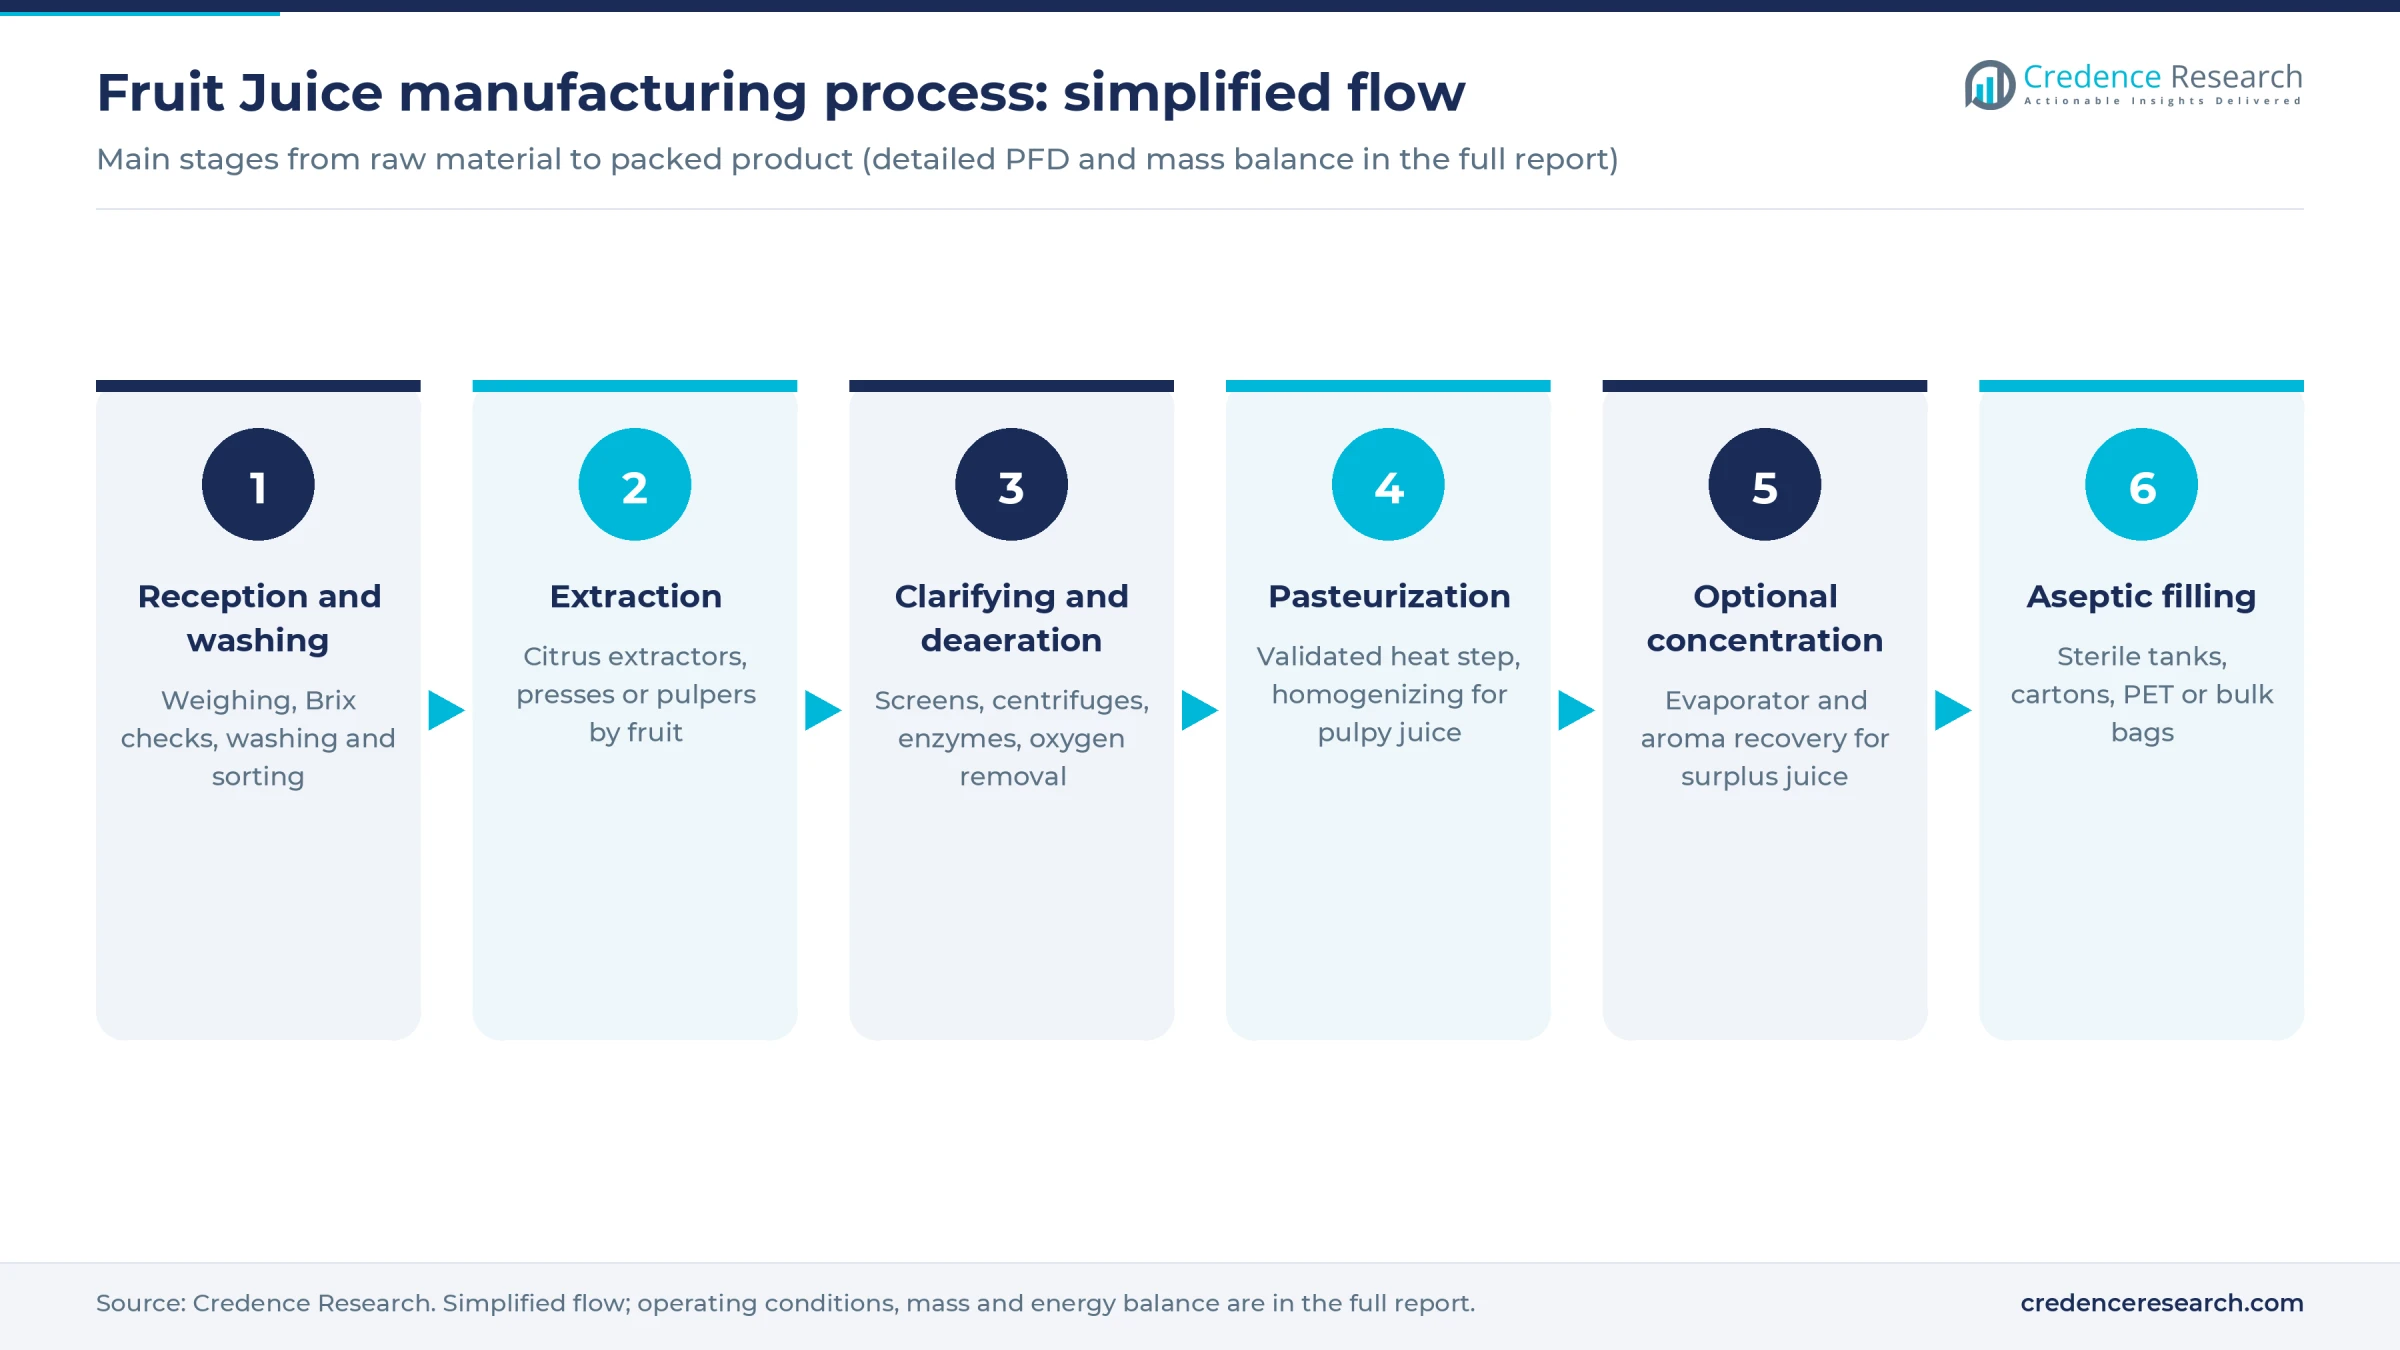
- Reception and washing. Trucks are weighed and sampled for Brix and acidity. Fruit is then washed and hand or optically sorted, because one moldy lot can taint a whole tank and raise patulin in apple juice.
- Extraction. Citrus goes through in-line extractors that keep bitter peel oil out of the juice. Apples go through mills and belt presses or decanters. Mango, guava and banana are destoned and pulped through finisher screens.
- Clarifying and finishing. Screens or centrifuges set the pulp level. Clear apple juice also takes enzyme treatment and ultrafiltration. A vacuum deaerator then strips oxygen, which protects vitamin C and color.
- Heat treatment. A plate or tubular pasteurizer delivers the validated kill step, and high-pressure homogenizing is added for pulpy products. Acid juices tolerate moderate temperatures, while low-acid blends need a much stricter process.
- Optional concentration. A multi-effect evaporator with aroma recovery can cut a surplus season's juice to 65–70 Brix for off-season reconstitution, though it adds capital and steam use.
- Aseptic filling. Product enters sterile tanks and then fillers or 200-liter aseptic bags, followed by coding, case packing and palletizing.
Sanitation matters as much as the kill step. Clean-in-place circuits run between fruits, and swabs and shelf-life samples release each lot. Peel, pomace and sludge leave daily, often as cattle feed, or for pectin, essential oil or biogas where nearby buyers justify it. Exact recipes, utility balances and process parameters are in the full report.
Fruit juice plant setup cost
This overview models a greenfield plant handling 10 tonnes of fruit an hour, or 40,000 tonnes a year at nameplate over 16-hour days and 250 days. At 75% utilization, reflecting seasonal supply, and an assumed 47% pack-out, it sells about 14,000 tonnes of juice. Estimated CapEx is USD 12–25 million before working capital.
The range rests on disclosed African fruit projects, which publish the clearest capacity and cost pairs. Uganda's Soroti Fruit Factory is reported at USD 11.4 million for 6 tonnes an hour. Orana Gate in Namanve is reported at 22.5 billion Ugandan shillings, about USD 6.3 million, for 5 tonnes an hour. Ghana's Ekumfi Fruits and Juices reported about USD 20 million invested in early 2023 for 10 tonnes of juice an hour, or about 20 tonnes of fruit at this model's pack-out. Scaled on a fruit basis with a standard capacity exponent, they give about USD 10–16 million. The floor rises to USD 12 million to cover a full aseptic packing line. The top adds assumed allowances of about 25% each for cost escalation and a higher-cost region, which are judgments, not disclosures.
Whole branded complexes cost far more. Lassonde's USD 200 million New Jersey replacement plant is one example, with capacity undisclosed, so it is excluded here.
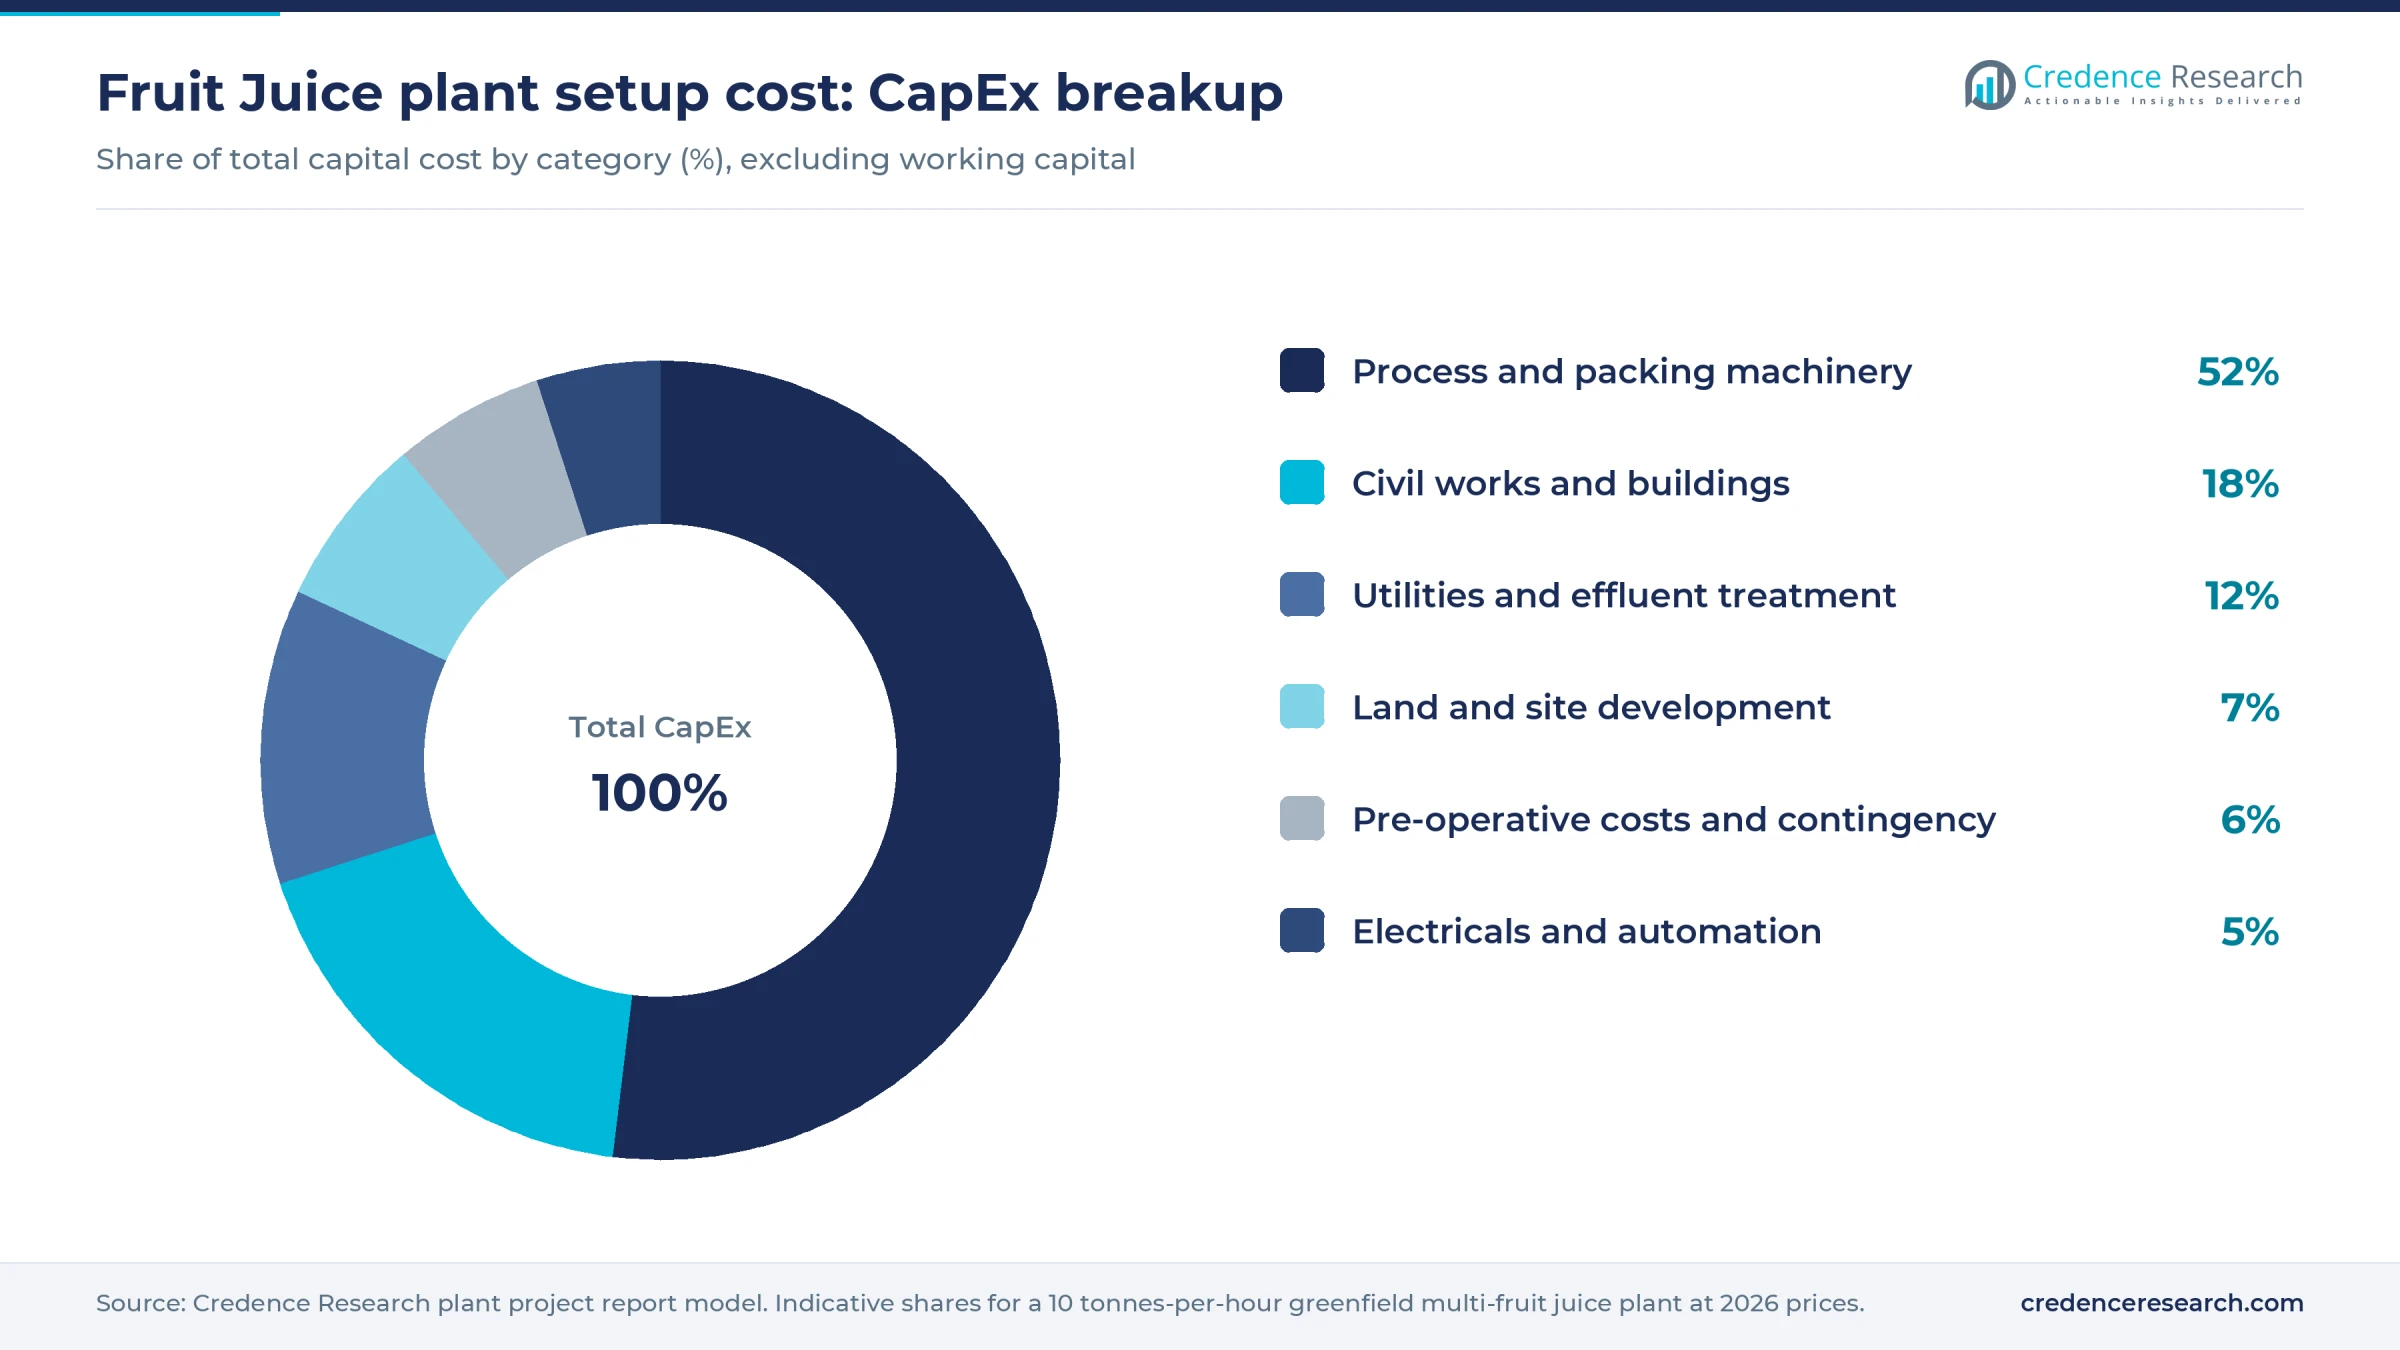
Worked example, land and site development. The plant needs an assumed 20,000–30,000 square meters. At an assumed USD 20–60 per square meter in an Asian or African industrial park, the plot costs about USD 0.4–1.8 million, and at an assumed USD 30–80 at a U.S. or EU site, about USD 0.6–2.4 million. Site works add an assumed USD 0.3–0.5 million, so this row runs about 6–12% of CapEx.
Seasonal fruit also forces a heavy stock position. Three months of finished juice plus 45 days of receivables tie up an estimated USD 3–6 million.
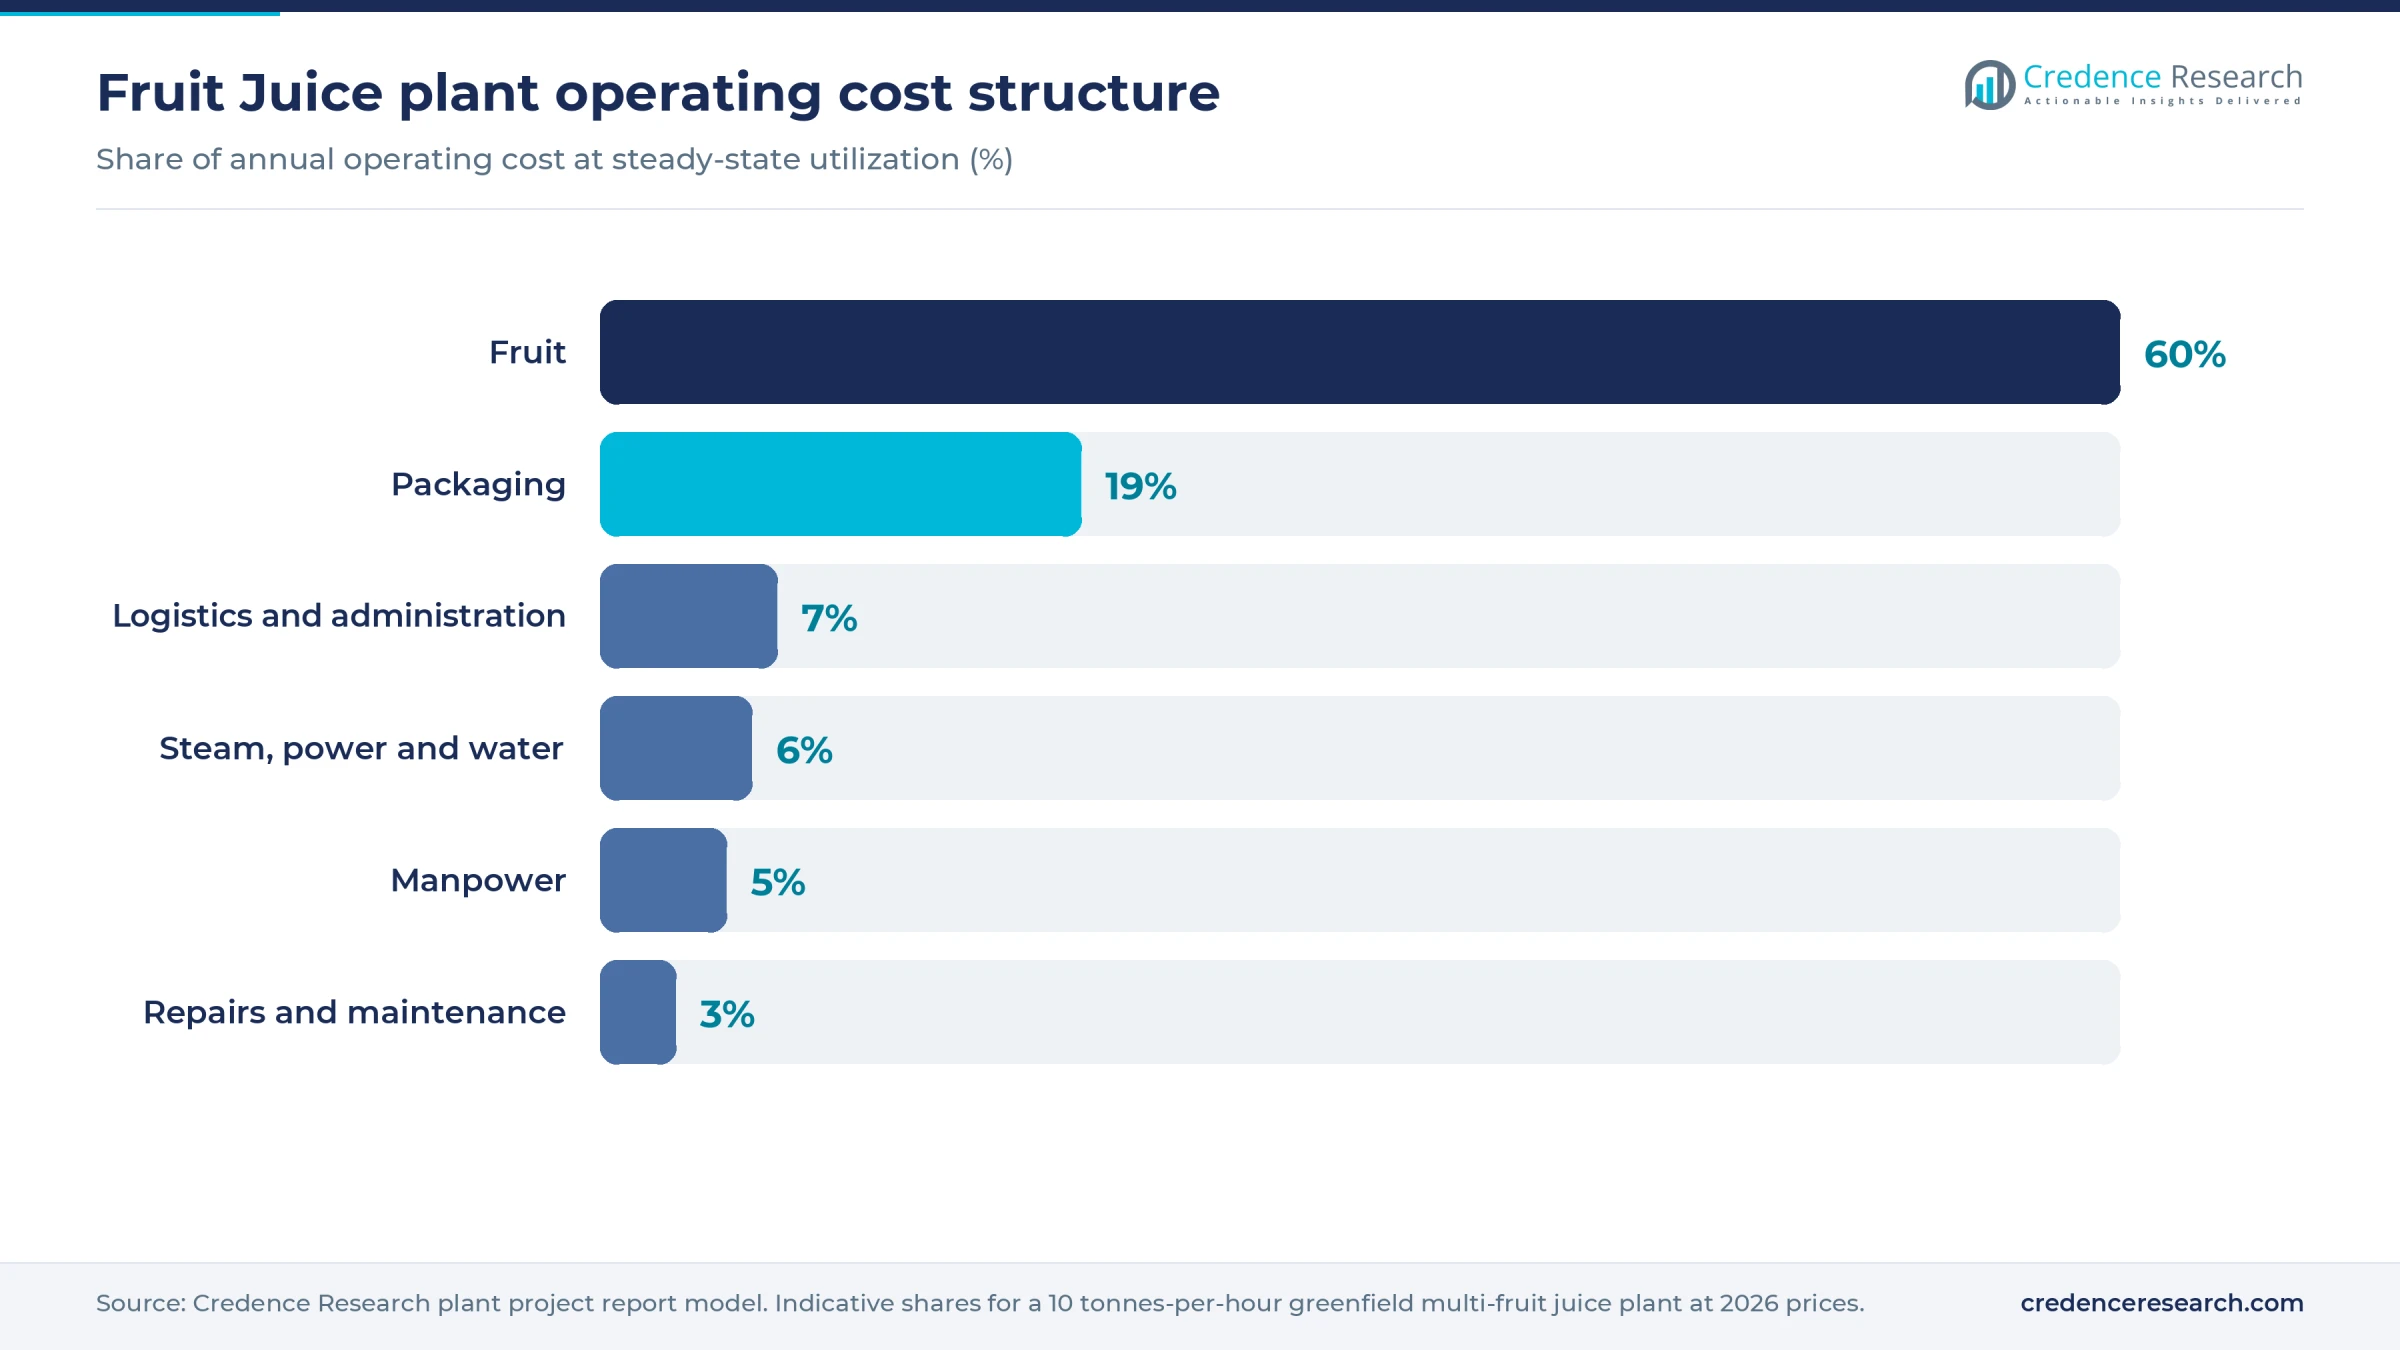
Fruit dominates running costs, ahead of packaging. The full report can be customized to any country or region, and line-item budgets remain there.
Machinery and raw materials for a fruit juice plant
Core machinery includes truck scales, fruit dumpers and elevators, roller sorters and washers, citrus extractors, hammer mills and belt presses or decanters, destoner and pulper-finisher sets, enzyme and blending tanks, a deaerator, homogenizer and tubular pasteurizer. Packing takes aseptic tanks, carton or PET fillers, and case packers. Utilities cover a boiler, ammonia or glycol chilling, water treatment, clean-in-place skids and an effluent plant. Brownfield additions can be far cheaper, as Tanzania's Bakhresa shows with about 20 billion Tanzanian shillings to lift its Mwandege plant's fruit capacity from 45,000 to 100,000 tonnes a year.
Raw material strategy decides whether the plant survives. Brazil's Sao Paulo belt and Florida anchor oranges, with Mexico, Spain, Italy, Egypt and South Africa as other citrus sources. China, Poland, Turkey and Ukraine lead processing apples, which is why their exporters dominate apple concentrate. India, Mexico, Thailand and the Philippines serve mango and pineapple, while Thailand's and the Philippines' juice exports rest on their pineapple and coconut bases. Spot Brazilian processing oranges traded at 25–31 reais a box in 2026, about USD 115–140 per ton at an assumed 5.4 reais per dollar and a 40.8 kg box. That is near the low end worldwide, and this model assumes USD 230–250 per ton delivered for a multi-fruit mix.
The plant must sit within a short truck haul of orchards, since fruit deteriorates quickly and juice yields fall. Packaging suppliers, including juice carton and bottle formats, typically require volume commitments, which affects the working capital plan.
Fruit juice business profit margin and ROI
Estimated gross margin is 18–30%, after fruit, packaging and direct conversion costs. It draws on 2024 Comtrade export unit values for single-strength juice of about USD 1.06–1.43 per kilogram across Thailand, Spain and Germany, against Brazilian not-from-concentrate juice, mostly shipped in bulk, at USD 0.58. The model sets its realized price at an assumed USD 0.95–1.15 per kilogram, toward the low end of the packed-goods figures to allow for private-label pricing.
Fruit, packaging and conversion together are assumed at about USD 0.74–0.84 per kilogram of juice, with fruit at an assumed USD 230–250 per ton and 45–47% pack-out. As a cross-check, data-provider figures show listed North American maker Lassonde at gross margins of 24–28% across fiscal 2021–25.
Payback is an estimated 5–12 years, including about 18 months of ramp-up, on post-tax cash profit of about USD 2–3.3 million a year. That long band is the honest headline. Well-run plants shorten it through low-cost regions and steady private-label contracts, while a poor crop year can cut cash profit toward USD 1 million and stretch it further.
Sensitivity is direct. A USD 20 per ton rise in delivered fruit takes about 4 percentage points from gross margin unless contracts pass it through.
| Metric | Value |
|---|---|
| IRR | Available in report |
| NPV | Available in report |
| ROI | Available in report |
| DSCR | Available in report |
How to start a fruit juice business, licenses and approvals
A juice plant needs approvals in six areas wherever it is built. These are business and tax registration; land use, zoning and building permits; an environmental permit covering high-strength wastewater, boiler emissions and solid fruit waste; occupational safety, plus boiler, pressure vessel and ammonia refrigeration approvals; food facility registration with product standards and a validated process; and customs registration for trade. Effluent usually proves the toughest item, because peak-season sugar loads are large, and many sites must also secure water abstraction rights.
| Market | Food product | Environment, safety and trade |
|---|---|---|
| United States | FDA food facility registration; Juice HACCP under 21 CFR Part 120, including the 5-log pathogen reduction requirement; labeling of percent juice under 21 CFR Part 101 | State air permit for boilers; NPDES or local pretreatment permit; OSHA standards, including process safety rules for ammonia systems above threshold |
| European Union | Food business registration under Regulation (EC) No 852/2004; composition and naming under Directive 2001/112/EC, amended by Directive (EU) 2024/1438, applied from June 14, 2026, which adds a sugar-reduced juice category | National environmental permit, with this plant below the Industrial Emissions Directive's 300-tonne daily threshold for vegetable raw materials; national worker safety rules |
| India | FSSAI license, state or central by size and activity; fruit juice standards under regulation 2.3.6 of the 2011 food product standards; Legal Metrology packer registration | State pollution control board consents to establish and operate; factory license and boiler registration; Import Export Code and APEDA registration for exports |
Retail buyers commonly also require certified systems such as FSSC 22000 or BRCGS, plus kosher, halal or organic certification by customer. Requirements vary locally, and the full report lists the steps for a chosen country.
Key fruit juice manufacturers and recent developments
Citrosuco, Cutrale and Louis Dreyfus Company dominate Brazilian orange juice supply, and Dohler and AGRANA are major ingredient suppliers. Branded and contract leaders include Tropicana Brands Group, The Coca-Cola Company, Eckes-Granini, Refresco, Rauch and Lassonde. Regional players include Dabur in India, Del Monte Pacific in the Philippines, and Bakhresa Group in Tanzania. Investors can compare fresh-format trends in the unconcentrated orange juice study.
- May 2026. Refresco completed its acquisition of SunOpta, adding aseptic manufacturing and North American customers to a contract business whose range includes juices.
- February 2026. SPC Global said it would move juice work out of its Mill Park, Melbourne site, scheduled to close by the end of August, to Shepparton and a partner in Griffith, cutting a planned A$23.5 million project to about A$3 million.
- November 2025. Uganda's government outlined a 107 billion shilling, about USD 30 million, plan to expand and modernize Soroti Fruit Factory, with multi-fruit units, automatic bottling and by-product lines, after a run of low utilization.
Together these moves show large contract packers consolidating aseptic capacity, while newer plants learn that low utilization and a single fruit can undo a project.
What's inside the Fruit Juice project report PDF
The report runs to 21 chapters. Open a chapter to see its sections.
1. Preface
2. Scope and Methodology
- 2.1 Objectives of the Study
- 2.2 Stakeholders
- 2.3 Research Methodology
- 2.4 Data Sources and Key Assumptions
3. Executive Summary
- 3.1 Market Snapshot
- 3.2 Project at a Glance (Capacity, CapEx, OpEx)
- 3.3 Key Financial Indicators (IRR, NPV, Payback, Break-even)
- 3.4 Feasibility Verdict
4. Product Overview
- 4.1 Fruit Juice Definition and Properties
- 4.2 Grades and Specifications (BIS / ISO / ASTM)
- 4.3 HS Code and Classification
- 4.4 Key Applications
- 4.5 Substitutes
5. Global Fruit Juice Market
- 5.1 Market Overview
- 5.2 Historical and Current Market Performance (Volume and Value)
- 5.3 Market Breakup by Grade / Type
- 5.4 Market Breakup by End-Use Industry
- 5.5 Market Breakup by Region
- 5.6 Market Drivers, Restraints and Trends
- 5.7 Value Chain Analysis
- 5.8 Market Forecast
6. Target Country Fruit Juice Market Analysis
- 6.1 Demand and Supply Analysis
- 6.2 Installed Capacity vs Demand Gap
- 6.3 Import Dependence
- 6.4 Demand Forecast by End-Use
7. Trade Analysis
- 7.1 Imports by Volume, Value and Country
- 7.2 Exports by Volume, Value and Country
- 7.3 Trade Balance and Opportunities
8. Price Analysis
- 8.1 Historical Fruit Juice Price Trends by Region
- 8.2 Raw Material / Feedstock Price Trends and Linkage
- 8.3 Price Forecast
- 8.4 Margins Across the Value Chain
9. Competitive Landscape
- 9.1 Market Structure
- 9.2 Key Players and Installed Capacities
- 9.3 Profiles of Key Players
- 9.4 Recent Developments (Expansions, M&A, New Plants)
10. Manufacturing Process and Technology
- 10.1 Comparison of Technology Routes
- 10.2 Selected Route and Process Flow Diagram
- 10.3 Unit Operations Involved
- 10.4 Chemical Reactions Involved
- 10.5 Mass Balance and Raw Material Requirements
- 10.6 Energy Balance
- 10.7 Quality Assurance Criteria and Technical Tests
- 10.8 By-products and Waste Handling
- 10.9 Technology Licensors / Providers
11. Project Details, Requirements and Costs
- 11.1 Land, Location and Site Development
- 11.1.1 Site Selection Criteria
- 11.1.2 Location Analysis
- 11.1.3 Land Requirement and Costs
- 11.1.4 Site Development Costs
- 11.2 Plant Layout
- 11.2.1 Layout Principles
- 11.2.2 Proposed Layout
- 11.2.3 Factors Influencing Layout
- 11.3 Civil Works and Buildings
- 11.4 Plant Machinery
- 11.4.1 Machinery Requirements and Specifications
- 11.4.2 Machinery Costs
- 11.4.3 Machinery Suppliers
- 11.5 Raw Materials
- 11.5.1 Requirements per Tonne of Output
- 11.5.2 Procurement and Sourcing
- 11.5.3 Costs
- 11.5.4 Suppliers
- 11.6 Packaging
- 11.6.1 Packaging Requirements
- 11.6.2 Packaging Costs
- 11.6.3 Packaging Suppliers
- 11.7 Storage and Material Handling
- 11.8 Transportation Requirements and Costs
- 11.9 Utilities
- 11.9.1 Power Requirements and Costs
- 11.9.2 Water Requirements and Costs
- 11.9.3 Steam, Fuel and Other Utilities
- 11.10 Manpower Requirements and Wages
12. Environment, Health, Safety and Sustainability
- 12.1 Effluent and Emissions Management
- 12.2 Hazard Classification and Safety Measures
- 12.3 Carbon Footprint
- 12.4 Green / Low-Carbon Process Options
13. Regulatory Procedures, Approvals and Certifications
- 13.1 Licences and Registrations
- 13.2 Environmental Clearances
- 13.3 Product Certifications (BIS, REACH, etc.)
- 13.4 Approval Timeline
14. Project Implementation Schedule
15. Project Economics
- 15.1 Capital Cost of the Project
- 15.2 Techno-Economic Parameters
- 15.3 Capacity Utilization and Ramp-up
- 15.4 Product Pricing and Margins
- 15.5 Income Projections
- 15.6 Expenditure Projections
- 15.7 Working Capital Requirement
- 15.8 Taxation
- 15.9 Depreciation
16. Financial Analysis
- 16.1 Projected Profit and Loss Account
- 16.2 Projected Cash Flow Statement
- 16.3 Projected Balance Sheet
- 16.4 Liquidity Analysis
- 16.5 Profitability Analysis (Payback, NPV, IRR, ROI)
- 16.6 Break-even Analysis
- 16.7 Debt Service Coverage Ratio (DSCR)
- 16.8 Sensitivity Analysis
- 16.9 Scenario and Uncertainty Analysis
17. Funding and Incentives
- 17.1 Means of Finance and Debt-Equity Structure
- 17.2 Loans and Financial Assistance
- 17.3 Government Schemes and Subsidies (PLI, State Policies)
18. Risk Assessment
- 18.1 Key Success Factors
- 18.2 Key Risk Factors
- 18.3 Risk Mitigation
19. Strategic Recommendations
20. Case Study of a Successful Venture
21. Appendix
- 21.1 Detailed Assumptions
- 21.2 Abbreviations
- 21.3 List of Tables and Figures
- 21.4 Sources
This page vs. the full report
| Data point | On this page (free) | In the full report |
|---|---|---|
| Total CapEx | One rounded range at one capacity | Exact figure at three capacities with a line-item breakup |
| CapEx breakup | Category shares (%) only | Cost, quantity and supplier for every machine |
| Operating cost | Share of raw materials, utilities and labor | Per-unit cost sheet with each input price and consumption |
| Profitability | Gross margin range and payback band | Exact IRR, NPV, ROI, break-even and DSCR |
| Financial statements | List of what is included | 10-year P&L, cash flow, balance sheet and Excel model |
| Sensitivity | One directional line | Full sensitivity and scenario tables |
| Process | Simplified flow diagram | Detailed process flow, mass and energy balance, operating conditions |
| Machinery | Names of the main machines | Specifications, capacity, cost and supplier list |
| Market | Headline size, growth and India demand trend | Segment, region, trade and price forecast tables |
| Suppliers and buyers | Supplier types and sourcing hubs | Named suppliers and buyers |
Fruit Juice project report: FAQs
How much does a fruit juice processing plant cost?
What is the gross margin of a fruit juice business?
How long is the payback on a juice plant?
What is the HS code for fruit juice?
Which fruits suit a multi-fruit juice plant?
What approvals does a juice plant need in the United States?
Why are juice prices such a risk for new plants?

About the analyst
Priyanka Mor, Senior Consultant
Senior Consultant at Credence Research Inc directing strategic market advisory, cross-border commercial due diligence and enterprise intelligence frameworks for global B2B clients. Combines quantitative modeling with executive advisory, translating macroeconomic variables and supply chain data into go-to-market blueprints, M&A screenings and competitive war-gaming strategies.
Related market research
- Juice Concentrates Market Size, Growth, Share and Forecast 2032
- Apple Juice Market Size, Trends, Growth and Forecast 2032
- Unconcentrated Orange Juice Market Size, Share and Forecast 2032
- Fruit Juice Packaging Market Size, Growth, Share & Forecast 2032
- Sparkling Juices Market Size, Share, Growth and Forecast 2025
- Non-Alcoholic Beverages Market Size, Growth and Forecast 2032
More plant project reports
- Guar Gum Powder Manufacturing Plant Project Report (DPR) 2026
- Shrimp Processing Plant Project Report (DPR) 2026
- Instant Coffee Manufacturing Plant Project Report (DPR) 2026
- Pectin Manufacturing Plant Project Report (DPR) 2026
- Parboiled White Rice Processing Plant Project Report (DPR) 2026
- Potato Processing Plant Prefeasibility Report 2026