
Quick answer
A copper sulphate plant converts copper scrap and sulphuric acid into blue pentahydrate crystals for agriculture, electroplating, mining and feed. A 10 tonne per day plant (about 3,000 tonnes a year) needs fixed CapEx of about USD 0.7–1.0 million at an Asian industrial park, plus USD 1.2–1.8 million of working capital at late-2026 LME copper prices. Gross margin runs 8–14% because copper is passed through, and payback typically takes 3–6 years.
Viable for operators with secure scrap supply, copper hedging and committed farm, plating or feed buyers; risky as an unhedged commodity play.
Copper Sulphate plant: key highlights
| Parameter | Indicative value | Note |
|---|---|---|
| Plant capacity | 10 TPD (about 3,000 TPA) | Pentahydrate crystals, 300 working days |
| Total CapEx | USD 0.7–1.0 million | Asian industrial park; about USD 1.5–2.5 million at a U.S. or EU site (assumed); excludes working capital |
| Raw material share of operating cost | 88–94% | Copper scrap alone is about 85–90% |
| Gross margin | 8–14% | Copper is priced through to buyers off LME |
| Payback period | 3–6 years | At 70–80% utilization, including ramp-up |
| IRR | Available in report | Post-tax, 10-year model |
| Break-even | Available in report | Capacity utilization basis |
Ranges assume a 10 TPD scrap-and-acid pentahydrate plant on one acre in an Asian chemical park (Gujarat GIDC rates at 90 rupees per USD), LME copper near USD 14,400 per tonne (October 2026), scrap 3–8% below LME, bulk prices 15–25% above copper content value and 70–80% utilization; U.S./EU costs are assumed multiples. The full report is customizable to any country.
What is copper sulphate?
Copper sulphate pentahydrate (CuSO4·5H2O) is a blue crystalline salt that contains about 25.4% copper and 12.8% sulphur by weight. Producers sell three main grades: an agricultural grade used as a fungicide and copper micronutrient, typically with at least 24% copper, a technical grade of 98% minimum purity, and higher-purity electroplating, feed and laboratory grades with tight limits on iron, nickel, lead and arsenic.
The Harmonized System classifies the product under HS 2833.25, sulphates of copper. Farmers mix it with lime to make Bordeaux mixture against grape downy mildew, potato late blight, coffee leaf rust and citrus diseases, and water utilities use it as an algaecide. Industrial buyers use it in acid copper electroplating baths for circuit boards, as an activator in zinc and lead ore flotation, in animal feed premixes, in wood preservatives and as a feedstock for other copper compounds such as tribasic copper sulphate.
Copper sulphate market overview and global demand
Global trade gives the clearest public measure of the market. UN Comtrade data published on the World Bank WITS portal show that reporting countries exported about USD 750 million of copper sulphates (HS 283325) in 2023. South Africa, Taiwan, the United States, Turkey, Mexico, Poland, China and Brazil led, together accounting for about three-quarters of the value. Credence Research estimates the downstream copper fungicides market at USD 1.79 billion in 2024, growing at an 8.1% CAGR through 2032, which signals steady pull from crop protection.
Demand clusters by end use and region. Europe's vineyards and orchards rely on copper sprays, including in organic farming, while Latin American coffee, banana and citrus growers and South Asian plantation crops buy seasonally before wet seasons. North American utilities and feed premix makers buy year-round, and East Asian circuit board and plating lines take high-purity grades. Mining regions in Latin America, Africa and Australia use it in flotation. India illustrates a self-sufficient producer, with Comtrade recording only about 73 tonnes of imports in 2023 and exports rising to USD 8.4 million in 2024, mainly to South Africa, Russia and Italy.
Price, rather than volume, is the main swing factor. Invoices track the London Metal Exchange copper price almost one for one, so a 10% move in copper shifts the product price by about 8%. That linkage pushed farm prices up sharply in 2026 as LME copper set records.
Copper sulphate manufacturing process
The scrap route suits small and mid-sized plants because it uses bright copper wire, cable granules or copper-rich residues instead of mined ore. Large integrated producers also crystallize it from copper refinery electrolyte bleed or from solvent extraction of heap leach solutions. The overall scrap reaction is Cu + H2SO4 + ½O2 + 4H2O → CuSO4·5H2O, so each tonne of pentahydrate needs about 0.255 tonnes of copper and 0.39 tonnes of 100% sulphuric acid before process losses.
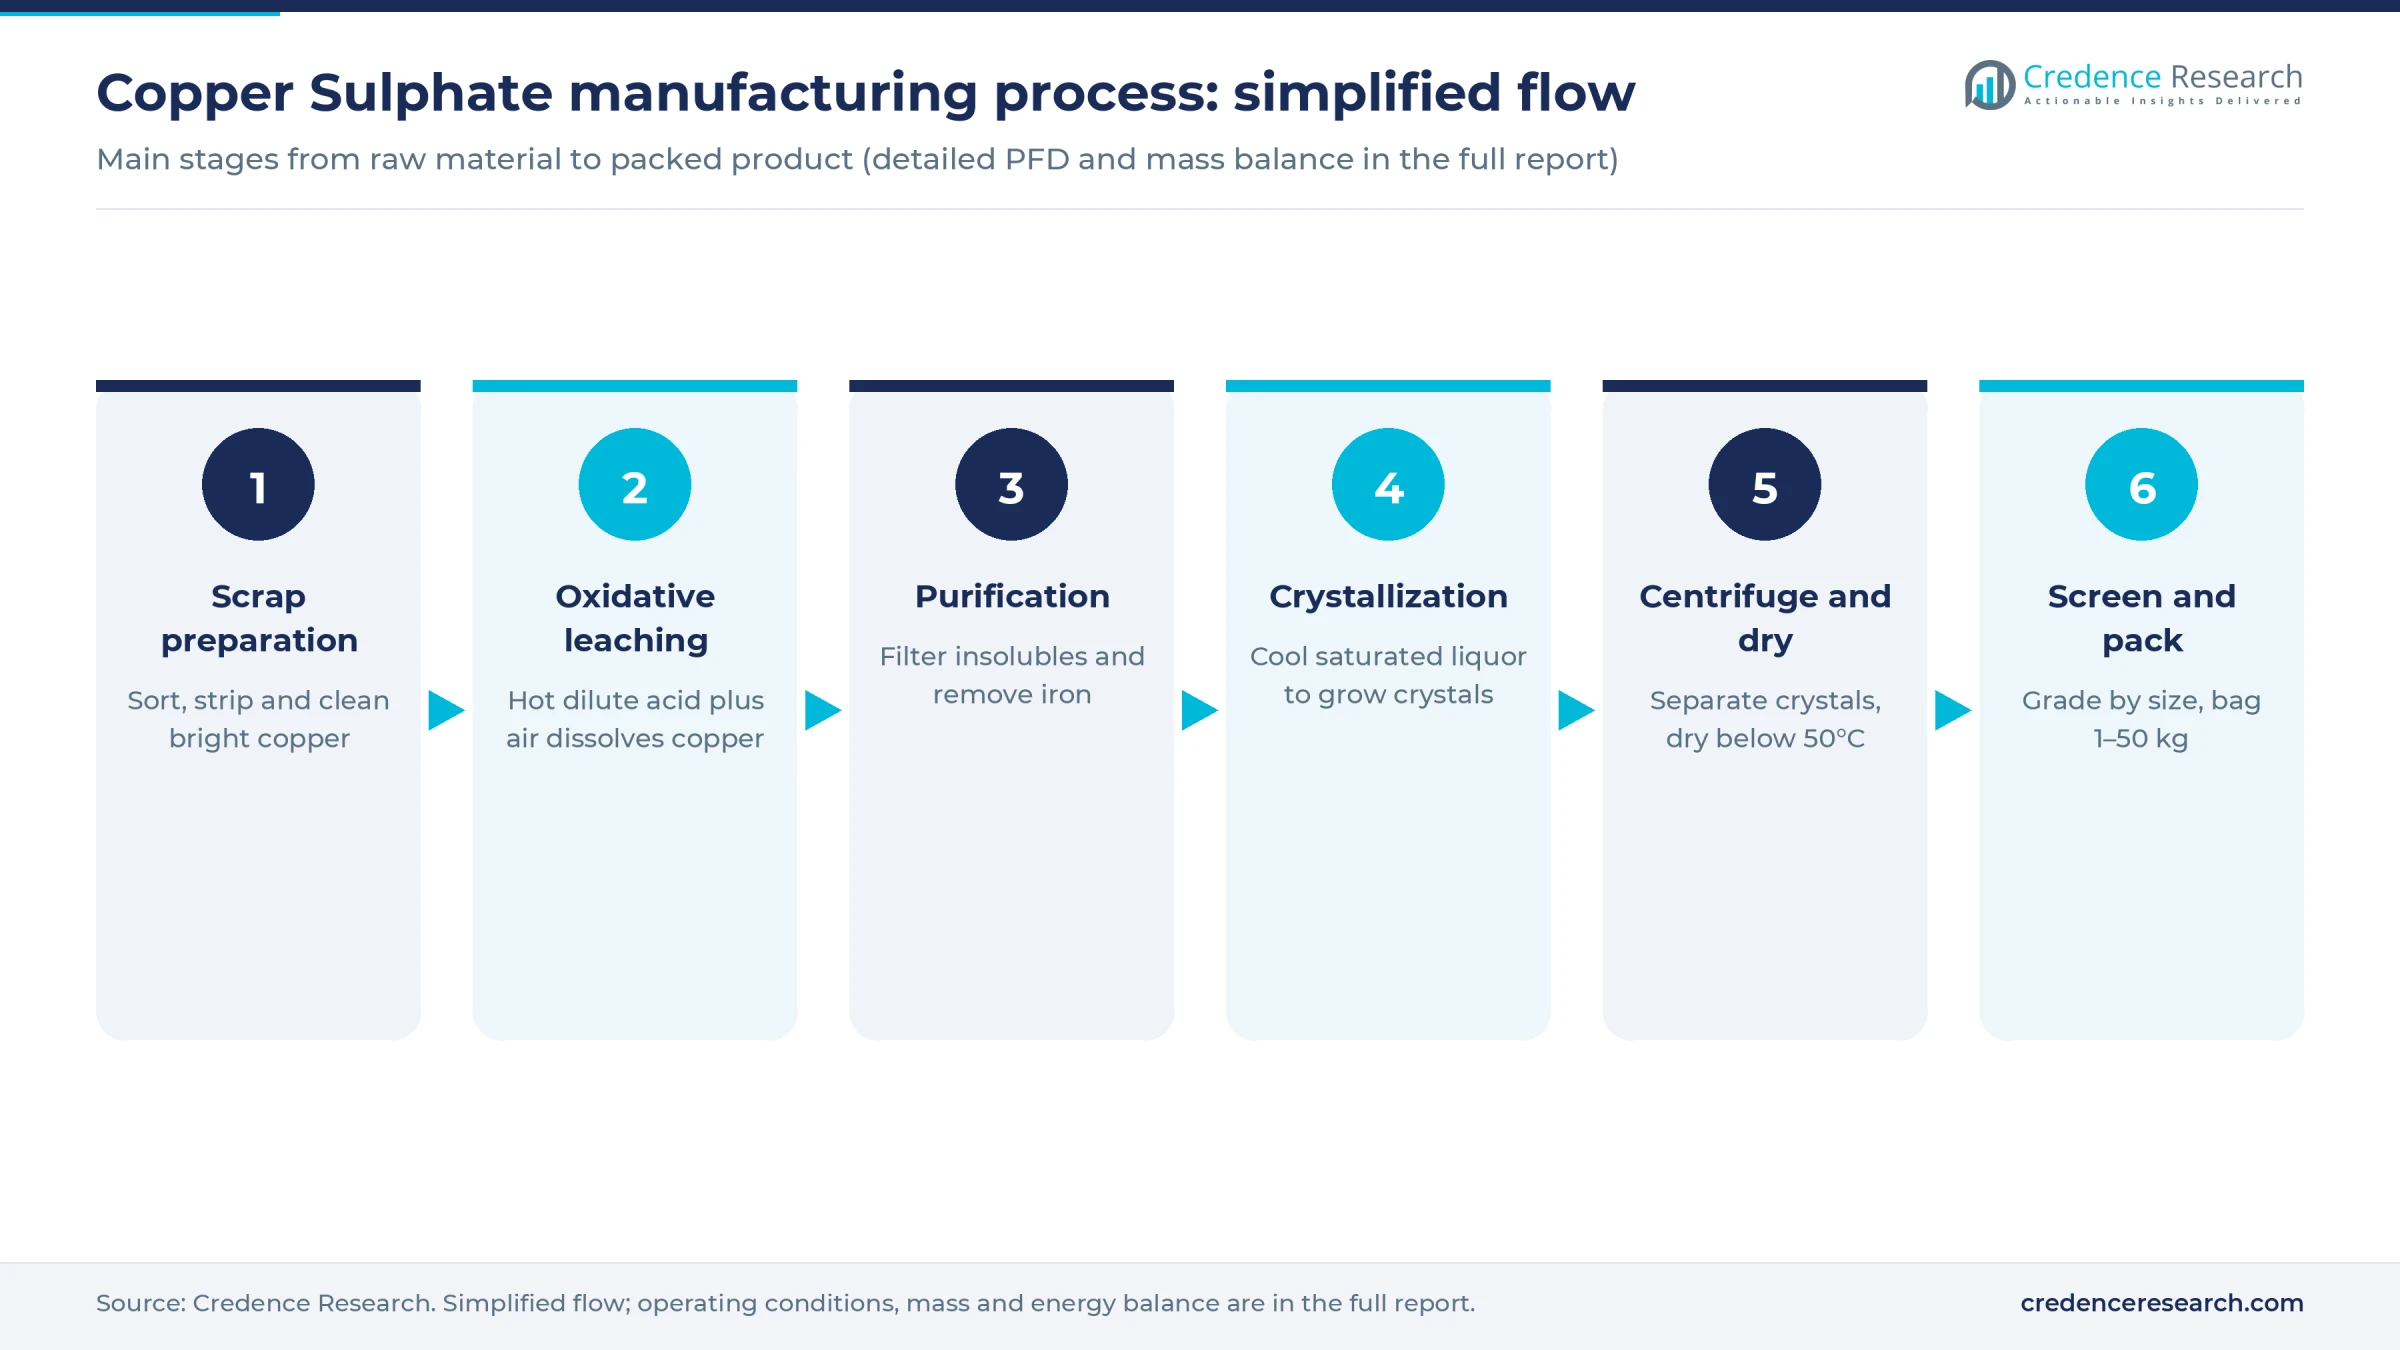
- Scrap preparation. Operators sort scrap, strip insulation and remove brass, tinned and soldered pieces, because zinc, tin and lead end up as impurities in the crystals.
- Oxidative leaching. Scrap sits in acid-resistant towers or reactors while hot dilute sulphuric acid circulates and compressed air is blown through the bed. Air, not acid alone, oxidizes the metal, and plants handling dirty scrap often roast it to copper oxide first.
- Purification. The hot liquor is filtered to remove insolubles, and iron is precipitated with an oxidant and a slight pH adjustment. Plating and feed grades get a second polishing filtration.
- Crystallization. Saturated liquor at about 80–90°C flows to cooling crystallizers. Slow, still cooling grows the large crystals farmers prefer, while agitated cooling gives fine snow crystals for blending and feed.
- Centrifuging and drying. Basket centrifuges separate crystals from mother liquor, which returns to leaching. Crystals dry below about 50°C, because pentahydrate starts losing water of crystallization near 60°C and turns pale and dusty.
- Screening and packing. Vibrating screens grade the product by size before packing in 25 kg bags, 1-tonne bulk bags or small farmer packs.
Mother liquor slowly accumulates nickel, iron and free acid, so plants bleed a portion to effluent treatment. Copper recovery above 98% is the main efficiency lever, since one lost kilogram of copper costs more than the entire conversion cost of a kilogram of finished crystals.
Copper sulphate plant setup cost
The indicative build is a 10 tonne per day scrap-to-crystal plant, about 3,000 tonnes a year, on one acre of serviced industrial land. Fixed CapEx comes to about USD 0.7–1.0 million at an Asian chemical park and an assumed USD 1.5–2.5 million at a U.S. or EU site, where civil works, equipment fabrication and permitting cost more. Working capital is excluded, and the full report can be recast for any country.
Land shows how each row was built. In Gujarat, a major Asian chemical hub, GIDC allotment rates revised in August 2026 work out to about USD 42 per square meter at Dahej and USD 53 at Ankleshwar, converted at 90 rupees per dollar, as reported by DeshGujarat. A 4,000 square meter plot therefore costs about USD 170,000–210,000, roughly 23% of CapEx at the midpoint. Rural U.S. industrial land can cost less per acre, assumed at USD 50,000–150,000, while serviced EU chemical parks often charge more, so the land share swings widely by location.
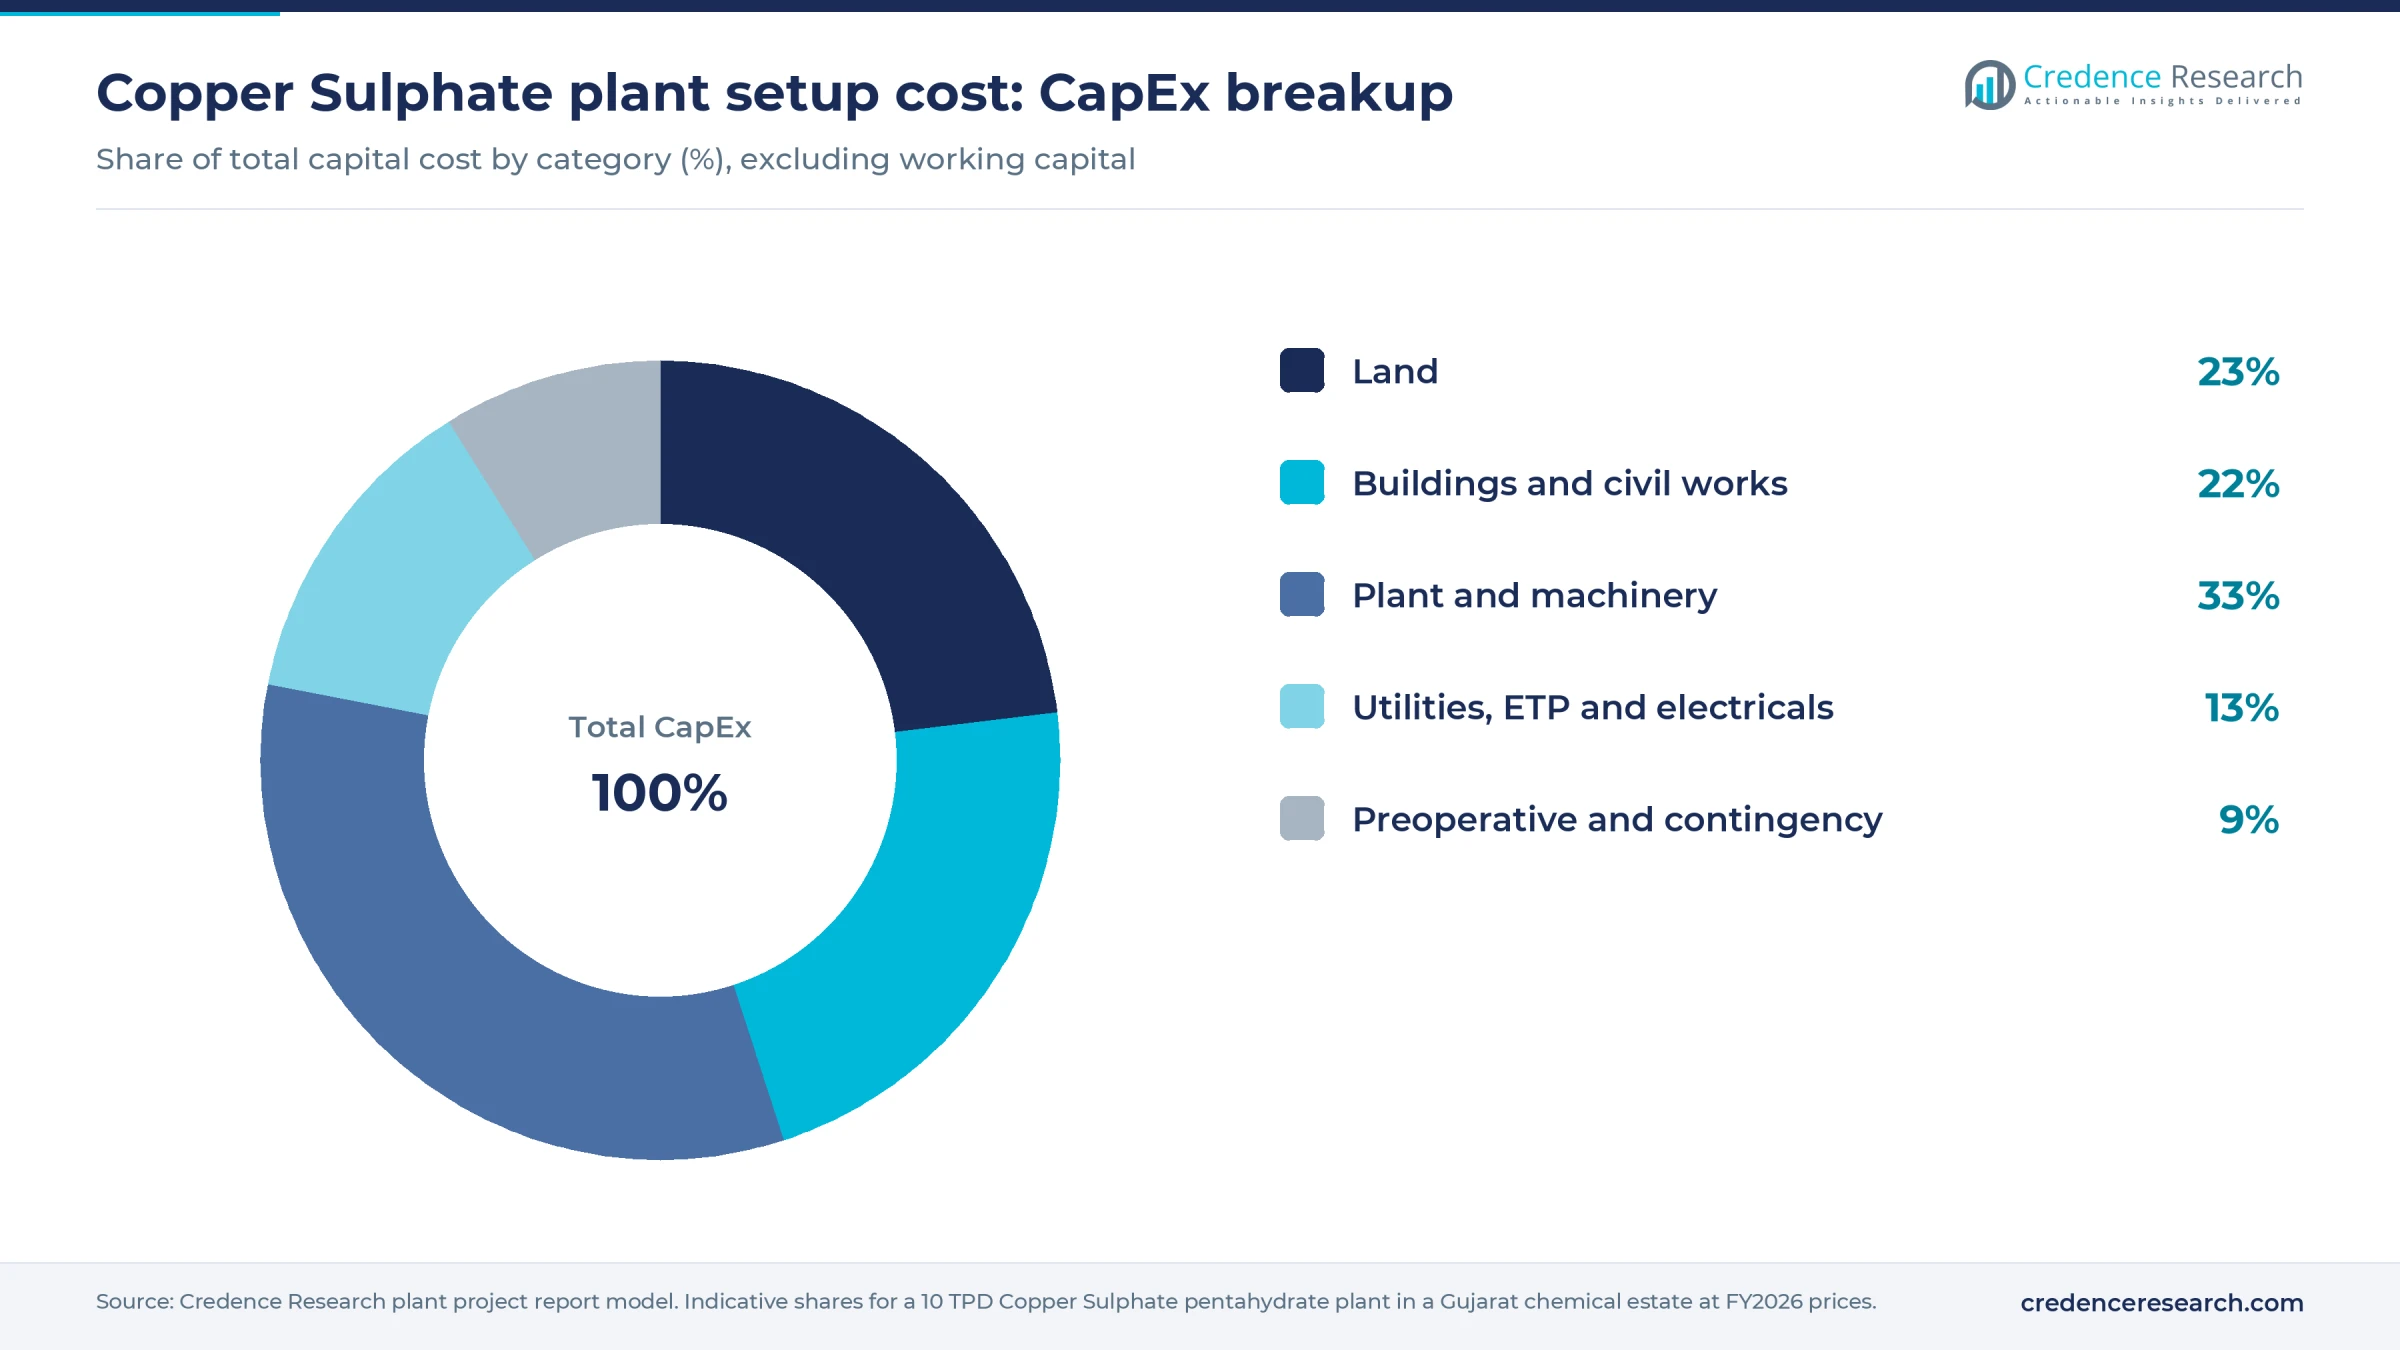
At the Asian benchmark, civil works for about 1,200 square meters of acid-resistant sheds, tiled floors and bunded tank farms add USD 160,000–210,000. Plant and machinery, priced from supplier listings for FRP and rubber-lined reactors, basket centrifuges and low-temperature dryers plus piping and erection, account for USD 220,000–330,000. Utilities, effluent treatment, a fume scrubber and electrical work add USD 90,000–130,000, and preoperative costs and contingency make up the balance.
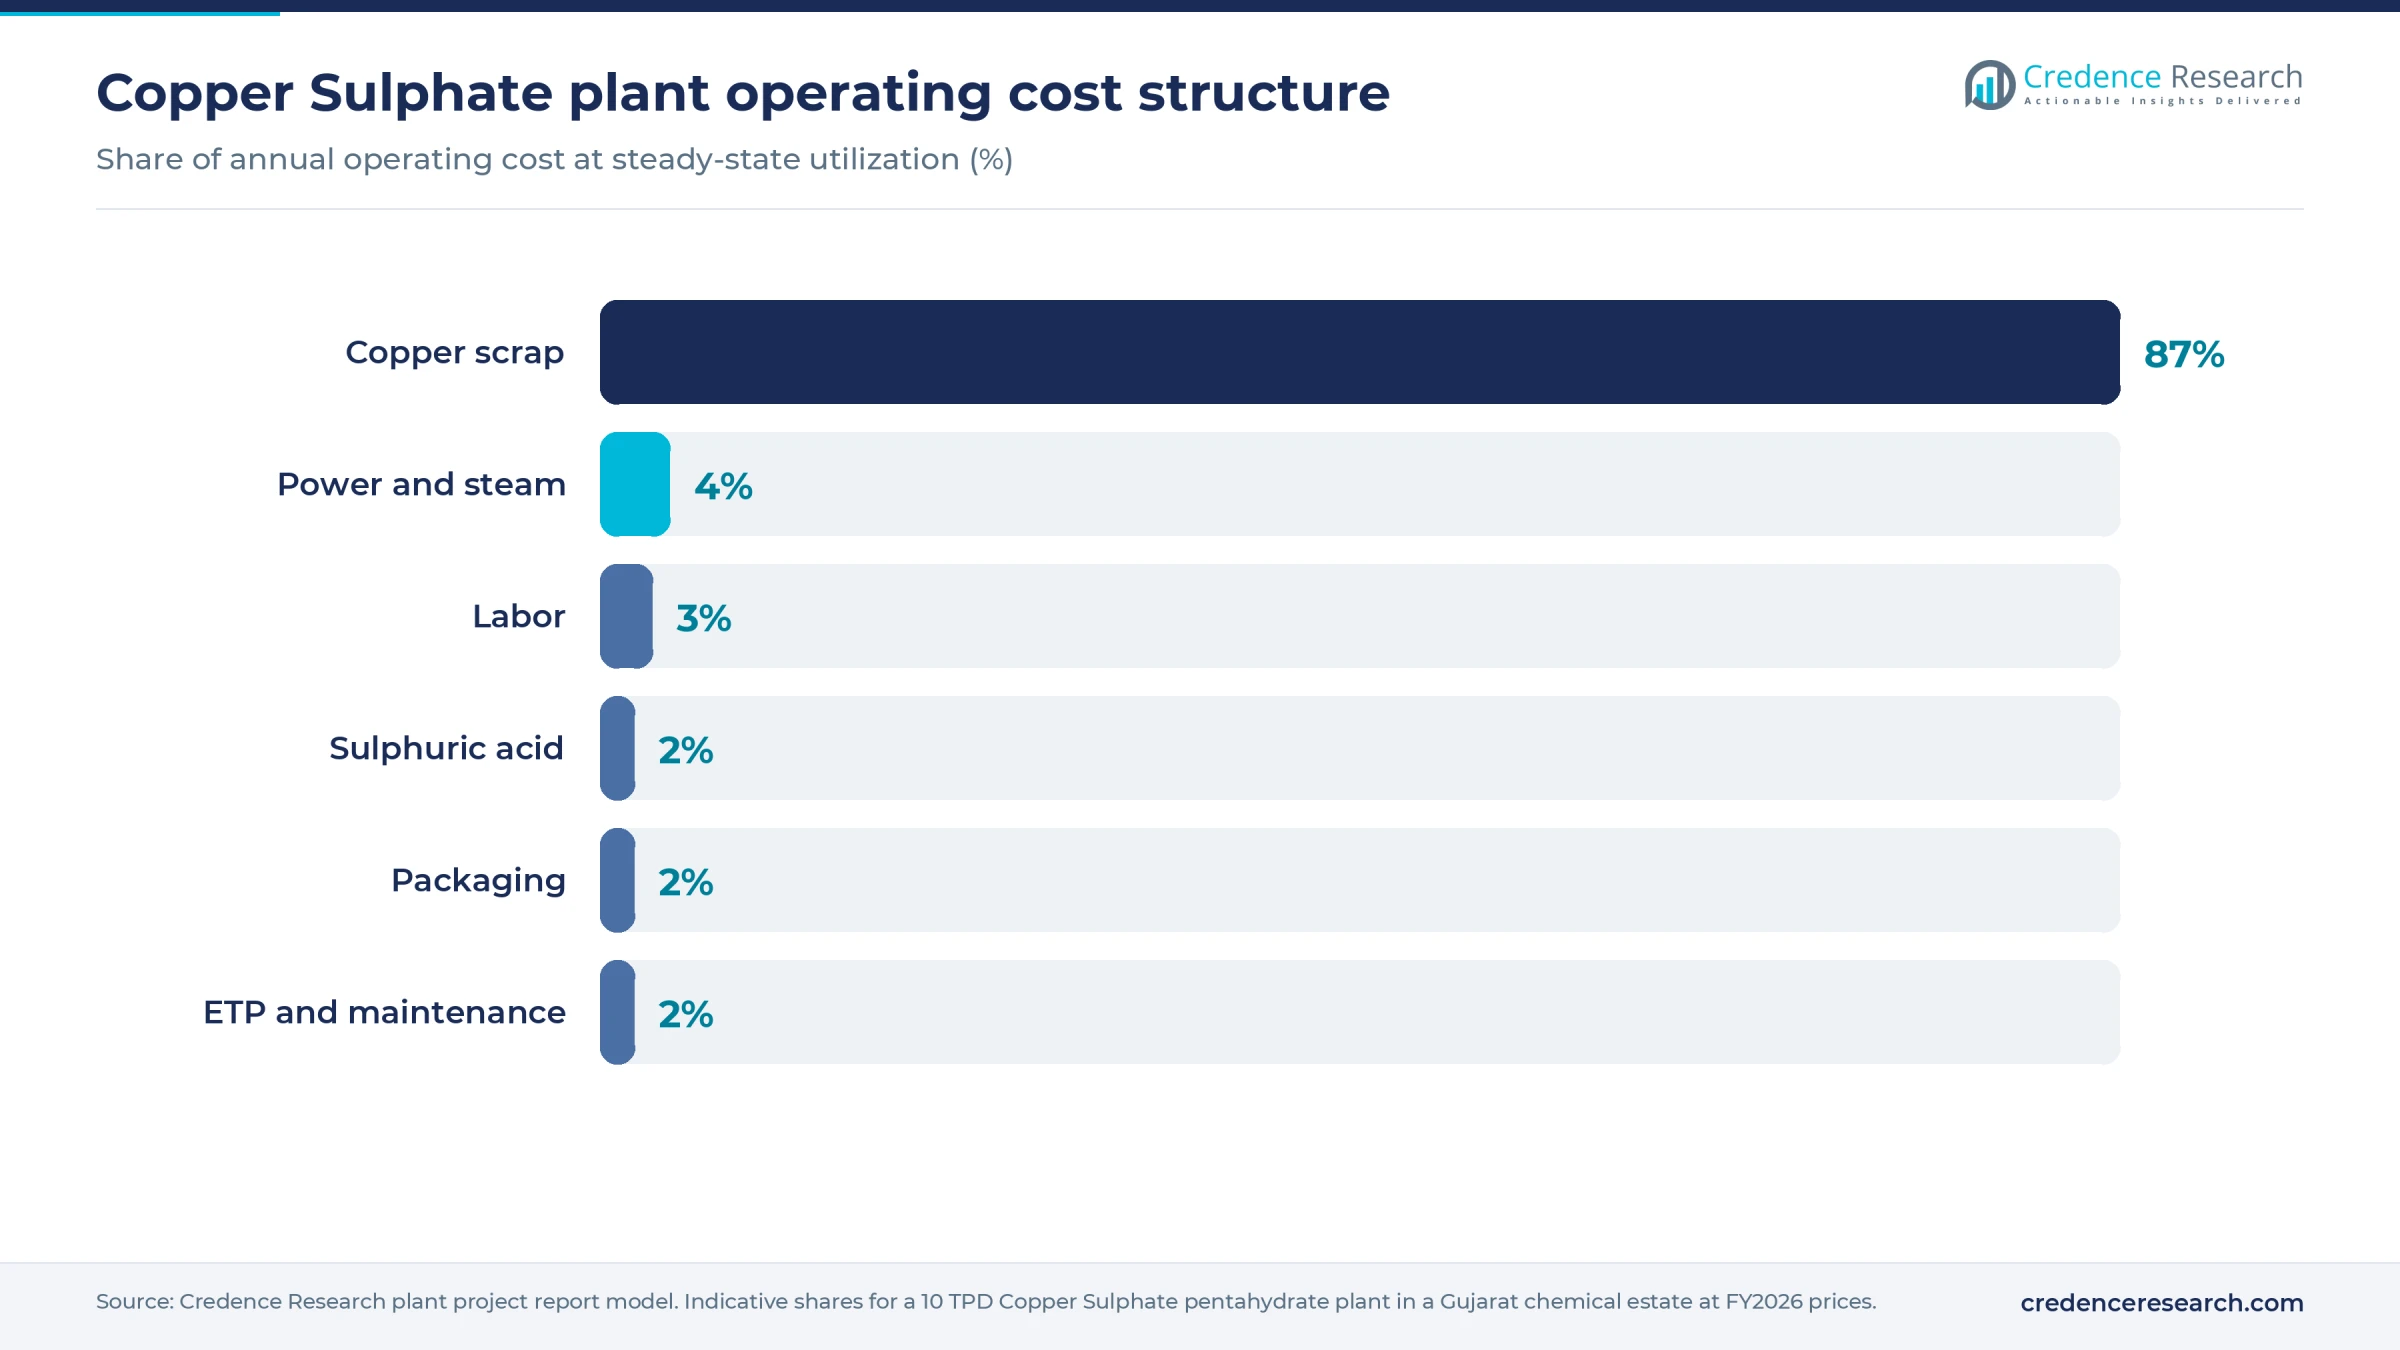
Copper makes up roughly 85–90% of cash operating cost at late-2026 prices, while sulphuric acid adds about 2% and power, labor, packaging and effluent treatment together about 10%. Working capital is the hidden investment. With LME copper near USD 14,400 per tonne in October 2026, 45–60 days of scrap, liquor, stock and receivables can tie up USD 1.2–1.8 million, more than the fixed plant at an Asian site.
Machinery and raw materials for a copper sulphate plant
Core equipment for a 10 tonne per day line includes the following items.
- Acid-resistant leaching towers or FRP reactors with air spargers and circulation pumps
- An air blower or compressor and a heat exchanger or small boiler to hold liquor at 80–90°C
- A filter press and polishing filters for liquor clarification
- Cooling crystallizers with jacket or coil cooling and a cooling tower or chiller
- Rubber-lined or stainless steel basket centrifuges
- A low-temperature fluid bed or tray dryer, vibrating screens and a bagging scale
- A diked sulphuric acid tank, mother liquor tanks, a fume scrubber and an effluent treatment plant
- A quality lab able to test copper, iron, lead, cadmium and arsenic
Copper scrap is the critical input. The United States, Japan, Germany, the United Kingdom and other mature economies are net exporters of copper scrap, while China, India, Southeast Asia and Turkey are large importers and recyclers. Scrap prices follow LME or COMEX copper less a grade discount, a dynamic tracked in the copper and copper alloy scrap and recycling market. Sulphuric acid is a by-product of copper, zinc and nickel smelters in Chile, China, Japan and Europe and is also made at fertilizer complexes, so supply is regional; trends are covered in the sulfuric acid market outlook. Filter aids, neutralizing lime and bags complete the bill of materials.
Copper sulphate business profit margin and ROI
Copper sulphate behaves as a copper pass-through product. Buyers price it off its copper content, often as the prior month's LME average plus a premium, so the producer earns a conversion spread rather than a large percentage margin. With LME copper near USD 14,400 per tonne and scrap 3–8% below LME, the copper in one tonne of pentahydrate costs about USD 3,450–3,650, and acid plus conversion add USD 200–380. Comtrade export unit values from Turkey, Poland and Mexico in 2023 sat about 15–30% above contained copper value, which implies bulk prices of roughly USD 4,200–4,600 per tonne today and a gross margin in the 8–14% range.
Three operating factors move that margin, and copper recovery comes first, since a one-point drop costs about USD 35 per tonne. Grade mix comes second, because plating, feed and pesticide-registered grades command premiums over bulk crystals. Inventory timing comes third, because a plant holding six weeks of copper gains when prices rise and loses when they fall, so producers hedge on LME, COMEX or MCX.
At 70–80% utilization, post-tax cash profit supports a payback of about 3–6 years on fixed CapEx plus the working capital margin at an Asian site, and longer at higher-cost locations. The main risk is a sharp copper correction while stock is high.
| Metric | Value |
|---|---|
| Project IRR (post-tax) | Available in report |
| NPV | Available in report |
| ROI | Available in report |
| DSCR | Available in report |
| Break-even utilization | Available in report |
How to start a copper sulphate business with the right licenses
Every plant needs business and tax registration, zoning and building permits, an environmental permit covering air emissions, wastewater and copper-bearing sludge, occupational safety approval for acid handling, and export or import registration for traded scrap and product. The label claim then decides the product approvals. Industrial grades need chemical inventory compliance, fungicide and algaecide grades need pesticide registration, and fertilizer and feed grades need agriculture or feed authority clearance.
| Market | Key approvals for copper sulphate |
|---|---|
| United States | Pesticide product registration and establishment registration with EPA under FIFRA for fungicide or algaecide labels (copper sulfate pentahydrate crystals are registered, for example EPA Reg. No. 56576-1); TSCA inventory compliance for industrial grade; state fertilizer and feed registration for nutrient uses; state air and water permits |
| European Union | REACH registration with ECHA for volumes of 1 tonne a year or more; copper compounds approved under Regulation (EC) No 1107/2009 with a cap of 28 kg copper per hectare over seven years, plus national product authorization; EU Fertilizing Products Regulation (EU) 2019/1009 for CE-marked micronutrients; approval as a feed additive establishment under Regulation (EC) No 183/2005 (copper(II) sulphate pentahydrate is authorized under Implementing Regulation (EU) 2018/1039) |
| India | Fertilizer Control Order registration for the micronutrient grade (24% copper, 12% sulphur minimum); CIB&RC registration and a state manufacturing license under the Insecticides Act, 1968 for fungicide use; Red category pollution board consent |
Key copper sulphate manufacturers and recent market developments
Production is fragmented between a few large specialists and many regional makers. Manica in Italy started with copper sulphate pentahydrate and still produces it alongside Bordeaux mixture and copper oxychloride for Mediterranean agriculture. Old Bridge Chemicals makes copper sulfate in New Jersey for U.S. feed and industrial buyers, and Químicos Águila in Jalisco has specialized in pentahydrate for feed premixes since 1997. Tartana Minerals in Queensland crystallizes it from heap leach solutions. In India, a 2013 CIB&RC list named nine registrants of the technical grade, and SPIC markets a 24% copper micronutrient grade, linking the business to the agricultural micronutrients market.
- July 2026. Tartana Minerals restarted pentahydrate production after a chiller upgrade and targeted nameplate output of about 350 tonnes a month, with prices tied to the prior month's LME average, as Kalkine Media reported.
- August 2026. LME cash copper set an all-time high of about USD 14,850 per tonne on Aug. 17, according to Cochilco data reported by Mining Reporters.
What's inside the Copper Sulphate project report PDF
The report runs to 21 chapters. Open a chapter to see its sections.
1. Preface
2. Scope and Methodology
- 2.1 Objectives of the Study
- 2.2 Stakeholders
- 2.3 Research Methodology
- 2.4 Data Sources and Key Assumptions
3. Executive Summary
- 3.1 Market Snapshot
- 3.2 Project at a Glance (Capacity, CapEx, OpEx)
- 3.3 Key Financial Indicators (IRR, NPV, Payback, Break-even)
- 3.4 Feasibility Verdict
4. Product Overview
- 4.1 Copper Sulphate Definition and Properties
- 4.2 Grades and Specifications (BIS / ISO / ASTM)
- 4.3 HS Code and Classification
- 4.4 Key Applications
- 4.5 Substitutes
5. Global Copper Sulphate Market
- 5.1 Market Overview
- 5.2 Historical and Current Market Performance (Volume and Value)
- 5.3 Market Breakup by Grade / Type
- 5.4 Market Breakup by End-Use Industry
- 5.5 Market Breakup by Region
- 5.6 Market Drivers, Restraints and Trends
- 5.7 Value Chain Analysis
- 5.8 Market Forecast
6. Target Country Copper Sulphate Market Analysis
- 6.1 Demand and Supply Analysis
- 6.2 Installed Capacity vs Demand Gap
- 6.3 Import Dependence
- 6.4 Demand Forecast by End-Use
7. Trade Analysis
- 7.1 Imports by Volume, Value and Country
- 7.2 Exports by Volume, Value and Country
- 7.3 Trade Balance and Opportunities
8. Price Analysis
- 8.1 Historical Copper Sulphate Price Trends by Region
- 8.2 Raw Material / Feedstock Price Trends and Linkage
- 8.3 Price Forecast
- 8.4 Margins Across the Value Chain
9. Competitive Landscape
- 9.1 Market Structure
- 9.2 Key Players and Installed Capacities
- 9.3 Profiles of Key Players
- 9.4 Recent Developments (Expansions, M&A, New Plants)
10. Manufacturing Process and Technology
- 10.1 Comparison of Technology Routes
- 10.2 Selected Route and Process Flow Diagram
- 10.3 Unit Operations Involved
- 10.4 Chemical Reactions Involved
- 10.5 Mass Balance and Raw Material Requirements
- 10.6 Energy Balance
- 10.7 Quality Assurance Criteria and Technical Tests
- 10.8 By-products and Waste Handling
- 10.9 Technology Licensors / Providers
11. Project Details, Requirements and Costs
- 11.1 Land, Location and Site Development
- 11.1.1 Site Selection Criteria
- 11.1.2 Location Analysis
- 11.1.3 Land Requirement and Costs
- 11.1.4 Site Development Costs
- 11.2 Plant Layout
- 11.2.1 Layout Principles
- 11.2.2 Proposed Layout
- 11.2.3 Factors Influencing Layout
- 11.3 Civil Works and Buildings
- 11.4 Plant Machinery
- 11.4.1 Machinery Requirements and Specifications
- 11.4.2 Machinery Costs
- 11.4.3 Machinery Suppliers
- 11.5 Raw Materials
- 11.5.1 Requirements per Tonne of Output
- 11.5.2 Procurement and Sourcing
- 11.5.3 Costs
- 11.5.4 Suppliers
- 11.6 Packaging
- 11.6.1 Packaging Requirements
- 11.6.2 Packaging Costs
- 11.6.3 Packaging Suppliers
- 11.7 Storage and Material Handling
- 11.8 Transportation Requirements and Costs
- 11.9 Utilities
- 11.9.1 Power Requirements and Costs
- 11.9.2 Water Requirements and Costs
- 11.9.3 Steam, Fuel and Other Utilities
- 11.10 Manpower Requirements and Wages
12. Environment, Health, Safety and Sustainability
- 12.1 Effluent and Emissions Management
- 12.2 Hazard Classification and Safety Measures
- 12.3 Carbon Footprint
- 12.4 Green / Low-Carbon Process Options
13. Regulatory Procedures, Approvals and Certifications
- 13.1 Licences and Registrations
- 13.2 Environmental Clearances
- 13.3 Product Certifications (BIS, REACH, etc.)
- 13.4 Approval Timeline
14. Project Implementation Schedule
15. Project Economics
- 15.1 Capital Cost of the Project
- 15.2 Techno-Economic Parameters
- 15.3 Capacity Utilization and Ramp-up
- 15.4 Product Pricing and Margins
- 15.5 Income Projections
- 15.6 Expenditure Projections
- 15.7 Working Capital Requirement
- 15.8 Taxation
- 15.9 Depreciation
16. Financial Analysis
- 16.1 Projected Profit and Loss Account
- 16.2 Projected Cash Flow Statement
- 16.3 Projected Balance Sheet
- 16.4 Liquidity Analysis
- 16.5 Profitability Analysis (Payback, NPV, IRR, ROI)
- 16.6 Break-even Analysis
- 16.7 Debt Service Coverage Ratio (DSCR)
- 16.8 Sensitivity Analysis
- 16.9 Scenario and Uncertainty Analysis
17. Funding and Incentives
- 17.1 Means of Finance and Debt-Equity Structure
- 17.2 Loans and Financial Assistance
- 17.3 Government Schemes and Subsidies (PLI, State Policies)
18. Risk Assessment
- 18.1 Key Success Factors
- 18.2 Key Risk Factors
- 18.3 Risk Mitigation
19. Strategic Recommendations
20. Case Study of a Successful Venture
21. Appendix
- 21.1 Detailed Assumptions
- 21.2 Abbreviations
- 21.3 List of Tables and Figures
- 21.4 Sources
This page vs. the full report
| Data point | On this page (free) | In the full report |
|---|---|---|
| Total CapEx | One rounded range at one capacity | Exact figure at three capacities with a line-item breakup |
| CapEx breakup | Category shares (%) only | Cost, quantity and supplier for every machine |
| Operating cost | Share of raw materials, utilities and labor | Per-unit cost sheet with each input price and consumption |
| Profitability | Gross margin range and payback band | Exact IRR, NPV, ROI, break-even and DSCR |
| Financial statements | List of what is included | 10-year P&L, cash flow, balance sheet and Excel model |
| Sensitivity | One directional line | Full sensitivity and scenario tables |
| Process | Simplified flow diagram | Detailed process flow, mass and energy balance, operating conditions |
| Machinery | Names of the main machines | Specifications, capacity, cost and supplier list |
| Market | Headline size, growth and India demand trend | Segment, region, trade and price forecast tables |
| Suppliers and buyers | Supplier types and sourcing hubs | Named suppliers and buyers |
Copper Sulphate project report: FAQs
How much does it cost to set up a copper sulphate plant?
How much copper and acid does one tonne of copper sulphate need?
What is the profit margin in copper sulphate manufacturing?
Which licenses does a copper sulphate plant need?
Why does the LME copper price matter so much?
Who buys copper sulphate?
What is the payback period for a copper sulphate plant?

About the analyst
Nisha Gupta, Senior Research Analyst
Nisha Gupta is a Senior Research Analyst at Credence Research Inc. who works across industry domains, including packaging, automotive parts and machinery. Her focus is the modelling engine behind each study: she builds quantitative market databases and econometric forecasting frameworks, and developed automated Excel-based market modelling templates that cut client turnaround time by 30%.
Related market research
- Electroplating Market Size, Trends, Share and Forecast 2032
- Chemical Fungicides Market Size, Share and Growth Report 2032
- Crop Micronutrient Market Size, Growth, Share and Forecast 2032
- Feed Micronutrients Market Size, Growth, Share and Forecast 2032
- Fungicide Active Ingredients Market Size, Share and Forecast 2032
More plant project reports
- Potato Processing Plant Prefeasibility Report 2026
- Corn Starch Manufacturing Plant Project Report (DPR) 2026
- Ceiling Fan Manufacturing Plant Project Report (DPR) 2026
- Cassava Starch Manufacturing Plant Project Report (DPR) 2026
- Cassava Processing Plant Project Report (DPR) 2026
- Avocado Processing Plant Project Report (DPR) 2026