
Quick answer
A vinegar plant ferments alcohol from spirit, fruit, grain or sugar into acetic acid, then filters, dilutes and packs it. This overview models a greenfield submerged-fermentation plant making 10,000 tonnes a year, with estimated CapEx of USD 5–11 million depending on cost region. Gross margin is estimated at 20–40%, with payback at 4–11 years, because packaging and freight weigh heavily on a low-priced liquid.
Viable as a regional, contract-backed plant with a share of fruit or specialty vinegar, but weak if built to sell only commodity white vinegar over long distances.
Vinegar plant: key highlights
| Parameter | Indicative value | Note |
|---|---|---|
| Plant capacity | 10,000 tonnes a year | About 7,500 tonnes sold at 75% utilization, at 5% acidity |
| Total CapEx | USD 5–11 million | Greenfield submerged plant with filling, excludes USD 0.6–1.2 million working capital |
| Raw material share of operating cost | 25–35% | Alcohol or fruit feedstock; packaging is about as large |
| Gross margin | 20–40% | After feedstock, packaging and direct conversion |
| Payback period | 4–11 years | Includes about one year of ramp-up; depends on product mix and site cost |
| IRR | Available in report | Post-tax, 10-year model |
| Break-even | Available in report | Capacity utilization basis |
Ranges assume a 10,000-tonne-a-year greenfield submerged-fermentation plant at 5% acidity, 75% utilization and 2026 prices, in an Asian industrial park at the low end and a U.S. or EU site at the high end. Selling price of USD 0.60–0.80 per kg and all feedstock, packaging and land rates are assumed. CNY at about 7.8 per USD (2006) and INR at about 85 per USD are assumed. The full report can be customized to any country or region.
What is vinegar?
Vinegar is a dilute solution of acetic acid made by a two-stage fermentation, in which yeast turns sugar into alcohol and Acetobacter bacteria then oxidize that alcohol with air. Plants usually name the grade by feedstock: white or spirit vinegar from dilute distilled alcohol, cider from apples, wine and balsamic from grapes, malt from barley, rice vinegar, and sugar or molasses vinegar.
The Harmonized System classifies vinegar, and substitutes obtained from acetic acid, under 2209.00. Food-grade fermented vinegar is a different product from synthetic diluted acetic acid, which some markets allow only with distinct labeling. It also differs from wood vinegar, a pyrolysis byproduct used mostly outside the kitchen.
Buyers fall into three groups. Households and restaurants buy bottled table vinegar. Ketchup, mayonnaise, pickle and dressing makers buy bulk food-grade vinegar by tanker or tote, often at higher strength. A smaller group buys it as a natural preservative, a cleaning product or the base of apple cider vinegar supplements. The grade decides the economics, since white vinegar sells on price while cider and aged vinegars sell on origin and flavor.
Vinegar market overview and global demand
Credence Research does not publish a single global vinegar value, but its Asia Pacific vinegar market report gives the largest regional marker. It values the region at USD 2.65 billion in 2025, rising to USD 3.94 billion by 2035 at a 3.99% CAGR, with East Asia holding 70.9% of 2025 value on Chinese and Japanese brewing. That is a steady staple market, not a growth story, and new capacity has to win share from existing suppliers.
Trade is small relative to consumption because vinegar is mostly water and rarely justifies long freight. UN Comtrade data for 2023 show world exports above USD 800 million under heading 2209. Italy led with 41%, or about USD 332 million, followed by the United States at USD 78 million, Spain at USD 59 million, France at USD 48 million and Germany at USD 43 million. The United States was the largest importer at USD 168 million, ahead of Germany at USD 88 million and France at USD 70 million. About 72% of U.S. import value came from Italy.
Those figures show where value concentrates. Italy's lead rests on balsamic rather than volume, while white vinegar is largely made near its customers. The Modena protected-origin sector alone produces about 93–95 million liters a year, exports more than 93% of it to over 130 countries and reports export value above EUR 380 million for 2025. U.S. volumes for that product fell about 3% in 2025, a reminder that premium demand also has limits.
Demand is broadest where condiment makers and packaged food plants cluster. For a new entrant, a named industrial customer within a few hundred kilometers usually matters more than any global growth rate.
Vinegar manufacturing process
The modeled plant uses submerged acetification, the standard route for industrial volume. Traditional surface and drip methods take weeks or months, whereas aerated industrial vessels finish a cycle in about one to two days. The steps below assume a mixed output of white and fruit vinegar.
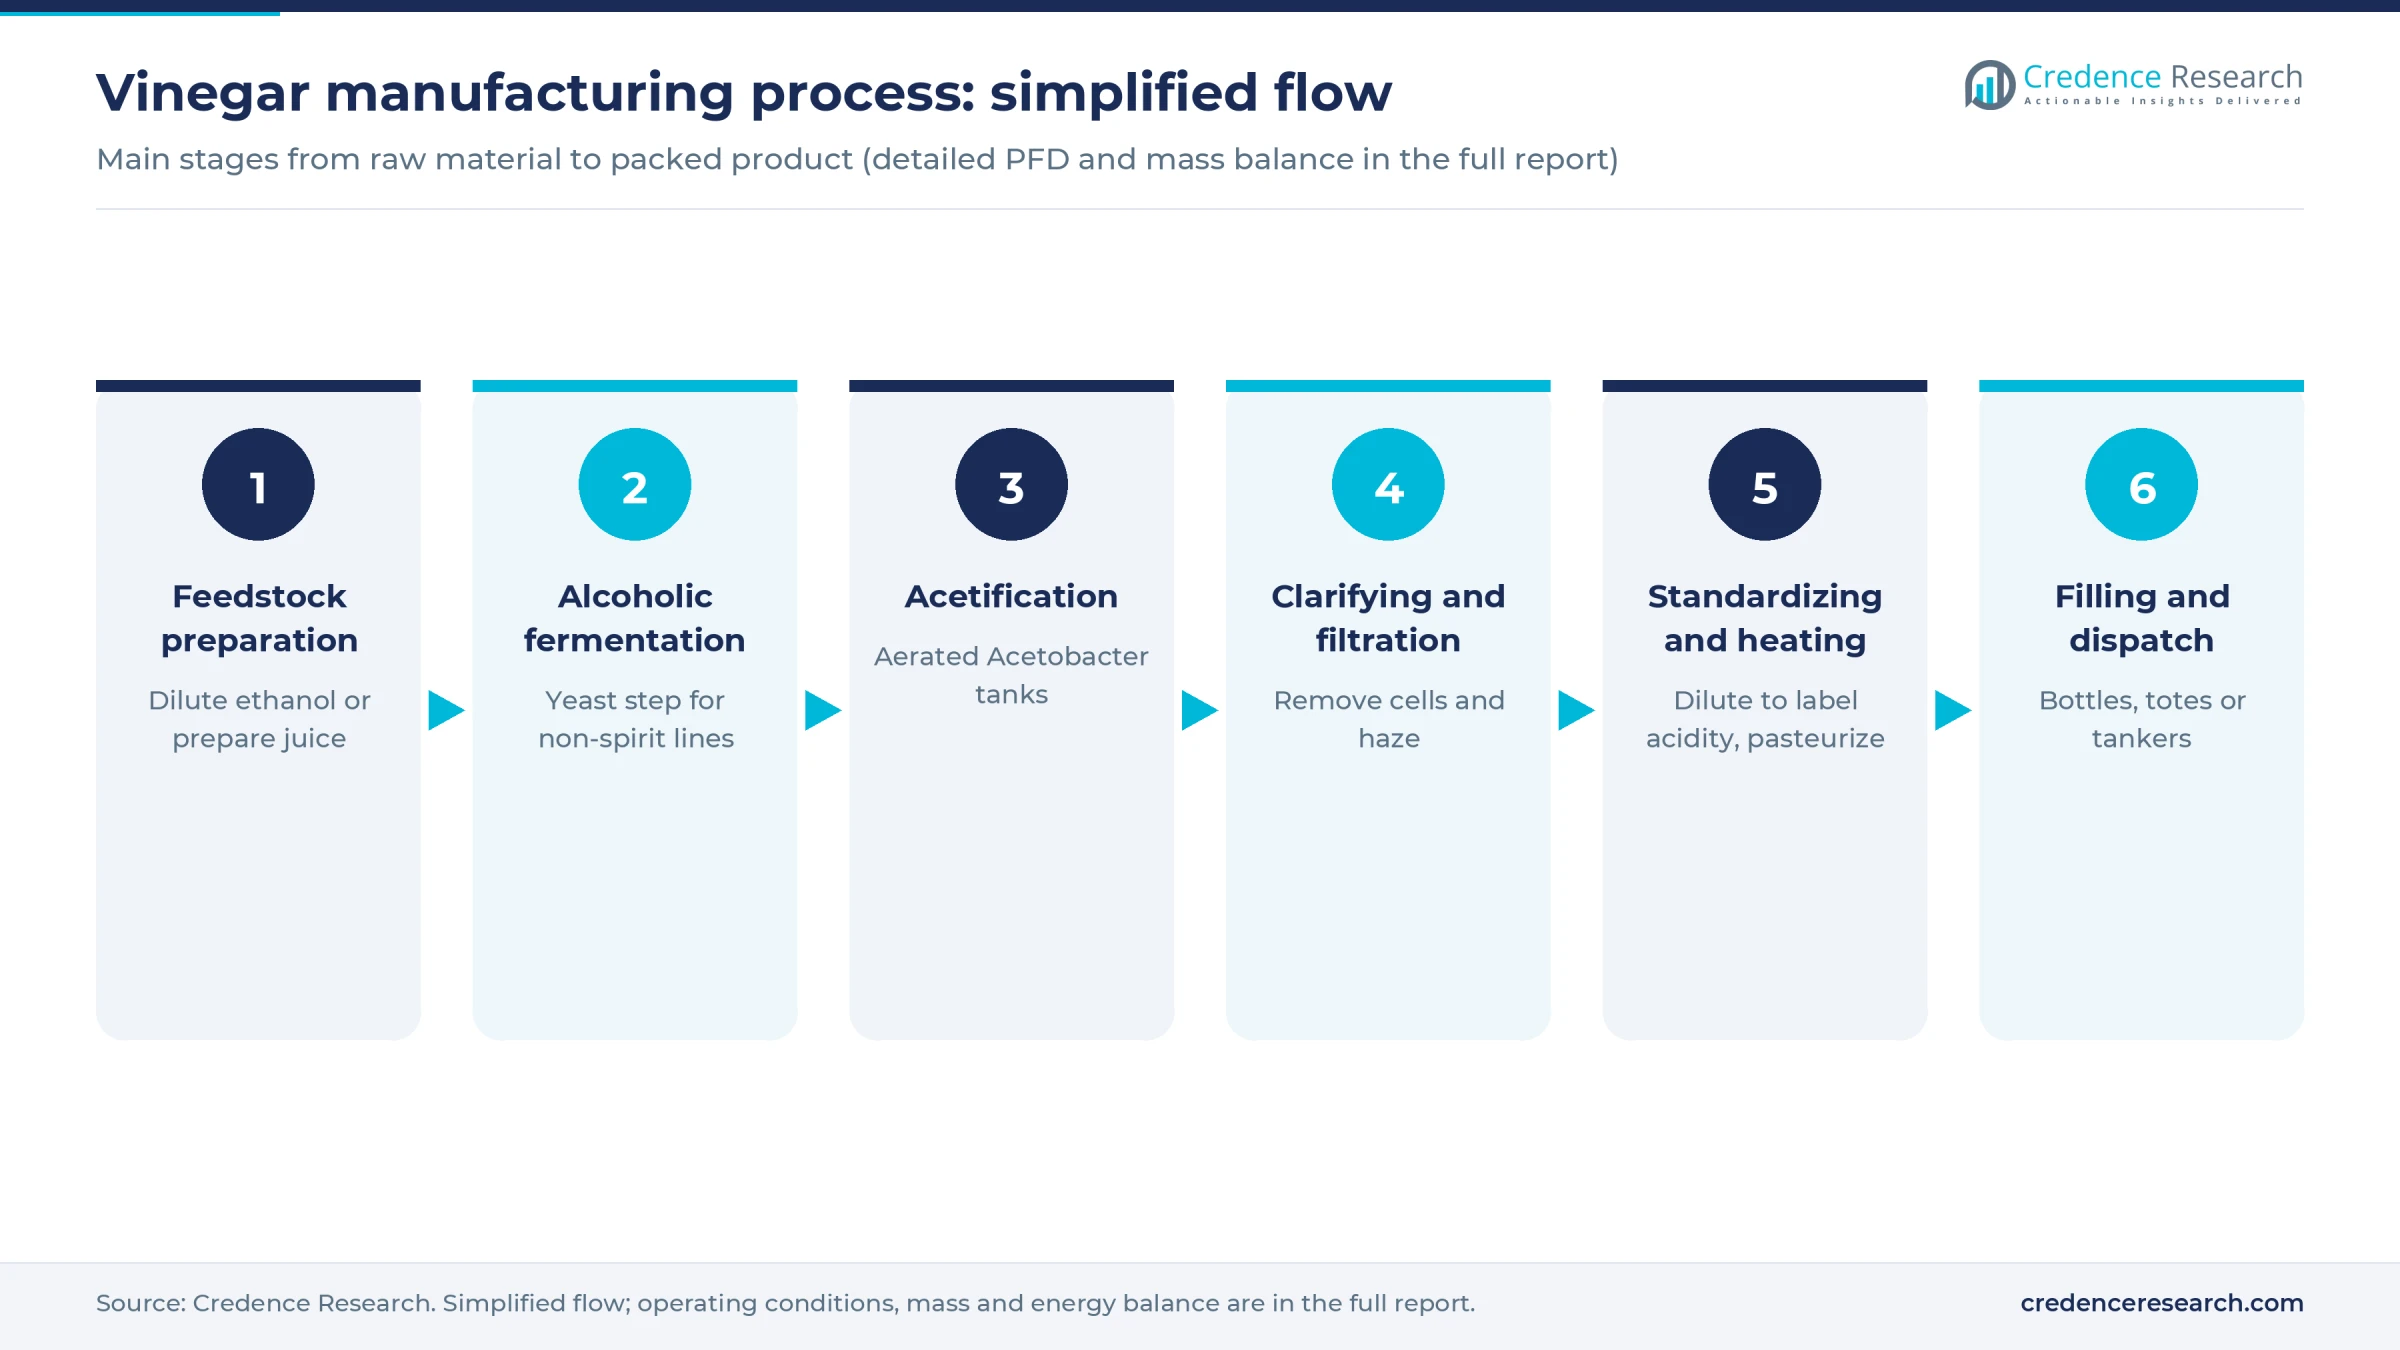
- Feedstock preparation. Plants making white vinegar dilute food-grade ethanol with treated water. Fruit, grain or sugar lines first prepare a juice, wort or syrup, and adjust sugar and nutrients.
- Alcoholic fermentation. Only non-spirit lines need this step. Yeast turns sugars into a low-alcohol base over several days in closed tanks, so that no sugar is wasted on spoilage organisms.
- Acetification. The base enters stainless acetators with a live Acetobacter culture, fine aeration and cooling. The reaction releases heat and the culture is sensitive, so an interruption of air can damage a batch. Most plants run semi-continuously, drawing off part of each tank and refilling it to keep the culture active.
- Clarifying and filtration. Settling, then plate or membrane filtration, removes cells and haze. This step also matters for regulators, because vinegar eels are tolerated in generators and bulk tanks only if filtration keeps them out of the finished product.
- Standardizing and heat treatment. Vinegar is usually made stronger than retail strength, then diluted to label acidity, commonly 4–5%. Flash pasteurization protects bottled product from haze and renewed growth.
- Filling and dispatch. Output goes to bottles, jugs, totes or tankers, then through coding, case packing and palletizing.
Quality control centers on titratable acidity, residual alcohol and clarity on every lot, along with raw water checks. Aged balsamic or black vinegars need long barrel or tank storage, which ties up much more capital and cash than this flow. Exact recipes, yields and aeration parameters are in the full report.
Vinegar plant setup cost
This overview models a greenfield plant rated at 10,000 tonnes a year at 5% acidity, or roughly 10 million liters. It runs 16 hours a day for 300 days and sells about 7,500 tonnes at 75% utilization. Estimated CapEx is USD 5–11 million before USD 0.6–1.2 million of working capital.
Few vinegar plants disclose cost, so the range rests on two checks. A 2006 Hengshun joint venture in China put the first section at CNY 500 million for 200,000 tonnes a year, about USD 64 million then. Scaled down by the six-tenths rule and escalated by an assumed 1.6–1.9 times, it implies USD 17–20 million at 10,000 tonnes. That plant makes slow-aged grain vinegar, so the figure is a ceiling, not a target. From below, Chinese suppliers list basic fruit vinegar lines at USD 138,000–148,000 for 500–1,000 kg an hour, or USD 300,000–600,000 for this capacity. Those listings exclude civil works and utilities and fall well short of food-plant automation, so the model assumes USD 2.3–5.1 million for process and filling equipment, a judgment rather than a disclosed figure, which at 46% of CapEx sets the USD 5–11 million range.
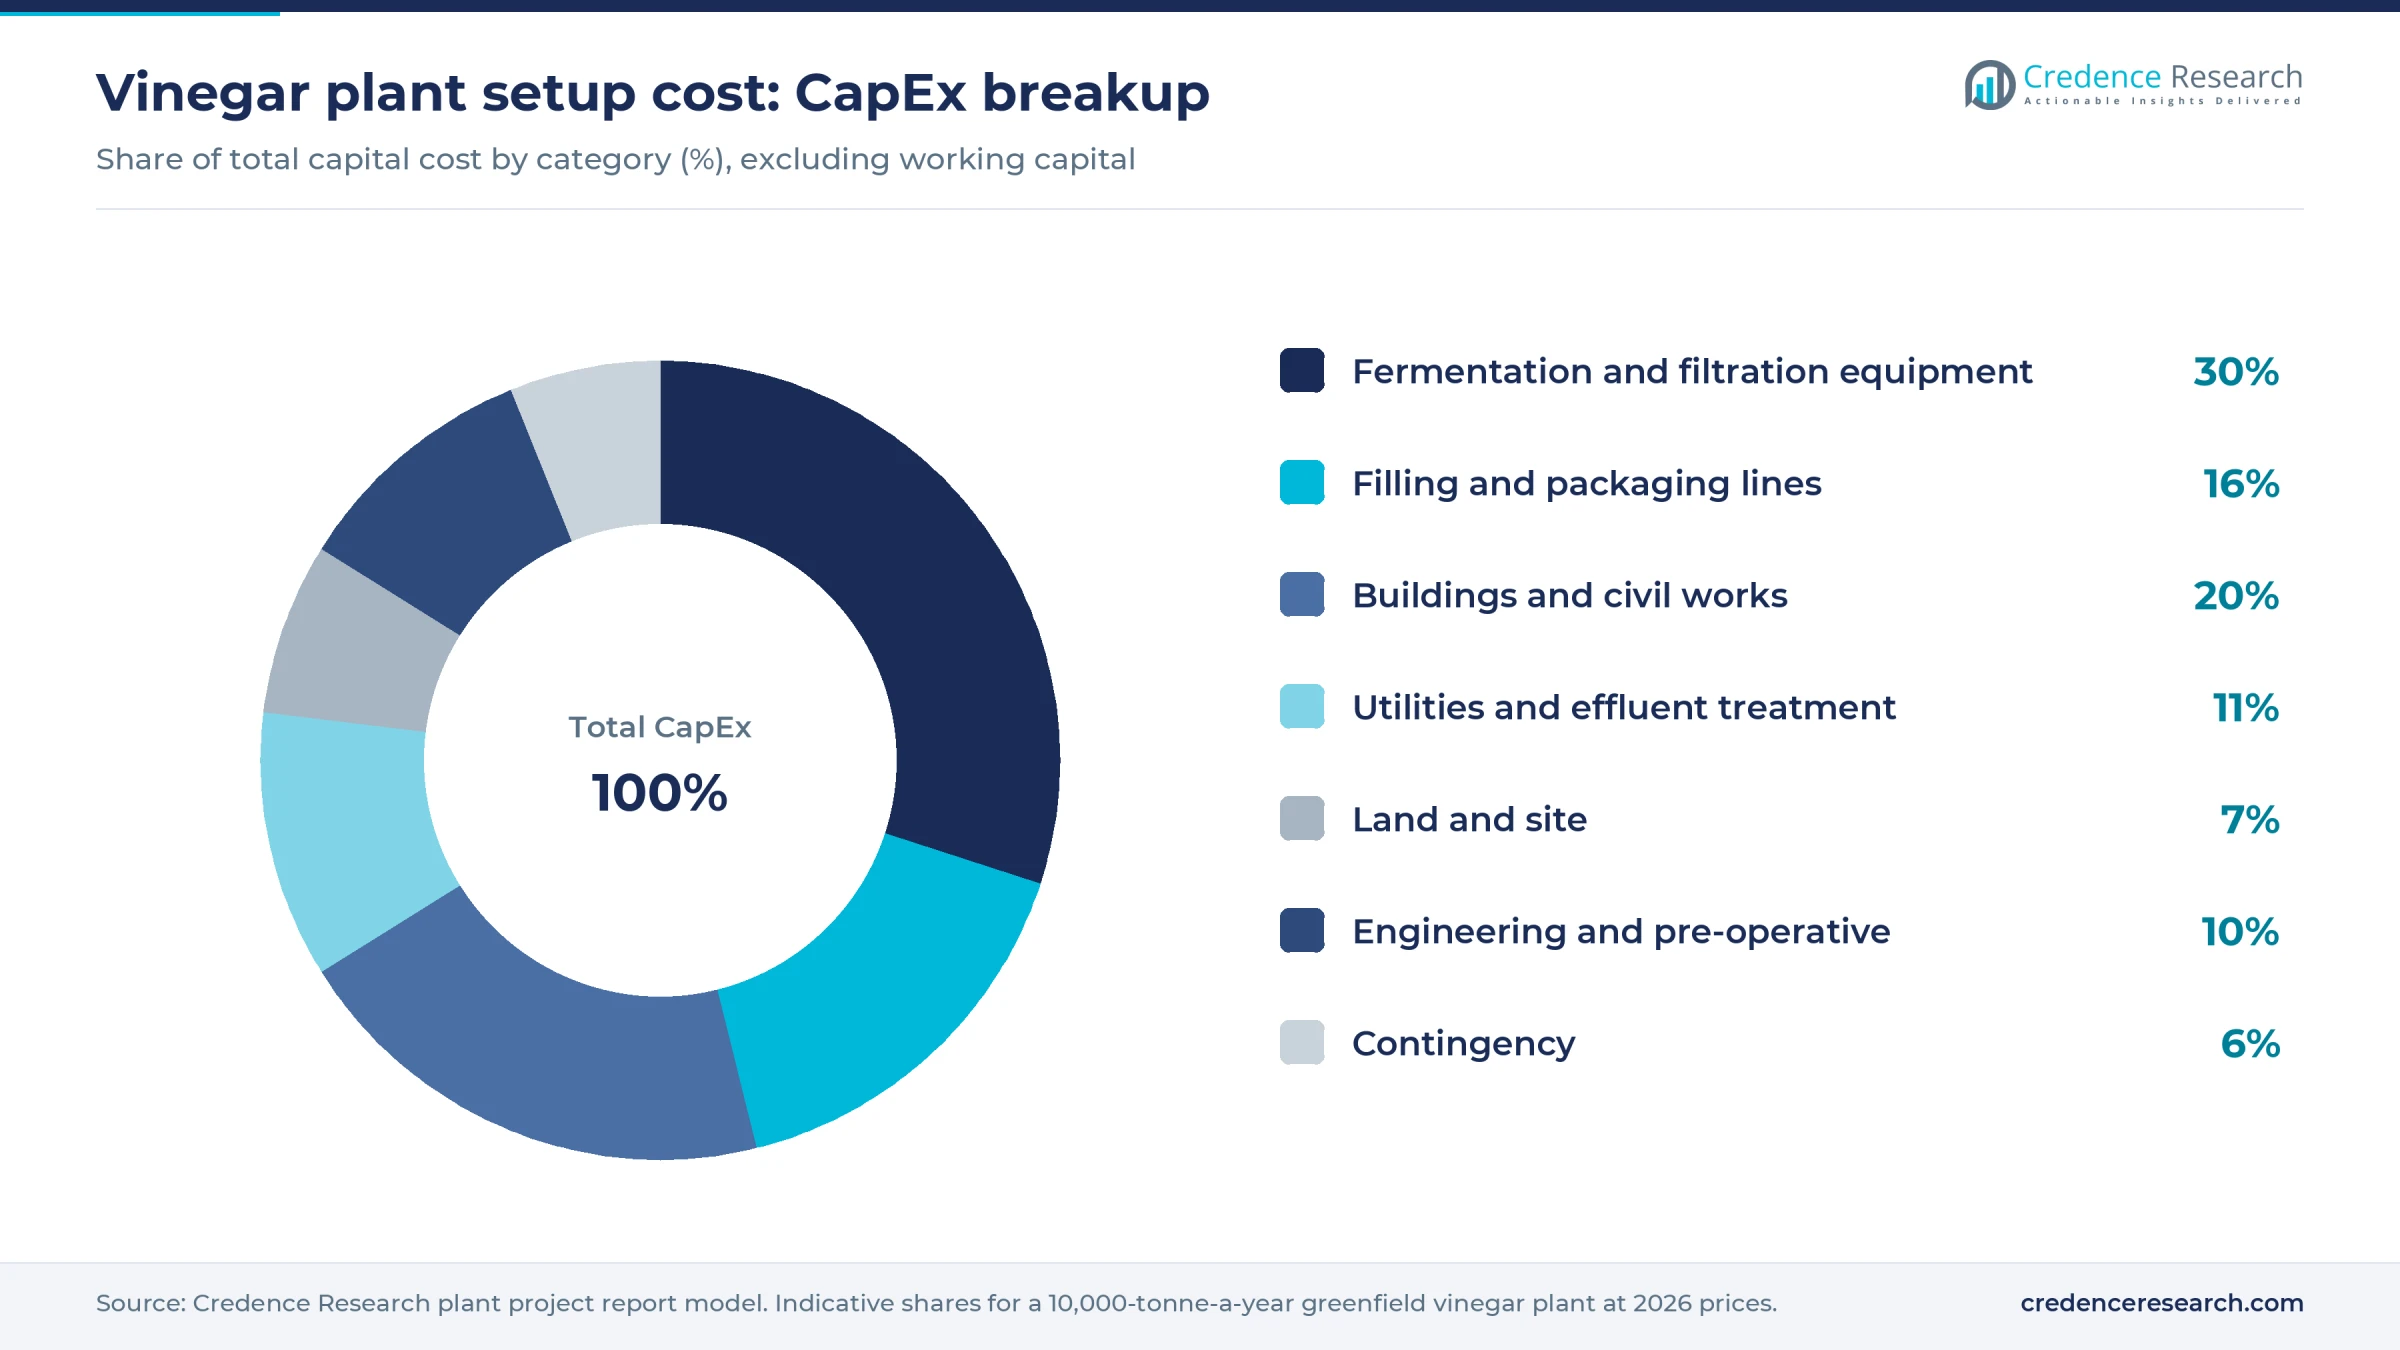
Equipment takes 46% of CapEx. Buildings, utilities and effluent treatment follow, because acidic wash water has to be neutralized before discharge. Land shows how location moves the total. At an assumed 12,000 square meters, a plot costs about USD 360,000–720,000 at an assumed USD 30–60 per square meter in an Asian industrial park, and USD 600,000–1.4 million at an assumed USD 50–120 on a U.S. or EU site.
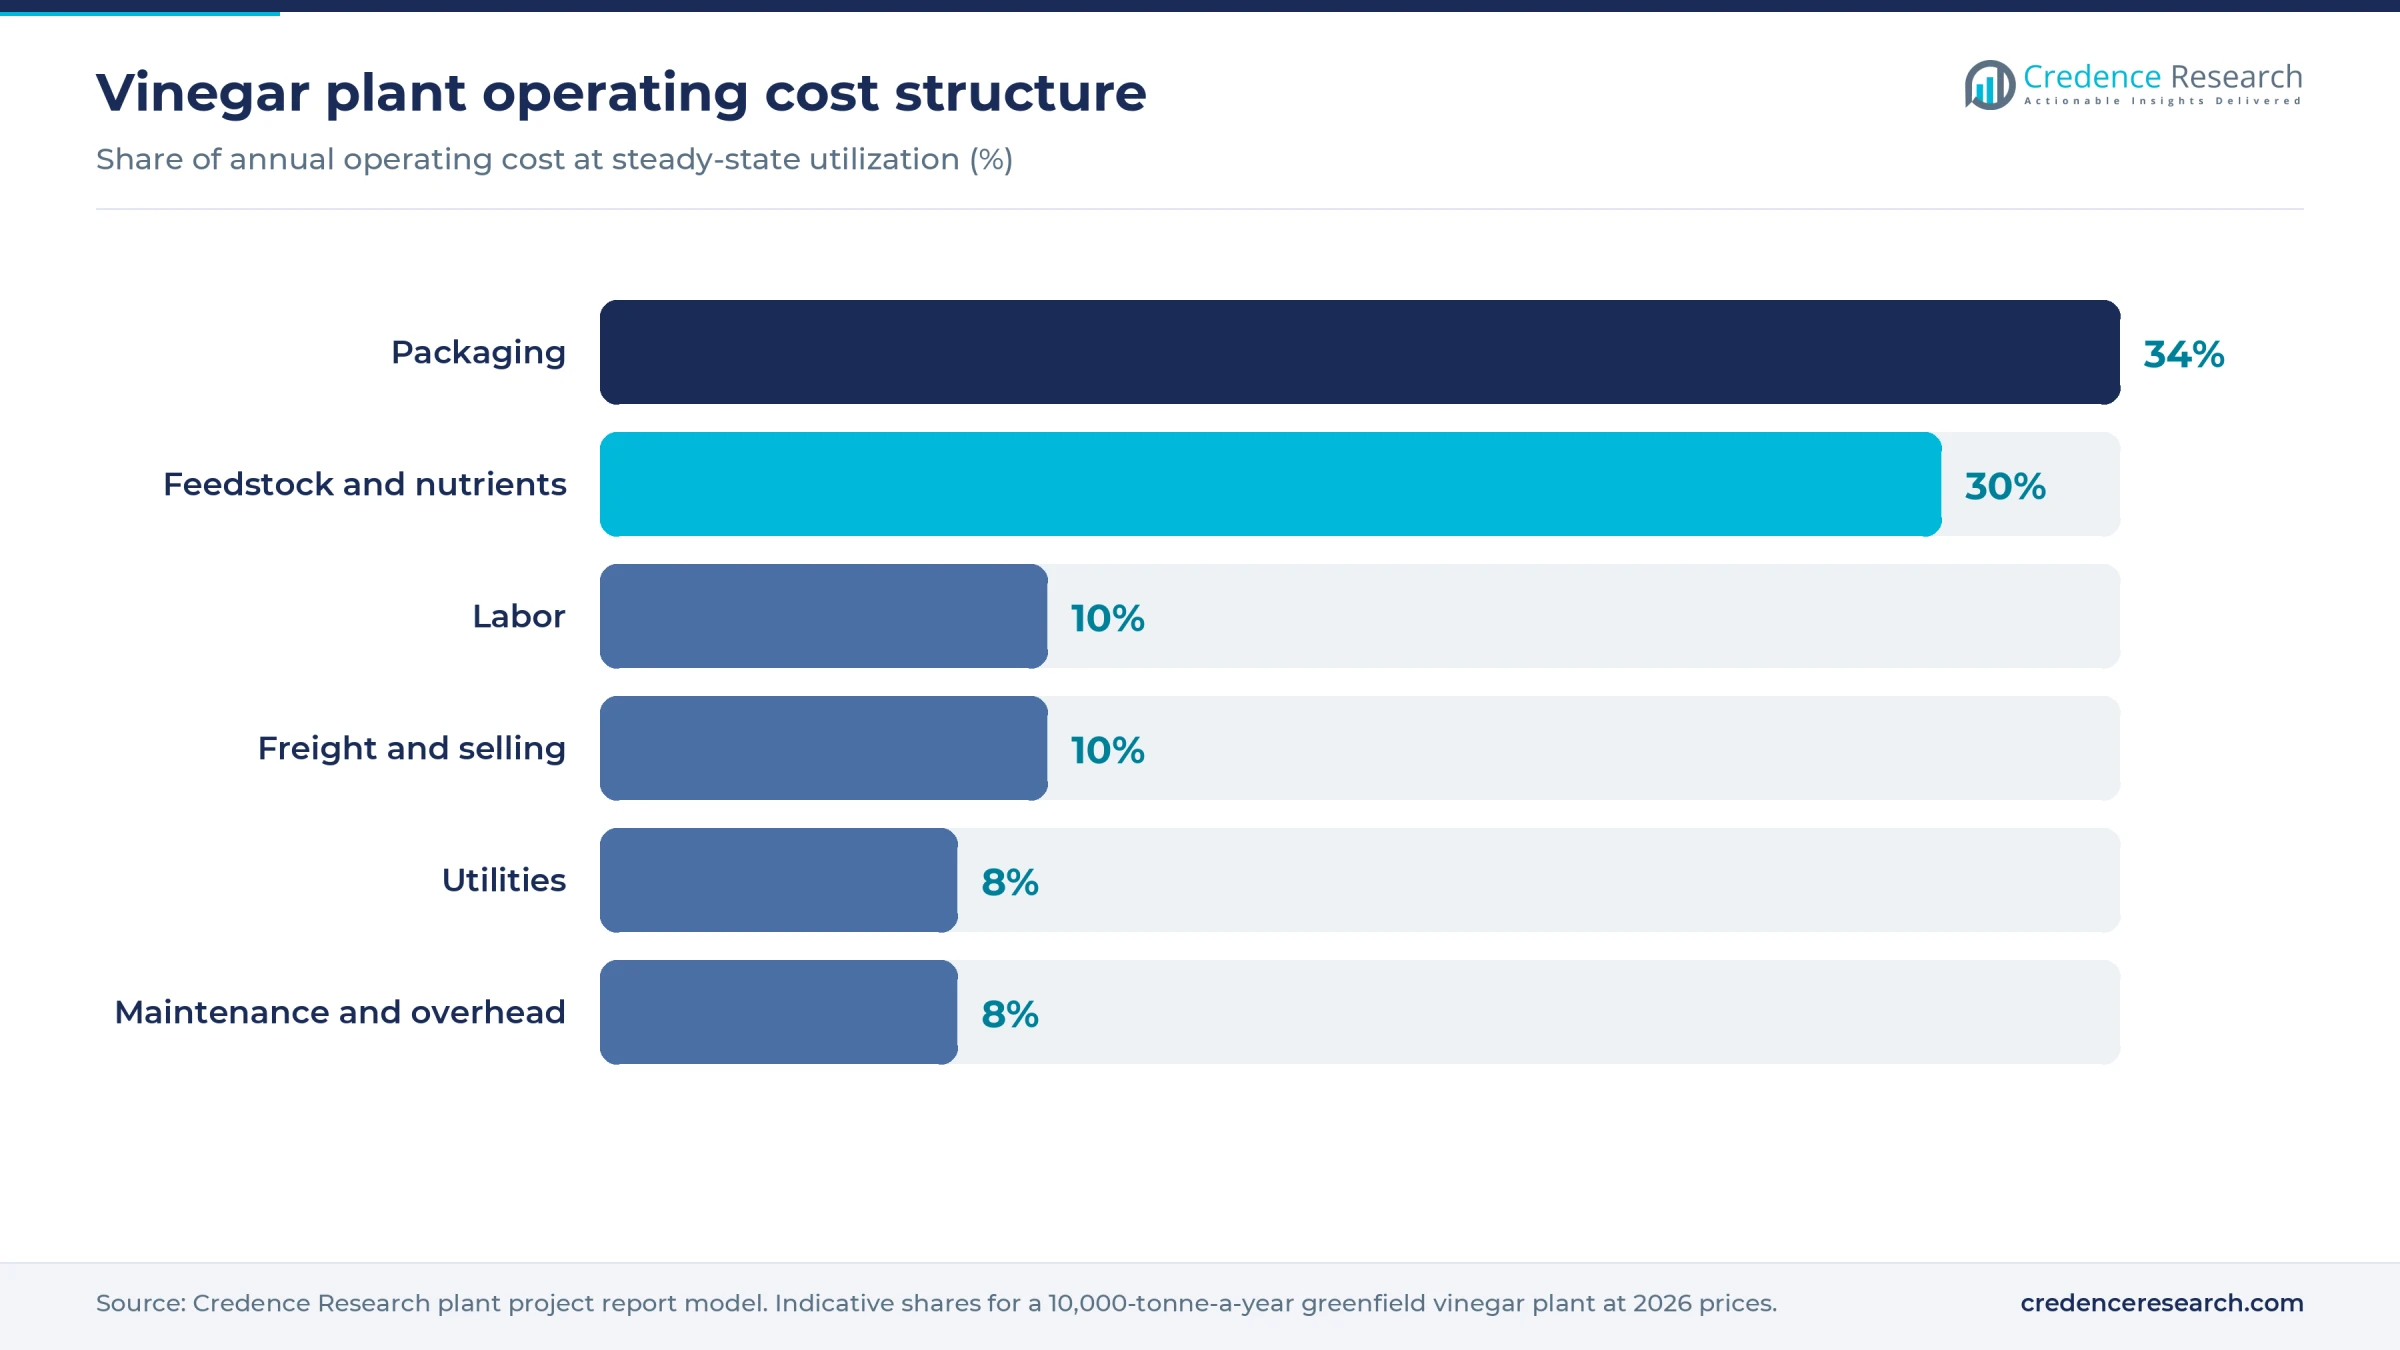
Operating cost looks unusual for a food plant. Feedstock is under a third of the total for this mix, because little alcohol goes into a liquid that is about 95% water, while packaging is as large or larger. The full report can be customized to any country or region.
Machinery and raw materials for a vinegar plant
The core machinery list is short, and most of it is stainless steel because acetic acid corrodes ordinary metals:
- Ethanol and juice receiving tanks, plus water treatment
- Closed yeast fermenters for fruit, grain or sugar lines
- Acetators with self-aspirating aerators, cooling coils and alcohol and acidity control
- Storage tanks, plate or membrane filters and a flash pasteurizer
- Bottle and jug fillers, cappers, labelers, case packers and palletizers
- Clean-in-place skid, boiler, chiller, compressor and effluent neutralization
Machine costs and specifications are in the full report. Acetator control is the part worth paying for, since stable aeration protects yield and a lost culture costs days of output.
Raw material sourcing follows the grade. Food-grade ethanol comes mainly from corn in the United States and sugarcane in Brazil, with molasses alcohol from India and Thailand. Apple juice and concentrate come from China, Poland and the United States. Wine and grape must come from Italy, Spain and France, while rice and grain bases are concentrated in China and Japan. Plants may also compare fermentation with diluted industrial acetic acid, but this yields a different product with narrower labeling rights. PET, glass, caps and cartons are usually bought locally, and freight favors a plant near them.
Vinegar business profit margin and ROI
Margin here comes less from conversion than from product mix and distance to customers. Public price listings show white distilled vinegar at about USD 0.48–1.55 per kg in 2024 export and import deals, and near USD 0.65 per kg in recent wholesale. The model assumes a net USD 0.60–0.80 per kg, which yields USD 4.5–6 million of annual sales on 7,500 tonnes.
Assumed direct cost is about USD 0.48 per kg at the modeled mix, covering feedstock, packaging and conversion. That gives an estimated gross margin of 20–40%. A small-scale apple cider vinegar profile from the Uttar Pradesh state MSME portal in India projects gross profit near 18% in the first year and 22% by the fifth, which supports the low end. The high end needs fruit or specialty grades, or a plant selling close to its buyers.
After overheads, selling cost and freight at about 8–10% of sales, cash profit is an estimated USD 0.5–1.6 million a year. Payback is estimated at 4–11 years including about a year of ramp-up. A high-cost site that only earns the low-end margin falls outside that band and would be hard to finance.
Selling price is the sensitive variable. A 10% price fall takes about 7–9 percentage points from gross margin, while a 20% rise in alcohol cost takes about one point.
| Metric | Value |
|---|---|
| IRR | Available in report |
| NPV | Available in report |
| ROI | Available in report |
| DSCR | Available in report |
How to start a vinegar business, licenses and approvals
Starting a plant follows a common sequence in most countries: register the business and tax accounts, confirm zoning and building permits, then obtain an environmental permit covering acidic wash water. Next come occupational safety and boiler approvals, food facility registration, a hazard-based food safety plan, label and acidity compliance, and import-export registration if the plant ships abroad. Plants buying bulk alcohol often need a separate alcohol or excise permit, which can take longer than the food license and should be checked early.
| Market | Food and product rules | Site and other permits |
|---|---|---|
| United States | FDA food facility registration; preventive controls under 21 CFR Part 117; CPG Sec. 525.825 gives labeling definitions and a 4% minimum strength for diluted vinegar | Local zoning and wastewater pretreatment permit; OSHA rules; TTB permit where the plant buys specially denatured alcohol |
| European Union | Food business registration and HACCP under Regulation (EC) No 852/2004; general food law 178/2002; labeling under 1169/2011; EN 13188 voluntary standard for vinegar | National environmental and building permits; national worker safety rules; PGI rules for protected names such as Balsamic vinegar of Modena |
| India | FSSAI license; standard requires at least 3.75% acidity, with synthetic vinegar labeled as prepared from acetic acid; Legal Metrology packer registration | State pollution control board consents to establish and operate; factory license; state excise permit for alcohol purchases; Import Export Code for exports |
Industrial buyers commonly also ask for FSSC 22000 or BRCGS certification, plus kosher, halal or organic by customer. Requirements vary locally, and the full report lists the steps for a chosen country.
Key vinegar manufacturers and recent developments
Supply splits by grade and region. Fleischmann's vinegar, owned by Kerry Group, makes food-grade industrial vinegar and had seven U.S. plants when Kerry agreed to buy it in 2018. Jiangsu Hengshun vinegar anchors Chinese aged vinegar, and Mizkan is the leading Japanese name. Acetum, part of Associated British Foods, leads Modena balsamic with its Mazzetti brand. Kraft Heinz is a major branded white and cider seller, and Bragg Live Food Products is known for raw cider vinegar.
Three developments from 2026 show where attention has moved:
- February 2026. American vinegar Works of Worcester, Massachusetts, was reported raising USD 1.5 million for a larger site, after reaching nearly 13,000 gallons a year of slow-drip craft vinegar.
- May 2026. The Modena consortium reported 2025 exports up 2.57% and output up 10% in early 2026.
- July 2026. Vinetur, citing Gambero Rosso, reported that the same consortium was preparing supply agreements to absorb part of Italy's wine surplus, which could give suppliers more visibility on volumes and pricing formulas.
What's inside the Vinegar project report PDF
The report runs to 21 chapters. Open a chapter to see its sections.
1. Preface
2. Scope and Methodology
- 2.1 Objectives of the Study
- 2.2 Stakeholders
- 2.3 Research Methodology
- 2.4 Data Sources and Key Assumptions
3. Executive Summary
- 3.1 Market Snapshot
- 3.2 Project at a Glance (Capacity, CapEx, OpEx)
- 3.3 Key Financial Indicators (IRR, NPV, Payback, Break-even)
- 3.4 Feasibility Verdict
4. Product Overview
- 4.1 Vinegar Definition and Properties
- 4.2 Grades and Specifications (BIS / ISO / ASTM)
- 4.3 HS Code and Classification
- 4.4 Key Applications
- 4.5 Substitutes
5. Global Vinegar Market
- 5.1 Market Overview
- 5.2 Historical and Current Market Performance (Volume and Value)
- 5.3 Market Breakup by Grade / Type
- 5.4 Market Breakup by End-Use Industry
- 5.5 Market Breakup by Region
- 5.6 Market Drivers, Restraints and Trends
- 5.7 Value Chain Analysis
- 5.8 Market Forecast
6. Target Country Vinegar Market Analysis
- 6.1 Demand and Supply Analysis
- 6.2 Installed Capacity vs Demand Gap
- 6.3 Import Dependence
- 6.4 Demand Forecast by End-Use
7. Trade Analysis
- 7.1 Imports by Volume, Value and Country
- 7.2 Exports by Volume, Value and Country
- 7.3 Trade Balance and Opportunities
8. Price Analysis
- 8.1 Historical Vinegar Price Trends by Region
- 8.2 Raw Material / Feedstock Price Trends and Linkage
- 8.3 Price Forecast
- 8.4 Margins Across the Value Chain
9. Competitive Landscape
- 9.1 Market Structure
- 9.2 Key Players and Installed Capacities
- 9.3 Profiles of Key Players
- 9.4 Recent Developments (Expansions, M&A, New Plants)
10. Manufacturing Process and Technology
- 10.1 Comparison of Technology Routes
- 10.2 Selected Route and Process Flow Diagram
- 10.3 Unit Operations Involved
- 10.4 Chemical Reactions Involved
- 10.5 Mass Balance and Raw Material Requirements
- 10.6 Energy Balance
- 10.7 Quality Assurance Criteria and Technical Tests
- 10.8 By-products and Waste Handling
- 10.9 Technology Licensors / Providers
11. Project Details, Requirements and Costs
- 11.1 Land, Location and Site Development
- 11.1.1 Site Selection Criteria
- 11.1.2 Location Analysis
- 11.1.3 Land Requirement and Costs
- 11.1.4 Site Development Costs
- 11.2 Plant Layout
- 11.2.1 Layout Principles
- 11.2.2 Proposed Layout
- 11.2.3 Factors Influencing Layout
- 11.3 Civil Works and Buildings
- 11.4 Plant Machinery
- 11.4.1 Machinery Requirements and Specifications
- 11.4.2 Machinery Costs
- 11.4.3 Machinery Suppliers
- 11.5 Raw Materials
- 11.5.1 Requirements per Tonne of Output
- 11.5.2 Procurement and Sourcing
- 11.5.3 Costs
- 11.5.4 Suppliers
- 11.6 Packaging
- 11.6.1 Packaging Requirements
- 11.6.2 Packaging Costs
- 11.6.3 Packaging Suppliers
- 11.7 Storage and Material Handling
- 11.8 Transportation Requirements and Costs
- 11.9 Utilities
- 11.9.1 Power Requirements and Costs
- 11.9.2 Water Requirements and Costs
- 11.9.3 Steam, Fuel and Other Utilities
- 11.10 Manpower Requirements and Wages
12. Environment, Health, Safety and Sustainability
- 12.1 Effluent and Emissions Management
- 12.2 Hazard Classification and Safety Measures
- 12.3 Carbon Footprint
- 12.4 Green / Low-Carbon Process Options
13. Regulatory Procedures, Approvals and Certifications
- 13.1 Licences and Registrations
- 13.2 Environmental Clearances
- 13.3 Product Certifications (BIS, REACH, etc.)
- 13.4 Approval Timeline
14. Project Implementation Schedule
15. Project Economics
- 15.1 Capital Cost of the Project
- 15.2 Techno-Economic Parameters
- 15.3 Capacity Utilization and Ramp-up
- 15.4 Product Pricing and Margins
- 15.5 Income Projections
- 15.6 Expenditure Projections
- 15.7 Working Capital Requirement
- 15.8 Taxation
- 15.9 Depreciation
16. Financial Analysis
- 16.1 Projected Profit and Loss Account
- 16.2 Projected Cash Flow Statement
- 16.3 Projected Balance Sheet
- 16.4 Liquidity Analysis
- 16.5 Profitability Analysis (Payback, NPV, IRR, ROI)
- 16.6 Break-even Analysis
- 16.7 Debt Service Coverage Ratio (DSCR)
- 16.8 Sensitivity Analysis
- 16.9 Scenario and Uncertainty Analysis
17. Funding and Incentives
- 17.1 Means of Finance and Debt-Equity Structure
- 17.2 Loans and Financial Assistance
- 17.3 Government Schemes and Subsidies (PLI, State Policies)
18. Risk Assessment
- 18.1 Key Success Factors
- 18.2 Key Risk Factors
- 18.3 Risk Mitigation
19. Strategic Recommendations
20. Case Study of a Successful Venture
21. Appendix
- 21.1 Detailed Assumptions
- 21.2 Abbreviations
- 21.3 List of Tables and Figures
- 21.4 Sources
This page vs. the full report
| Data point | On this page (free) | In the full report |
|---|---|---|
| Total CapEx | One rounded range at one capacity | Exact figure at three capacities with a line-item breakup |
| CapEx breakup | Category shares (%) only | Cost, quantity and supplier for every machine |
| Operating cost | Share of raw materials, utilities and labor | Per-unit cost sheet with each input price and consumption |
| Profitability | Gross margin range and payback band | Exact IRR, NPV, ROI, break-even and DSCR |
| Financial statements | List of what is included | 10-year P&L, cash flow, balance sheet and Excel model |
| Sensitivity | One directional line | Full sensitivity and scenario tables |
| Process | Simplified flow diagram | Detailed process flow, mass and energy balance, operating conditions |
| Machinery | Names of the main machines | Specifications, capacity, cost and supplier list |
| Market | Headline size, growth and India demand trend | Segment, region, trade and price forecast tables |
| Suppliers and buyers | Supplier types and sourcing hubs | Named suppliers and buyers |
Vinegar project report: FAQs
How much does a vinegar manufacturing plant cost?
What is the profit margin in vinegar manufacturing?
How long is the payback for a vinegar plant?
Which raw materials does a vinegar plant need?
Can vinegar be made from acetic acid instead of fermentation?
What licenses does a vinegar plant need?

About the analyst
Priyanka Mor, Senior Consultant
Senior Consultant at Credence Research Inc directing strategic market advisory, cross-border commercial due diligence and enterprise intelligence frameworks for global B2B clients. Combines quantitative modeling with executive advisory, translating macroeconomic variables and supply chain data into go-to-market blueprints, M&A screenings and competitive war-gaming strategies.
Related market research
- Asia Pacific Vinegar Market Size, Share, Growth and Forecast, 2025-2035
- Apple Cider Vinegar Supplement Market Size, Share and Forecast 2032
- Acetic Acid Market Size, Growth, Share, Trends and Forecast 2032
- Wood Vinegar Market Size, Share and Growth Report 2032
- Champagne Vinegar Market Size, Growth and Forecast 2032
More plant project reports
- Onion Powder Manufacturing Plant Project Report (DPR) 2026
- Tea Processing Plant Project Report (DPR) 2026
- Fruit Juice Processing Plant Project Report (DPR) 2026
- Guar Gum Powder Manufacturing Plant Project Report (DPR) 2026
- Shrimp Processing Plant Project Report (DPR) 2026
- Instant Coffee Manufacturing Plant Project Report (DPR) 2026