
Grain vinegar and home kitchens anchor regional value
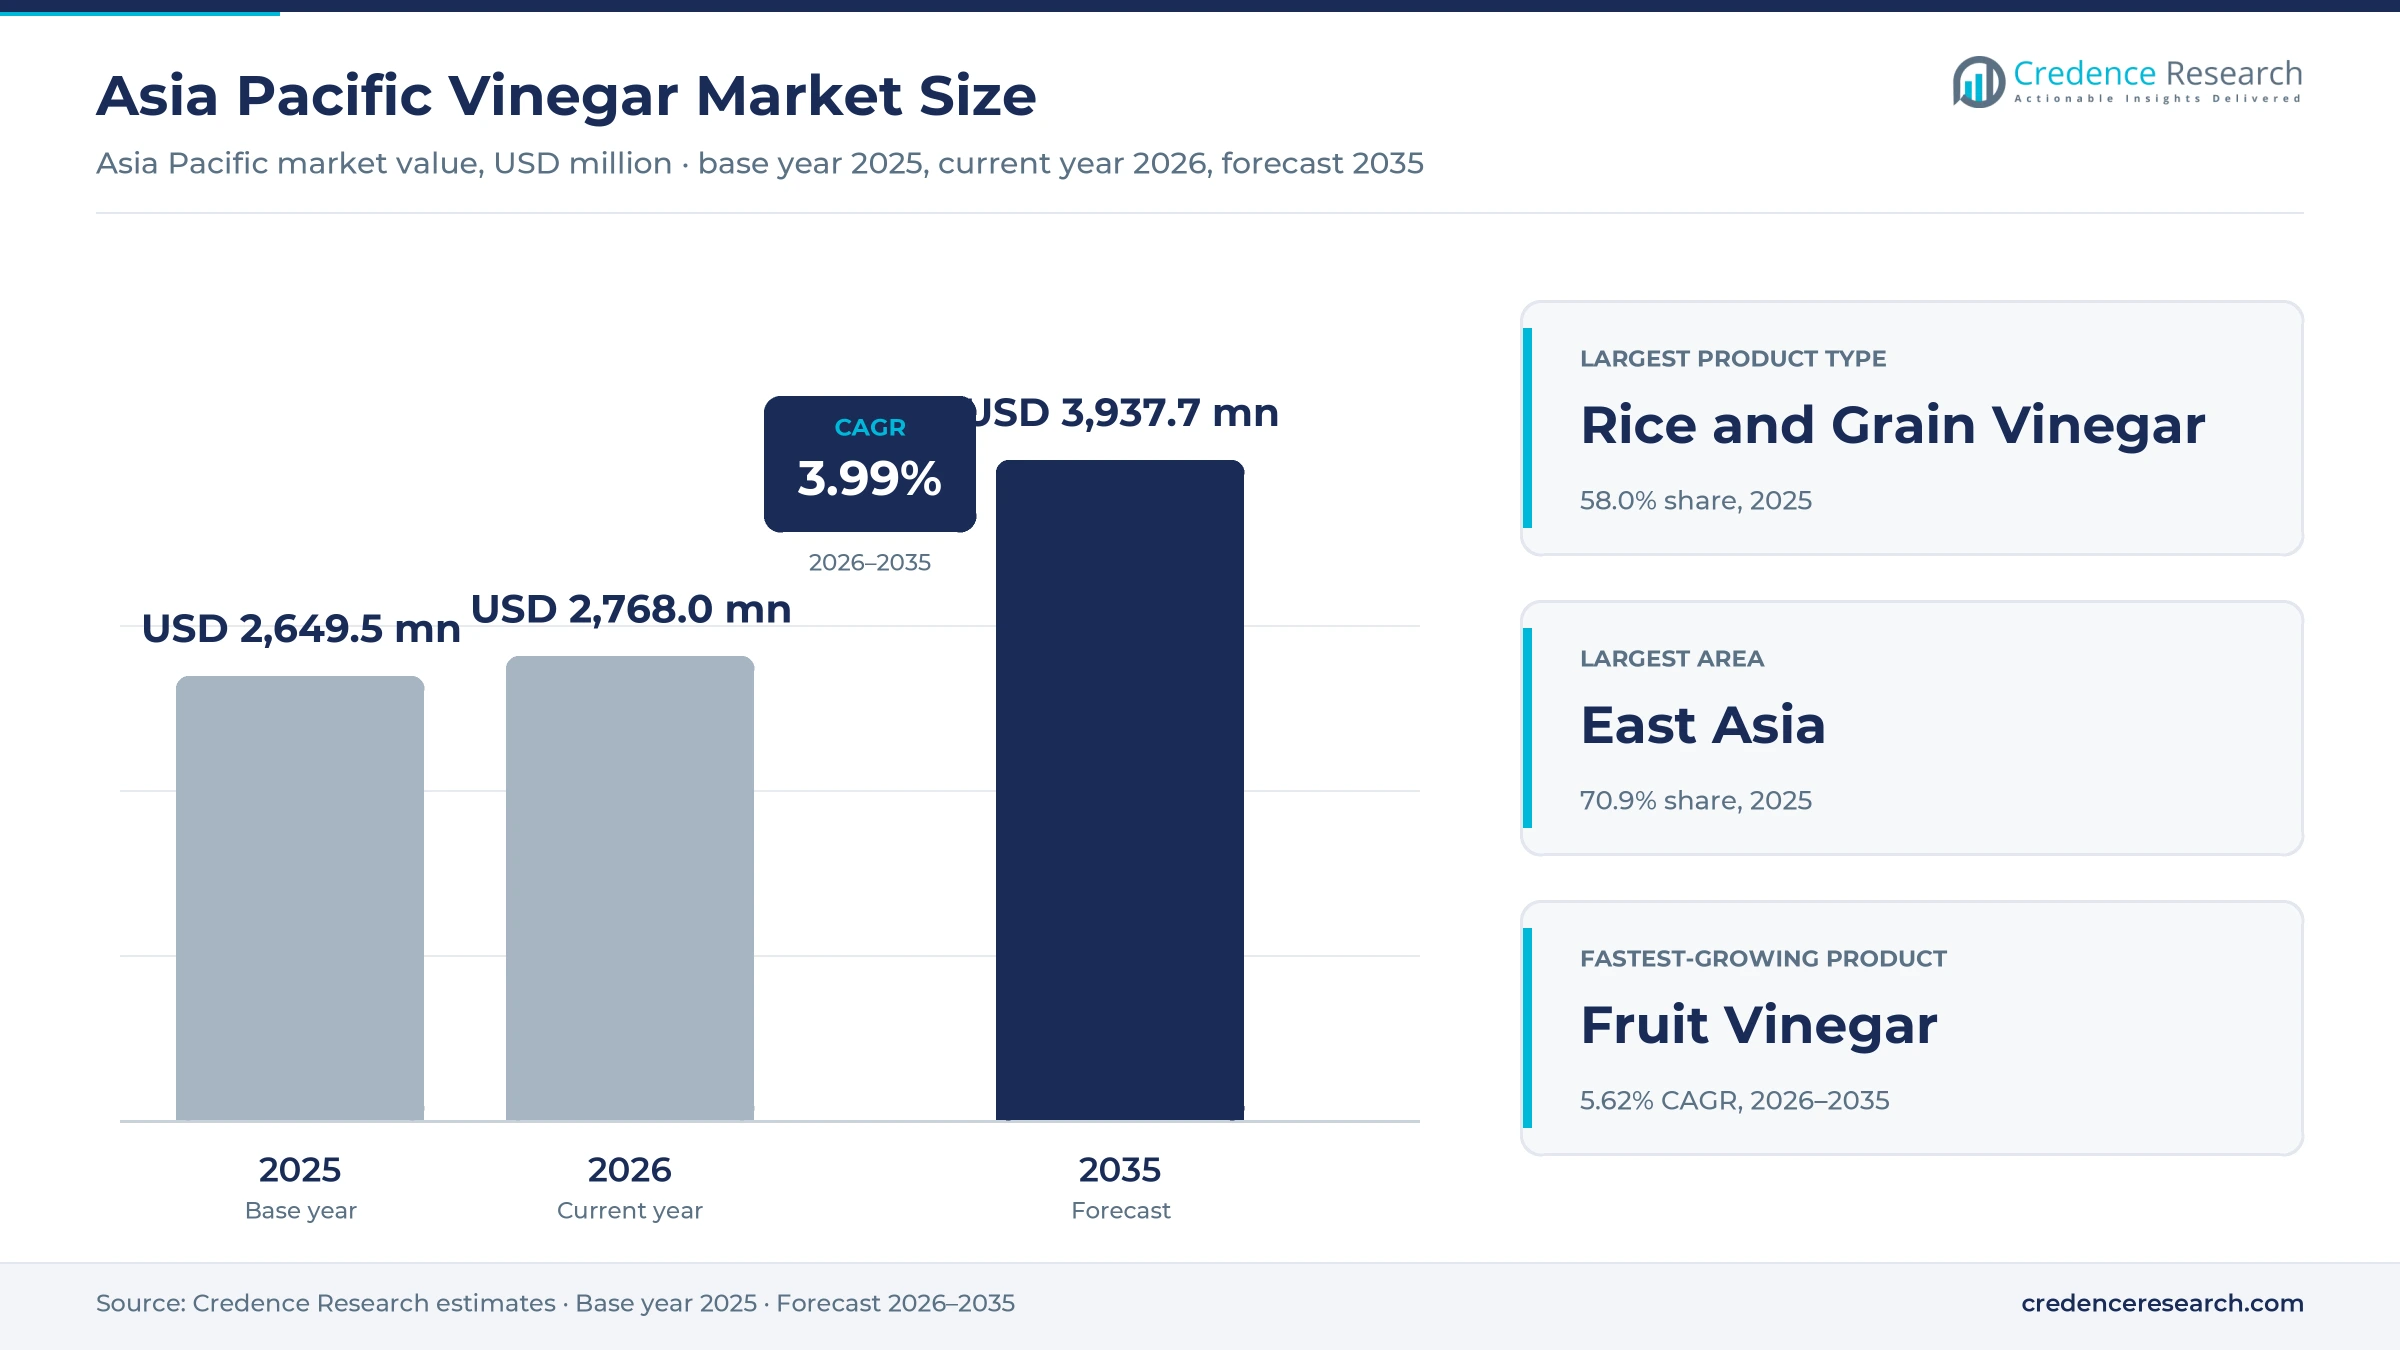
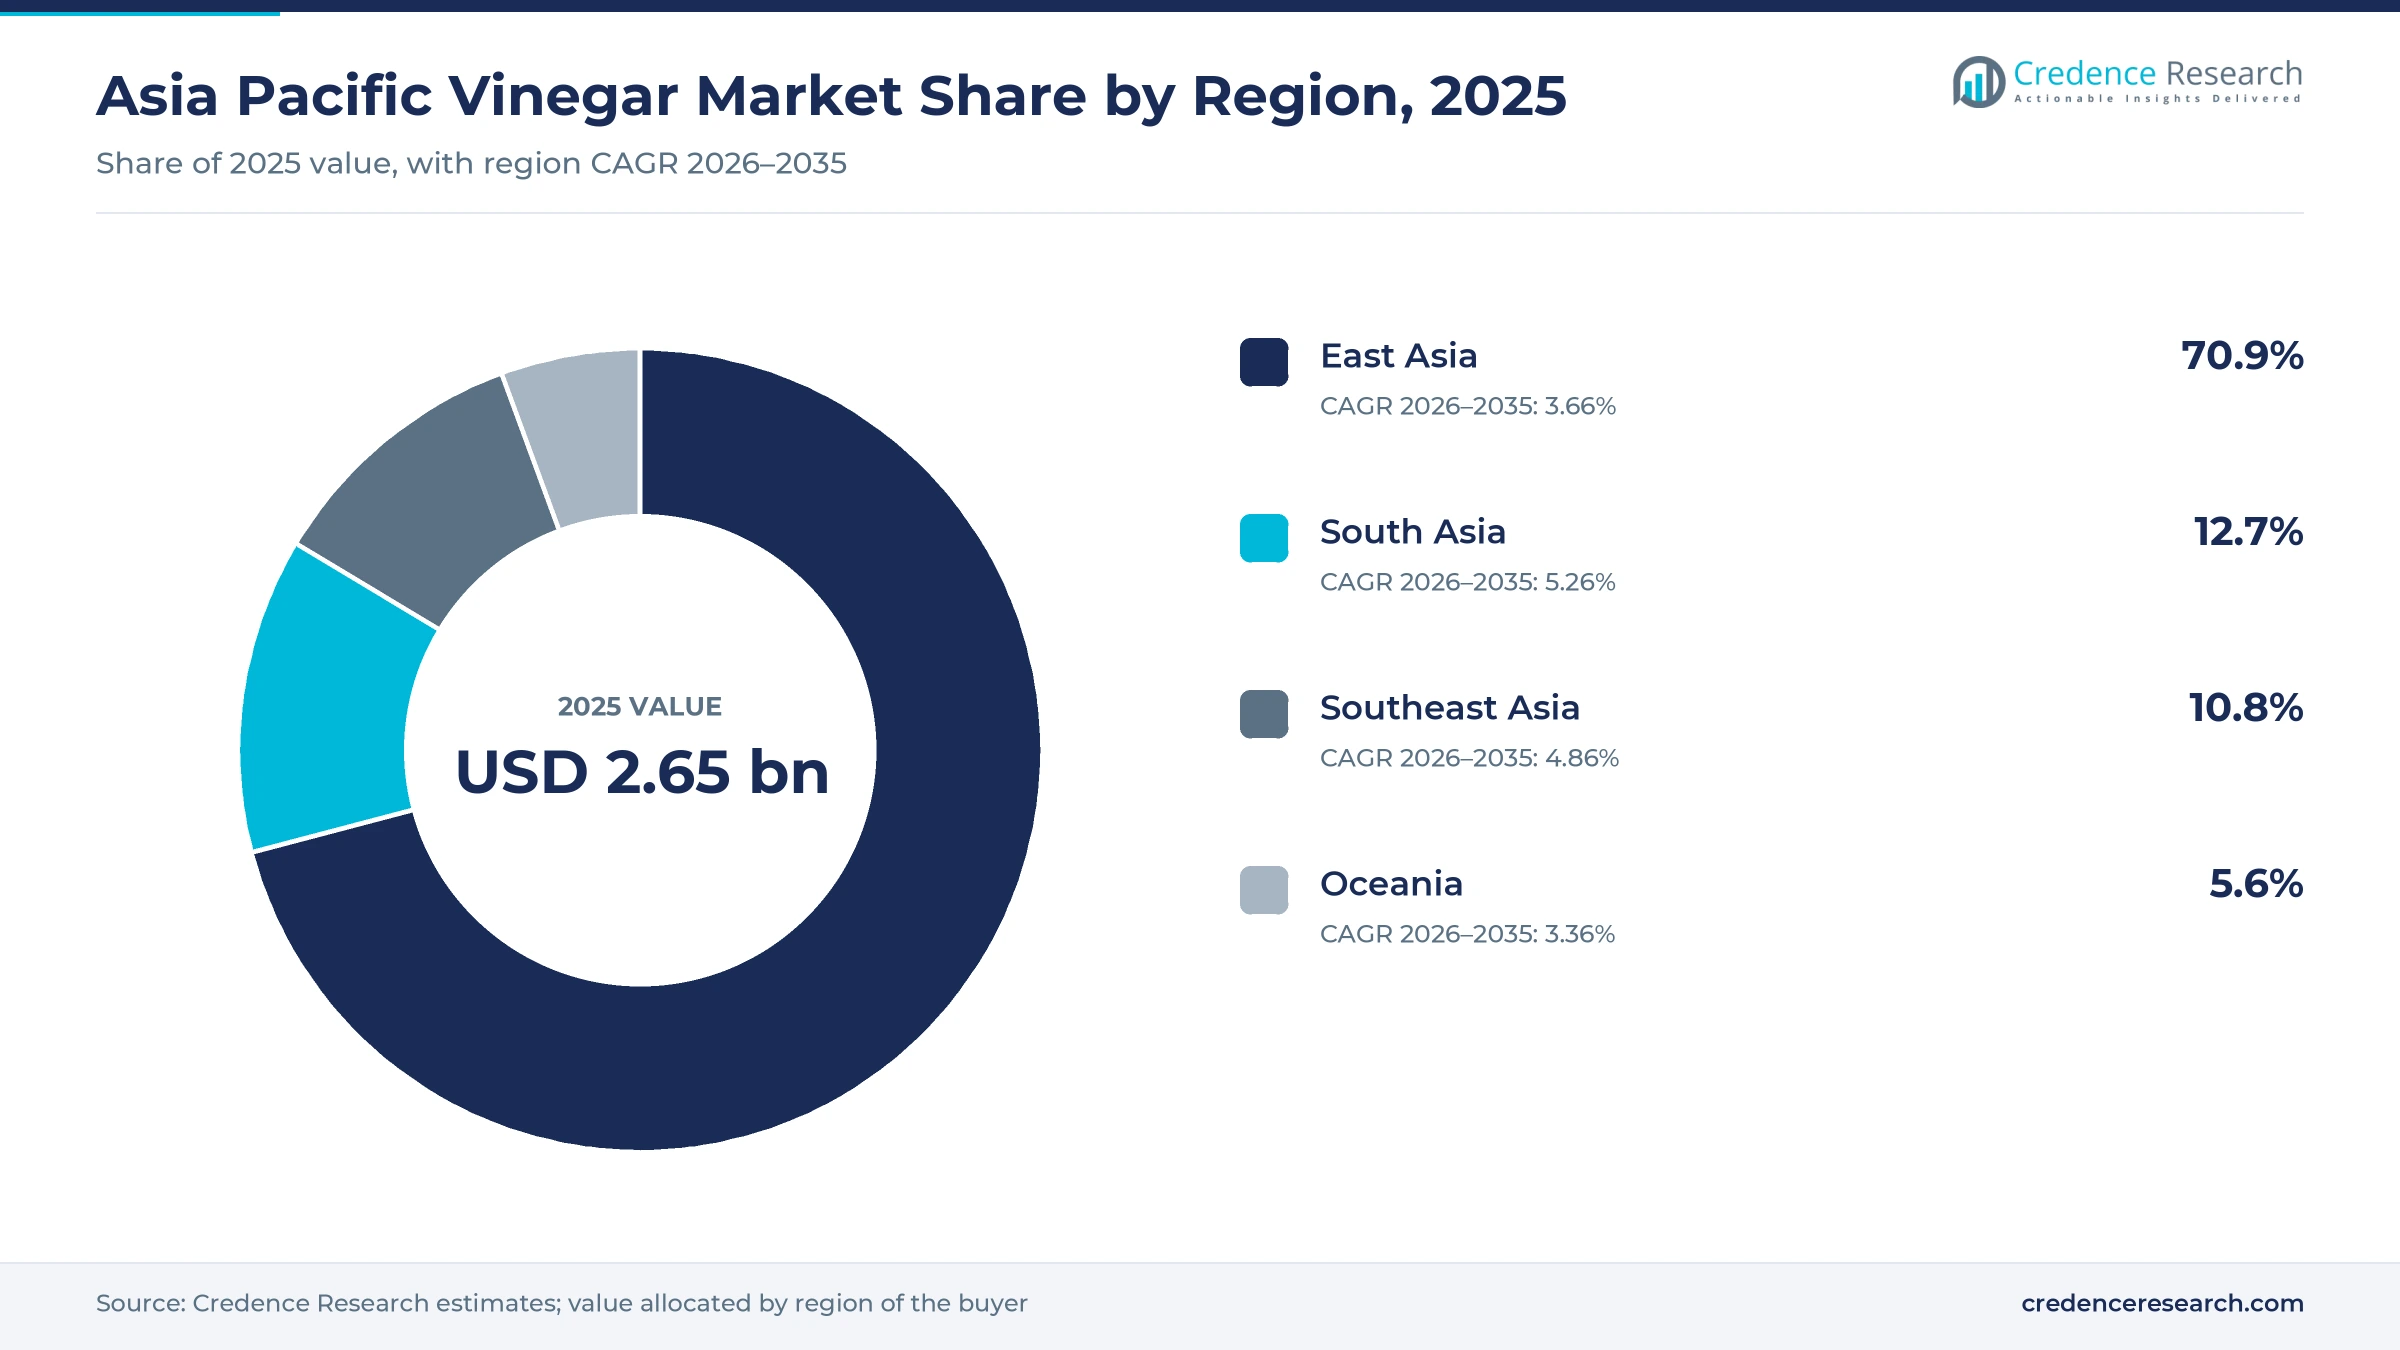
The Asia Pacific vinegar market was valued at USD 2.65 billion in 2025 and is projected to increase from USD 2.77 billion in 2026 to USD 3.94 billion by 2035, registering a CAGR of 3.99% during 2026–2035. Demand comes from daily cooking, packaged condiments and restaurant kitchens, with aged grain vinegars from China and rice vinegars from Japan setting the regional value benchmark. East Asia held the largest share, 70.9% in 2025, because Chinese and Japanese brewers supply the deepest home markets in the region. South Asia is the fastest-growing area at 5.26% a year as India's FSSAI rules separate brewed from synthetic vinegar on the label. Commercially, the sharpest change sits in low-sugar drinking vinegar, where Daesang added three low-sugar Hongcho items in June 2026, including a pomegranate drink with 74% less sugar than regular drinking vinegar, according to Edaily, with sales in Japan and Vietnam planned for the second half of 2026.
What counts as vinegar value in Asia Pacific, and who buys it?
The market counts brewed and food-grade vinegar sold for cooking, packaged food production and vinegar-led drinks across East Asia, South Asia, Southeast Asia and Oceania. Buyers range from households choosing bottled black, rice or coconut vinegar to food manufacturers that contract bulk acidity for mayonnaise, pickles and sauces.
The estimate excludes finished dressings, sauces and pickles sold as separate foods, and industrial acetic acid used outside food. The value chain runs from grain, fruit and coconut growers through brewers and blenders to grocers, distributors, online stores and restaurant suppliers. Demand in the market spans four product groups, and Daesang's 40-milliliter stick packs show how far formats now reach beyond the kitchen bottle.
Asia Pacific Vinegar Market Insights
- The Asia Pacific vinegar market grows from USD 2.65 billion in 2025 to USD 3.94 billion by 2035, a 3.99% CAGR that reflects a mature staple with rising value per liter.
- East Asia held 70.9% of 2025 value, supported by a Qingxu county cluster in Shanxi producing close to 800,000 metric tons a year, according to China Daily.
- Rice and Grain Vinegar led with 58.0% of 2025 value, because aged sorghum, wheat bran and rice vinegars define the everyday table in China, Japan and Korea.
- Daesang announced three more low-sugar Hongcho items on June 16, 2026, moving drinking vinegar from a sour tonic toward a mainstream, lower-calorie beverage category in Korea.
- NutriAsia now cites carbon-14 test results after state researchers found about 8 in 10 vinegar samples were synthetic, which turns provenance into a competitive claim.
Grain vinegar leads while fruit and functional lines climb
Why do grain vinegars outweigh every other product type?
Based on product type, the market is categorized into rice and grain vinegar, fruit vinegar, cane and coconut vinegar, and spirit vinegar and food-grade substitutes. Rice and Grain Vinegar led with 58.0% of 2025 value because grain brewing sits at industrial scale, as China Daily reported in July 2024 that Qingxu county alone produces close to 800,000 metric tons a year across 81 vinegar-related enterprises. Fruit Vinegar grows fastest at 5.62% a year as Daesang added three low-sugar Hongcho items in June 2026, including a pomegranate drink with 74% less sugar than regular drinking vinegar, according to Edaily.
Which uses of vinegar carry the most regional value?
Based on application, the market is categorized into culinary seasoning, food processing and vinegar-led functional use. Culinary Seasoning led with 64.0% of 2025 value because vinegar is a daily table item in northern China, where a 1978 official survey cited by The World of Chinese found Taiyuan residents using about 9 liters a year. Vinegar-Led Functional Use grows fastest at 5.95% a year as Daesang moved two Hongcho drinks into functional labeling foods in June 2025, according to Asiae, while Nippon Shokuryo Shimbun credited Mizkan's functional Iikoto-su seasoning vinegar with holding sales level in Japan.
How do households and professional kitchens differ as buyers?
Based on end user, the market is categorized into households, foodservice operators and food manufacturers. Households led with 52.0% of 2025 value because shelf brands reach ordinary kitchens through national supermarkets, as Goodman Fielder sells Cornwell's white, malt and apple cider vinegars through Coles, Woolworths and independent chains in Australia. Foodservice Operators grows fastest at 4.93% a year as restaurant groups centralize purchasing, with China's restaurant chain rate reaching 23% in 2024 from 18% in 2021, according to the China Chain Store and Franchise Association white paper released with Meituan in April 2025.
Where is vinegar actually bought across the region?
Based on distribution channel, the market is categorized into modern grocery, traditional and specialty retail, e-commerce and business-to-business supply. Business-to-Business Supply led with 40.0% of 2025 value because condiment makers use acidity at industrial scale, and Kewpie said in January 2025 that its Thai plant will make about 36,000 tons of mayonnaise a year. E-Commerce grows fastest at 6.10% a year as Hengshun's online sales rose 17.4% in the third quarter of 2025 while offline sales fell 7.1%, according to a Guosheng Securities results review dated Oct. 31, 2025.
| Segment Group | Leading Sub-segment | Share, 2025 | Fastest-growing Sub-segment | CAGR, 2026–2035 |
|---|---|---|---|---|
| By Product Type | Rice and Grain Vinegar | 58.0% | Fruit Vinegar | 5.62% |
| By Application | Culinary Seasoning | 64.0% | Vinegar-Led Functional Use | 5.95% |
| By End User | Households | 52.0% | Foodservice Operators | 4.93% |
| By Distribution Channel | Business-to-Business Supply | 40.0% | E-Commerce | 6.10% |
Request a Free Sample
Fill in your details and we'll send you a free sample report.
- Sample data tables & charts
- Research methodology
Kitchen staples, aging and supplier skills drive demand
Recurring culinary and food processing demand
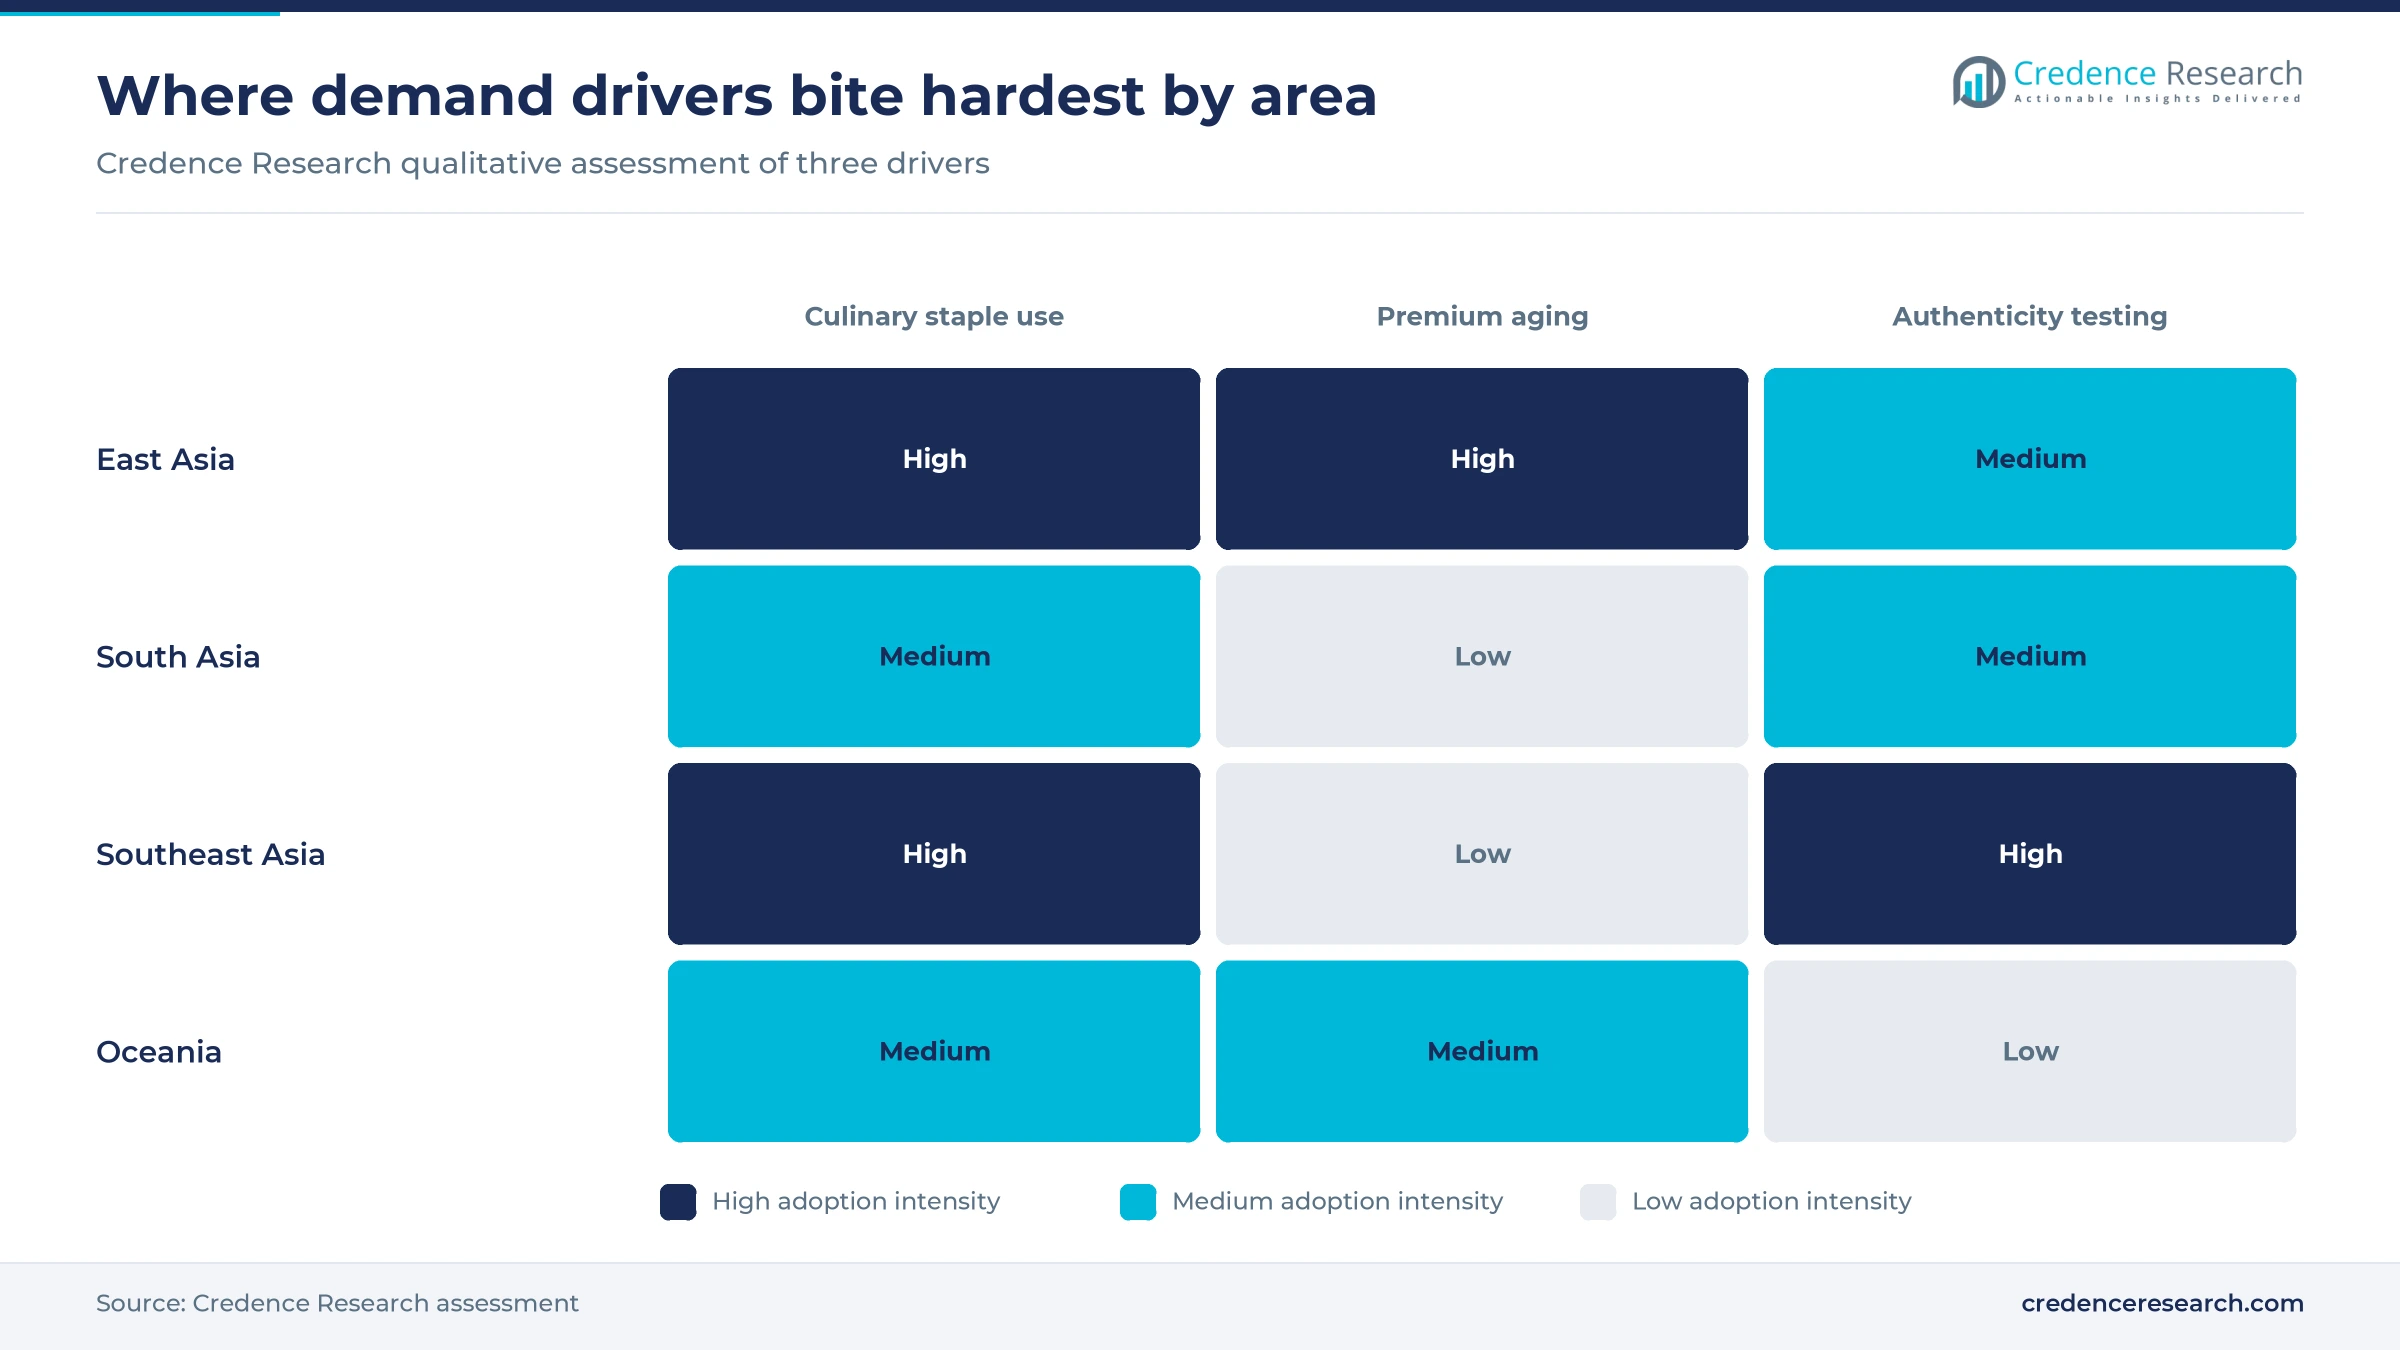
Vinegar sells as a repeat staple rather than an occasional purchase, which keeps regional volumes steady through weak consumer cycles. The World of Chinese cites a 1978 survey showing Taiyuan residents using about 9 liters a year, nearly double Hohhot, the runner-up city. That habit supports a Qingxu cluster employing nearly 100,000 people, according to China Daily. Processing demand adds a second base, because Kewpie Indonesia began full production on a new line in January 2025, lifting capacity to about 19,500 tons of mayonnaise a year. Restaurant buying reinforces both, as China's chain rate reached 23% in 2024, according to the China Chain Store and Franchise Association. As a result, Culinary Seasoning holds 64.0% of 2025 value.
Fermentation quality and product differentiation
Brewers use aging and raw material claims to lift value per bottle in a staple that would otherwise compete on price. A review archived in the National Institutes of Health library describes Shanxi aged vinegar as commonly aged for three to five years, against two to three years for Sichuan bran vinegar. Japan offers a similar premium ladder, because Marukan launched its Tamba-Sasayama junmai vinegar in March 2025 with rice grown alongside a local farm and a first run of 500 cases, according to Nippon Shokuryo Shimbun. Shuita, meanwhile, has invested more than 800 million yuan in a vinegar park near its Qingxu workshop, China Daily reported in February 2024. This positioning supports Rice and Grain Vinegar at 58.0% of value.
Specialized manufacturing and application support
Industrial buyers need consistent acidity and flavor, which favors producers that can engineer vinegar for a specific recipe. Shuita runs 190 fermentation tanks with 5G digital control of fermentation and smoking, and sells products from a few percent to more than 10 percent acidity, according to China Daily. Application support also reaches formats, since Nippon Shokuryo Shimbun reported in April 2025 that Soumi's business-use vinegars, including a 1.8-liter dashi vinegar, grew while its household line declined. In Oceania, Australian Vinegar built its business on contract, industrial and private-label supply to food manufacturers, according to Food Processing magazine. These capabilities help Foodservice Operators grow at 4.93% a year as kitchens standardize recipes.
Authenticity testing favors naturally fermented brands
Isotope testing has turned origin into a purchase reason, particularly in Southeast Asia, where cheap synthetic acid long competed with brewed product. The Philippine Nuclear Research Institute tested more than 360 samples and found about 8 in 10 were made from synthetic acetic acid. In response, the Department of Agriculture and Philippine Coconut Authority launched a Natural Vinegar Production Program on May 28, 2019, and cited a Laguna producer making 20 metric tons of coco sap vinegar monthly. NutriAsia now states that Datu Puti and Silver Swan samples passed the institute's carbon-14 test. India applies a similar logic, because FSSAI requires synthetic products to carry a label reading synthetic, prepared from acetic acid, which makes the difference visible to South Asian shoppers.
Low-sugar drinks and coconut supply open new value
Shift from sour tonics to low-sugar drinking vinegar
Drinking vinegar is moving away from sweet fruit concentrates toward lower-sugar formats that fit daily beverages in Korea and Japan. Edaily reported on June 16, 2026 that Daesang added a low-sugar pomegranate Hongcho with 3 grams of sugar and 37 calories per 100 grams, plus 40-milliliter stick packs of about 17 calories. A December 2025 winter edition then extended the idea to warm drinks, with 4 grams of sugar per 100 grams. In Japan, CJ Foods added a 350-milliliter mini size of its drinking vinegar, according to Nippon Shokuryo Shimbun. This shift explains why Vinegar-Led Functional Use grows at 5.95% a year.
Rise of digitally controlled aging at heritage brewers
Heritage brewers are adding digital process control without giving up the aging claims that justify their prices. China Daily reported in July 2024 that Shuita uses 5G control of fermentation and smoking across 190 fermentation tanks. The Qingxu county government has also formed a Vinegar Industry Development Alliance and a development fund, alongside a key laboratory in Shanxi for vinegar fermentation science. Output has followed, as the county reports annual production value of 6.5 billion yuan for 2023. Traditional methods remain the reference point, since the National Institutes of Health review notes that industrial Zhenjiang production takes about 20 days against two months for the surface method. China's brewing clusters are therefore the main beneficiaries of this investment wave.
Opportunity for coconut vinegar as a premium export
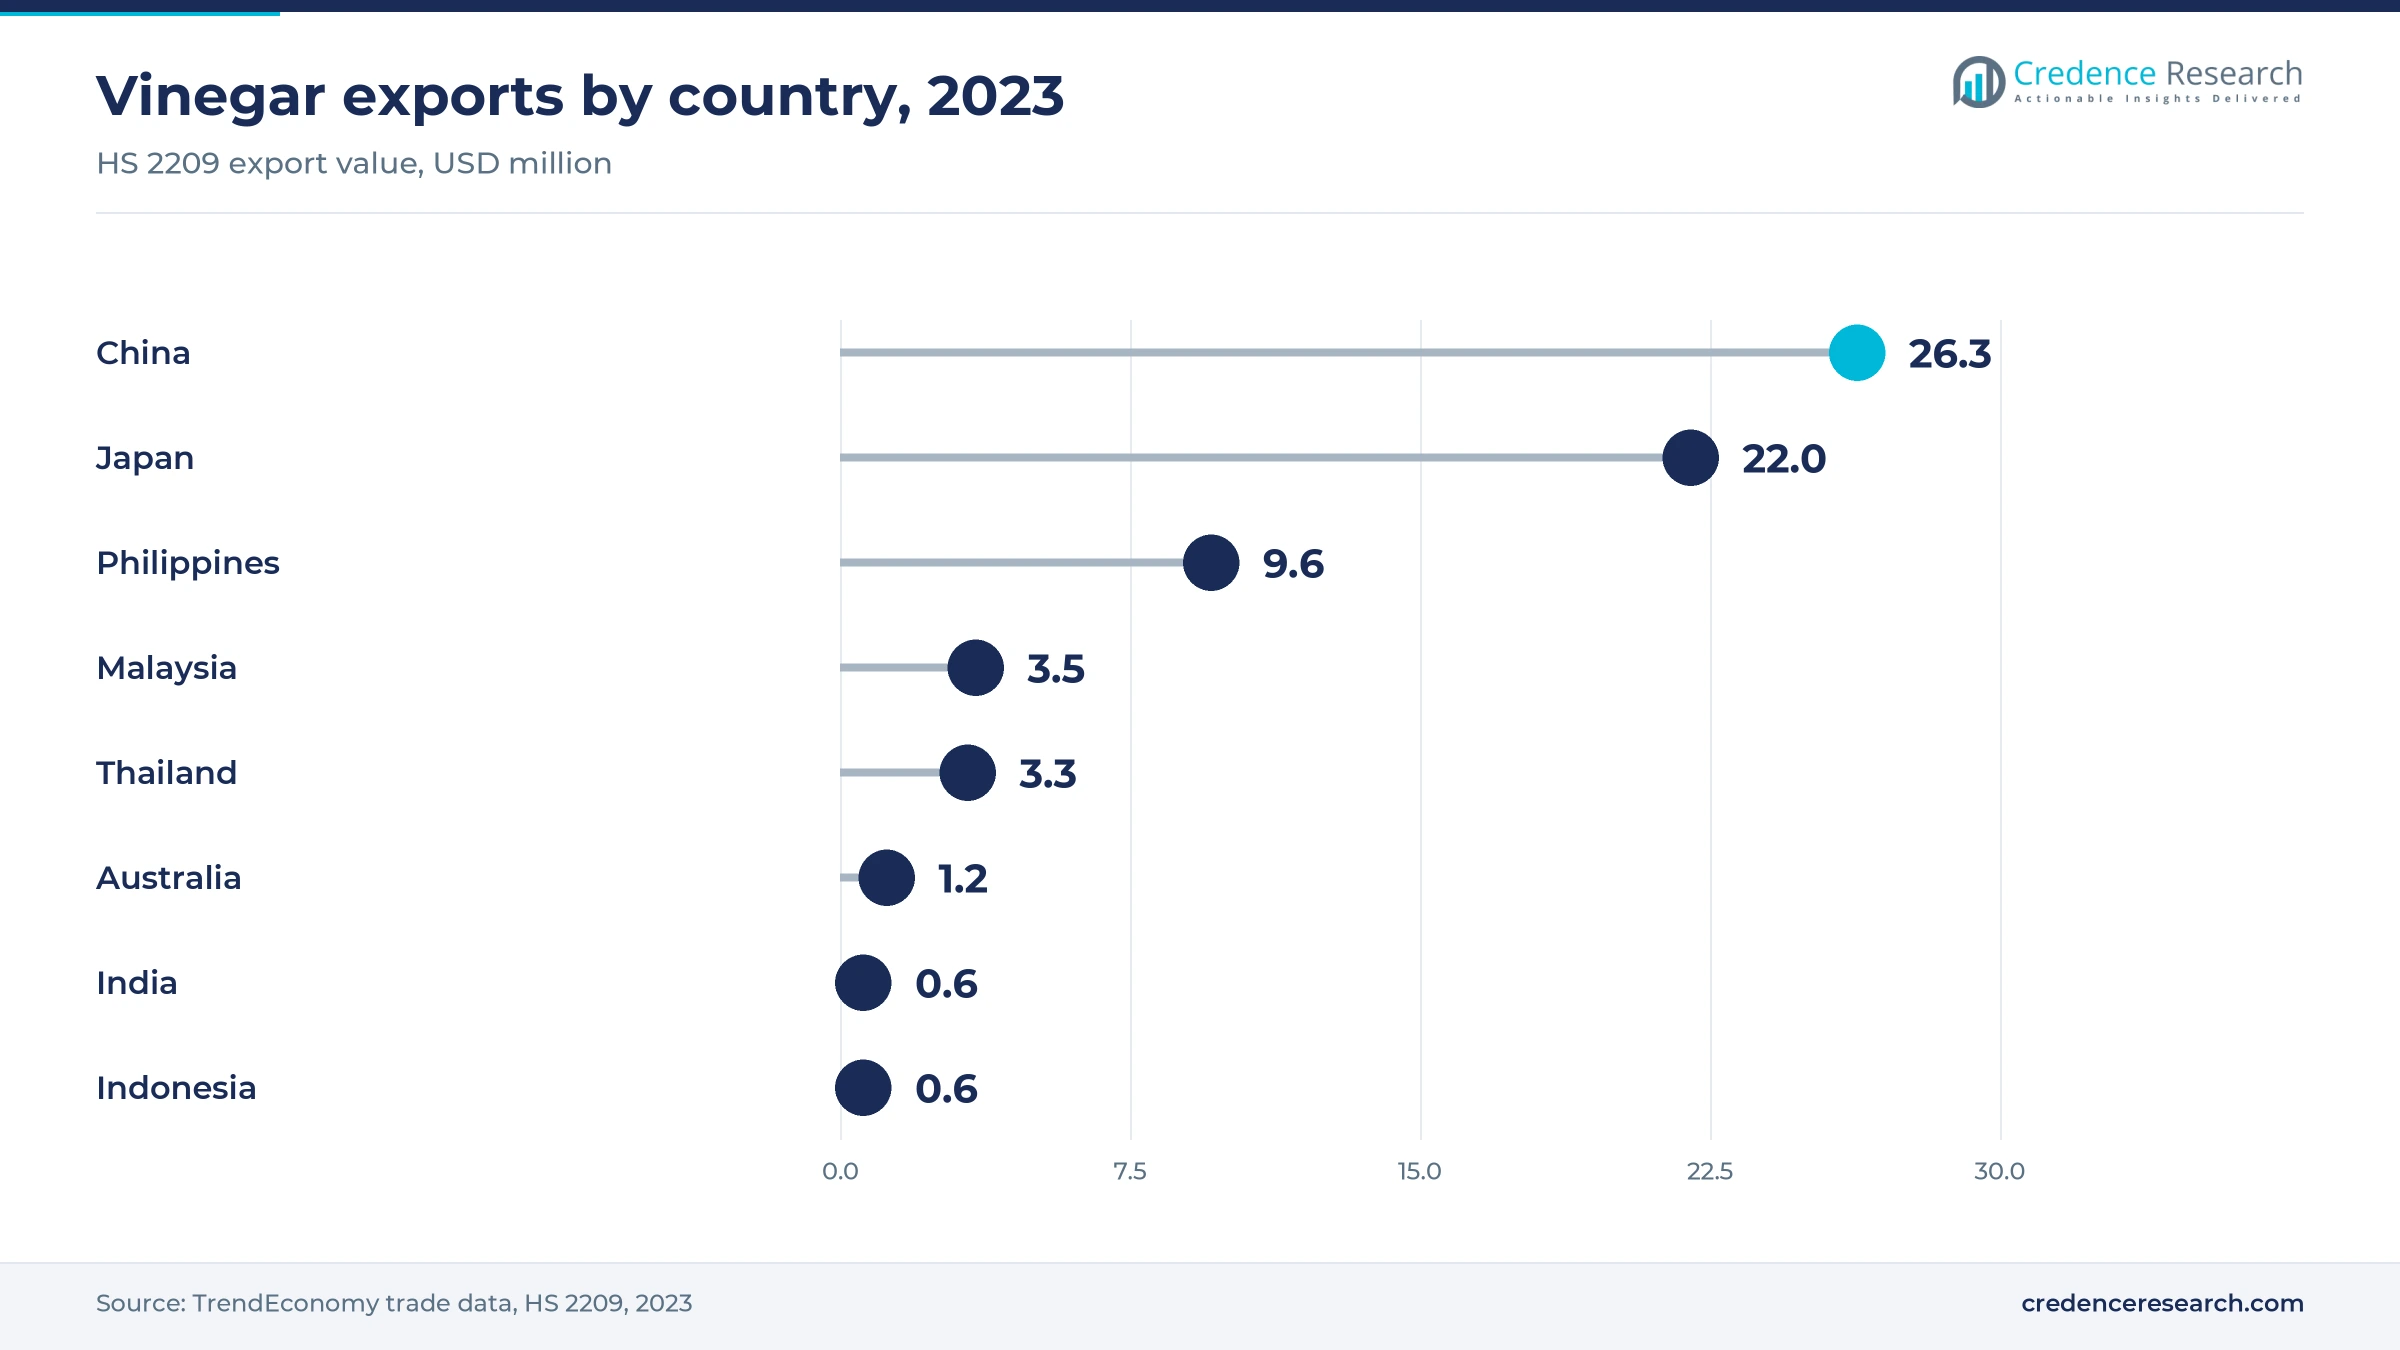
Coconut vinegar offers an opening because raw material is abundant and retail price gaps remain wide in the Philippines. Agriculture Secretary Piñol estimated in May 2019 that about 3.5 billion liters of coconut water were being wasted each year, while vinegar sold at about P50 a liter. Agriculture magazine reported in May 2021 that coco sap vinegar ferments for 8 to 12 months and sells from P5 to P85 per 375 milliliters, depending on labeling. Export capability already exists, as TrendEconomy trade data show the Philippines shipped about USD 9.6 million of vinegar in 2023. A Department of Science and Technology acetator can process coconut water into vinegar in 16 hours, which lowers entry costs for producers targeting Fruit Vinegar buyers.
Opening for Asian brewers in import-reliant Oceania
Oceania presents an opening for Asian brewers because import dependence is unusually high. TrendEconomy trade data show Australia imported about USD 21.7 million of vinegar in 2023 against exports of only USD 1.2 million, the widest gap among the countries reviewed. China already ships there, with Australia taking about USD 1.91 million of its 2023 vinegar exports, or 7.26% of the total. Shanxi mature vinegar reaches 36 countries and regions including Australia, according to China Daily. Entry requires little reformulation for grain brewers, since Standard 2.10.1 of the Australia New Zealand Food Standards Code sets a floor of 40 grams of acetic acid per kilogram. Oceania therefore offers room for growth beyond its small 5.6% regional share.
Authenticity, rice costs and weak Japanese demand weigh in
Synthetic product undermines trust in brewed vinegar
Cheap synthetic product erodes confidence and pricing for genuine brewers across lower-income markets. The Philippine Star reported in February 2020 that about 80 percent of tested brands contained synthetic industrial acetic acid, and regulators were still awaiting a standard formulation. The Philippine FDA had named five local brands in an advisory dated June 4, 2019. Honest producers therefore carry testing costs while competing against lower-priced bottles. Clear provenance tests and enforceable national standards would ease this pressure, though adoption remains uneven outside the largest brands.
Rice prices squeeze Japanese brewing margins
Input costs weigh on rice vinegar makers because grain makes up the core of a junmai recipe. Japan's farm ministry reported an average supermarket rice price of 4,275 yen per 5 kilograms in September 2025, and a record 4,444 yen that November, according to Jiji Press and Rice News Today. Brewers face a difficult choice between passing on increases and defending volumes in a shrinking category. Smaller regional producers are most exposed, and Marukan's 500-case junmai release shows one response, a limited premium run.
A shrinking Japanese category limits volume growth
Japan no longer provides automatic volume growth for established brands. Nippon Shokuryo Shimbun reported in April 2025 that both seasoning and drinking vinegar have trended down since a 2020 peak, as pandemic home cooking faded and the fruit vinegar drink boom settled. Mizkan held sales roughly level in the year ended February 2025 helped by functional and new-flavor lines. Producers therefore need new usage occasions, and they must spend more on launches to protect the same shelf share.
Uneven acidity rules complicate regional trade
Exporters face differing composition rules that raise compliance work for even a simple bottled staple. India's FSSAI sets a minimum of 3.75% acidity and bars fortifying brewed vinegar with acetic acid, while Australia and New Zealand apply a floor of 40 grams per kilogram under Standard 2.10.1. China notified the World Trade Organization of a fermented vinegar standard covering sites, facilities and personnel on Sept. 4, 2015, according to the USDA. Small brewers bear the heaviest burden, because each destination adds its own label and composition review.
East Asia dominates as South Asia gains the most pace
| Region | Value, 2025 (USD billion) | Share, 2025 | CAGR, 2026–2035 |
|---|---|---|---|
| East Asia | 1.88 | 70.9% | 3.66% |
| South Asia | 0.34 | 12.7% | 5.26% |
| Southeast Asia | 0.29 | 10.8% | 4.86% |
| Oceania | 0.15 | 5.6% | 3.36% |
East Asia holds the largest brewing base
East Asia held 70.9% of 2025 value and grows at 3.66% a year, the slowest pace among the larger areas because household use is already high. Qingxu county alone accounts for about 20% of China's national vinegar total, according to China Daily, and China exported about USD 26.3 million of vinegar in 2023, TrendEconomy data show. Japan added about USD 22.0 million of exports the same year. As a result, premium aging rather than volume drives most incremental value here, especially in Fruit Vinegar lines.
South Asia gains from brewed product upgrades
South Asia held 12.7% of 2025 value and grows fastest at 5.26% a year. FSSAI recognizes brewed and synthetic vinegar as separate categories, and each must reach at least 3.75% acidity, so labels make the choice visible to shoppers. TrendEconomy data show India imported about USD 2.09 million of vinegar in 2023 against exports of about USD 0.65 million, which indicates a largely domestic supply base. Mumbai-based Plix has also sold apple cider tablets online since 2020.
Southeast Asia pairs coconut supply with new plants
Southeast Asia held 10.8% of 2025 value and grows at 4.86% a year, combining a coconut-based vinegar tradition with growing condiment production. The Philippines exported about USD 9.6 million of vinegar in 2023, while Malaysia imported about USD 7.2 million, according to TrendEconomy data. Kewpie also scheduled new lines in Thailand and Indonesia for 2025, adding local demand for food-grade acidity. NutriAsia's Marilao plant earned FSSC 22000 Version 6 certification on June 30, 2025, according to the Daily Tribune, which supports its supply to large grocers.
Oceania relies on imports and heritage brands
Oceania held 5.6% of 2025 value and grows at 3.36% a year, the slowest rate in the region, because the population is small and category use is mature. Cornwell's first vinegar dates to 1895, according to Goodman Fielder, and the brand remains in Coles and Woolworths. Australian imports reached about USD 21.7 million in 2023, TrendEconomy data show, so Asian and European bottles compete directly on the shelf. Local supply also exists, as Australian Vinegar planned a $1.5 million Stanthorpe facility in Queensland in 2015 for contract and private-label work.
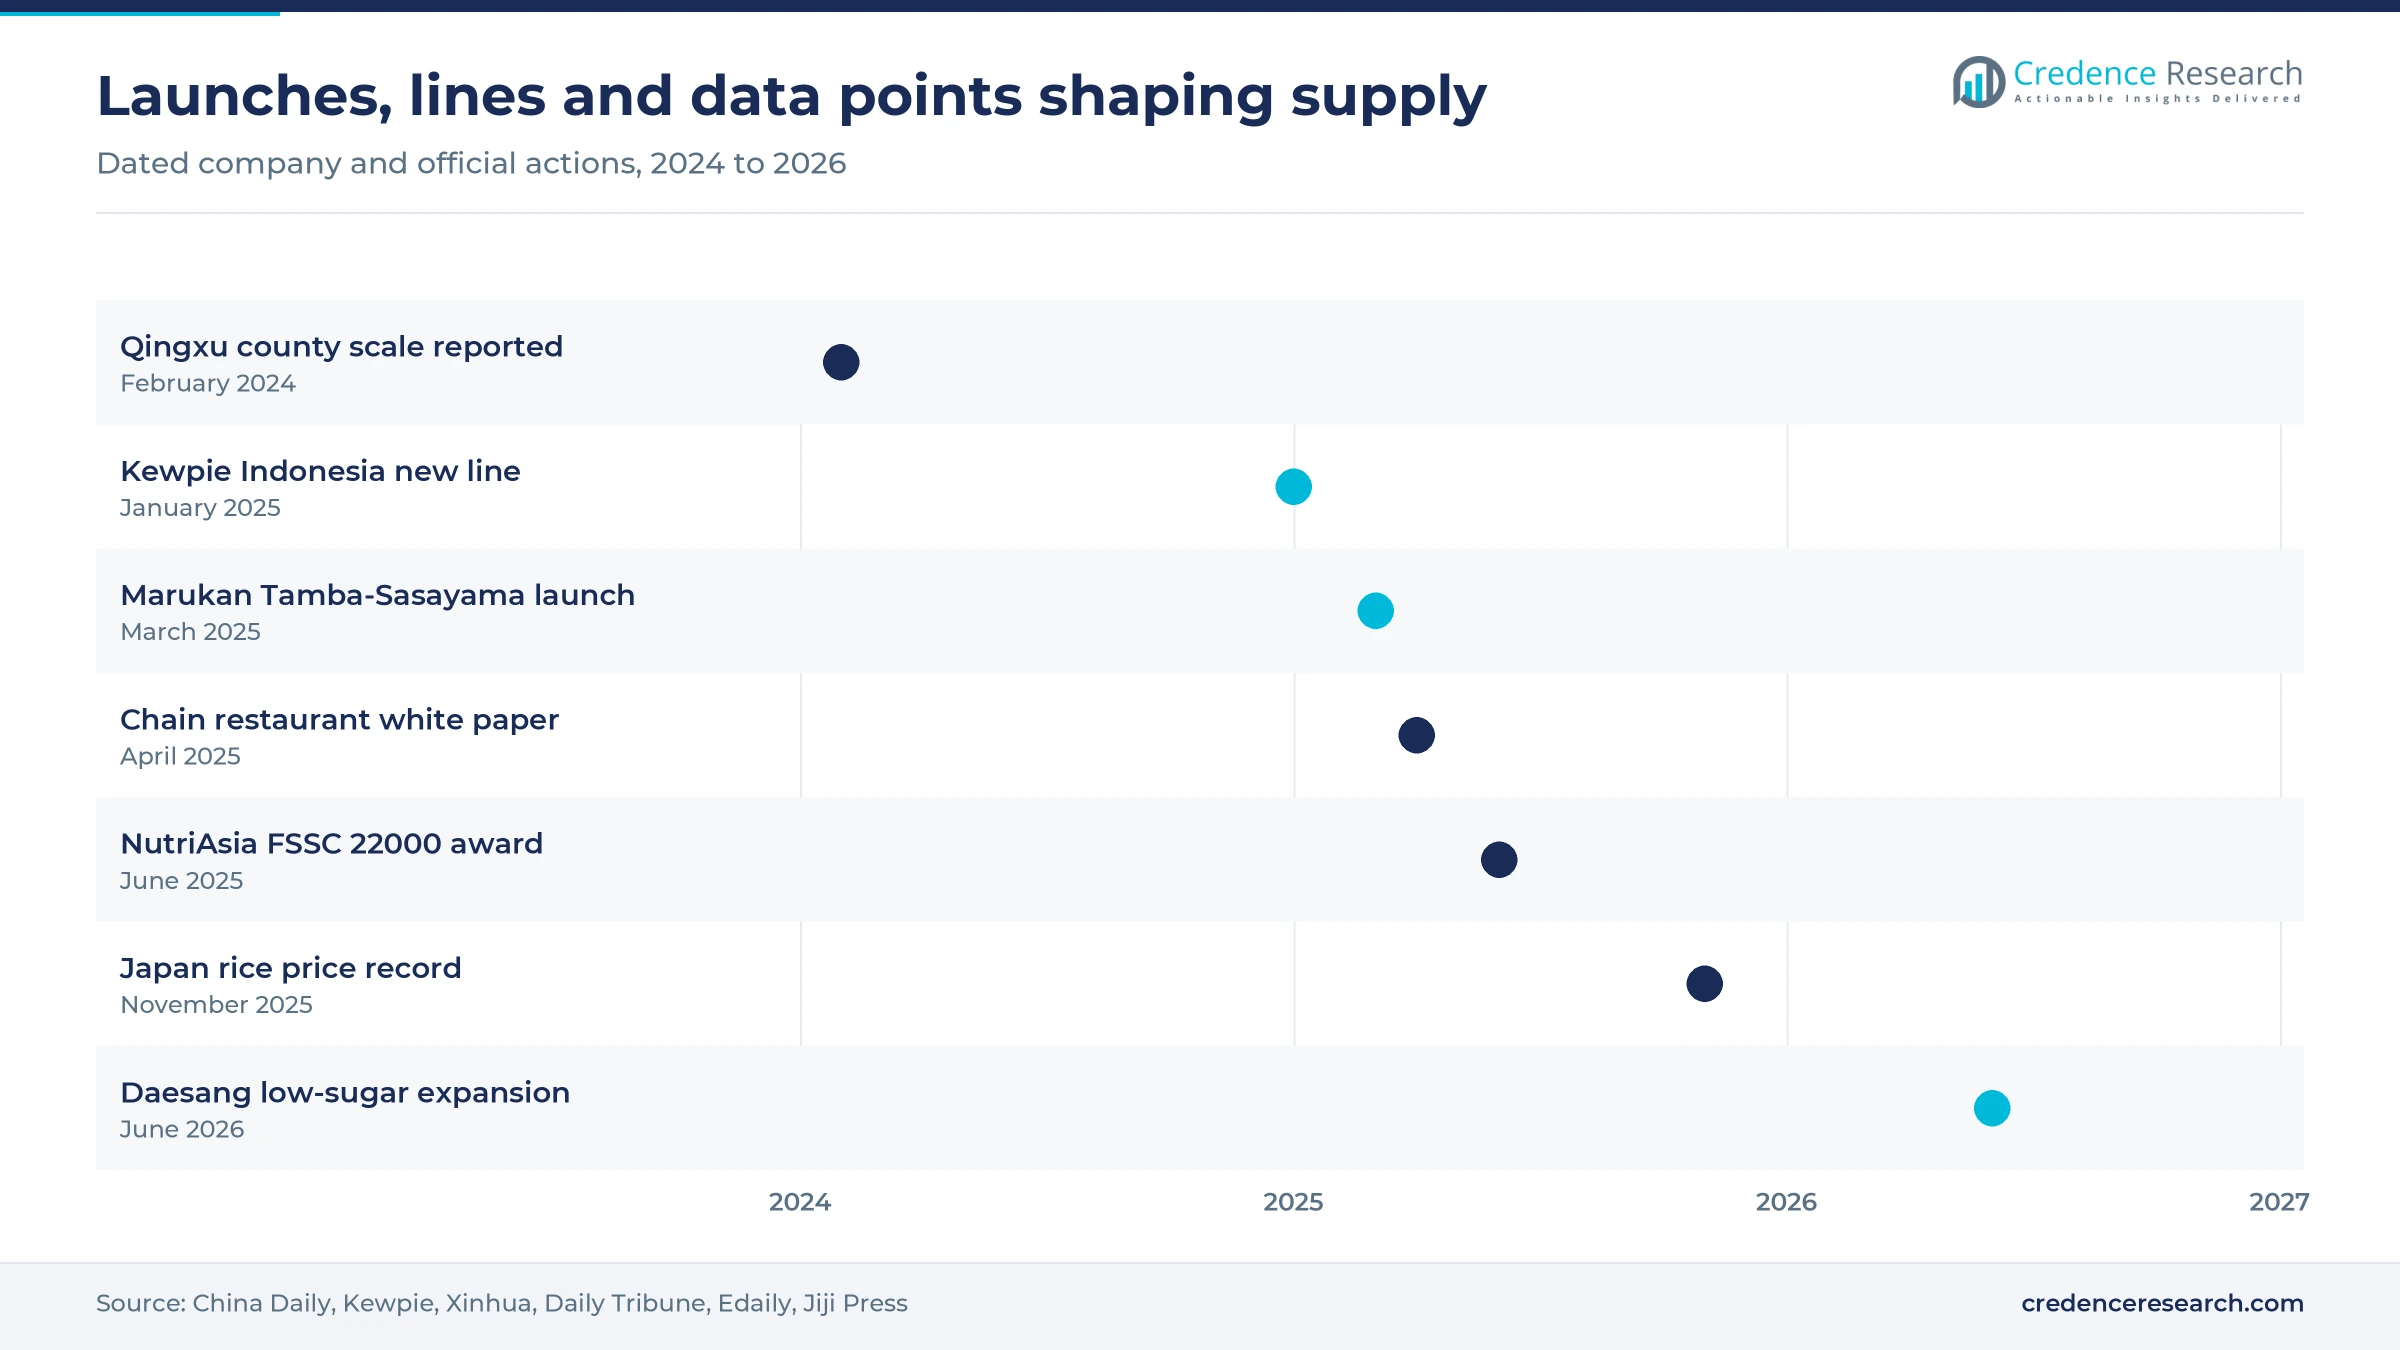
Recent launches, lines and standards reshaping supply
| Development | Status and market relevance |
|---|---|
| In June 2026, Daesang announced three low-sugar Hongcho items and planned sales in Japan and Vietnam for the second half of 2026. | Announced; extends Korean drinking vinegar into two neighboring markets. |
| In June 2025, NutriAsia's Marilao plant earned FSSC 22000 Version 6 certification after an SGS audit, according to the Daily Tribune. | Completed; supports food safety claims for its grocery and export supply. |
| In March 2025, Marukan launched Tamba-Sasayama junmai vinegar in an initial run of 500 cases, made by static fermentation. | On sale; tests the premium ceiling for Japanese rice vinegar. |
| In January 2025, Kewpie said new lines would begin full production in Indonesia and, by plan, in Thailand in April 2025. | Started; raises regional demand for food-grade acidity in condiments. |
Fermentation route sets flavor, cost and label claims
- Solid-state fermentation brews grain on moist substrates without free-flowing water, and it remains the base of Shanxi aged vinegar and most Zhenjiang aromatic vinegar production.
- Liquid-state fermentation uses stirred or static liquid vessels, as in Yongchun Monascus vinegar and the Department of Science and Technology acetator, shortening production for buyers focused on cost.
- Food-grade acid blending dilutes acetic acid for low-cost acidity, which India permits only when the label states that the product is synthetic and prepared from acetic acid.
- Carbon-14 assay separates plant-based from petroleum-based acid, and the Philippine Nuclear Research Institute has used it to test more than 360 samples sold in the country.
Need a Custom Version of This Report?
Tailor the scope, geography, or segments to your exact requirements.
- Custom geography or segment scope
- Direct access to our analyst team
Heritage brewers and national brands hold their home markets
Competition is regional rather than pan-Asian, because vinegar styles are tied to local cooking and most brands hold their strongest position at home. Jiangsu Hengshun anchors the Zhenjiang aromatic style and sold through 2,107 dealers at the end of 2025, according to Guosheng Securities. Shanxi Shuita competes on aged heritage, 5G-controlled tanks and a visitor park in Qingxu. Mizkan and Marukan compete on Japanese seasoning and rice vinegar shelves, while NutriAsia uses carbon-14 test results to defend Datu Puti and Silver Swan in the Philippines. Daesang takes a different route through Hongcho drinking vinegar, and Goodman Fielder holds Australian shelves with Cornwell's. These producers increasingly contest adjacent seasoning and spices occasions through ready-to-use formats, while smaller brewers depend on specialty retail and private-label contracts.
Companies profiled and their roles in this market
| Company | Type | Role in the market |
|---|---|---|
| Mizkan Holdings | Japanese brewer | Sells Kantan-su and the functional Iikoto-su seasoning vinegar in Japan |
| Jiangsu Hengshun Vinegar | Listed Chinese brewer | Zhenjiang aromatic vinegar sold through 2,107 dealers at end 2025 |
| Shanxi Shuita Vinegar | Chinese aged vinegar brewer | Runs 190 digitally controlled tanks in Qingxu county |
| Marukan Vinegar | Japanese rice vinegar brewer | Launched Tamba-Sasayama junmai vinegar in March 2025 |
| NutriAsia | Philippine condiment group | Owns Datu Puti and Silver Swan and cites carbon-14 test results |
| Daesang | Korean food group | Hongcho drinking vinegar with low-sugar line under Cheongjeongwon |
| Goodman Fielder | Australasian food group | Sells Cornwell's vinegars through major Australian grocers |
Provenance decides who earns the premium
Credence Research's view is that value in this market will move toward producers that can prove how their vinegar was made. Isotope testing in the Philippines, separate labels in India and aged claims in China all point the same way, and buyers now reward evidence over tradition alone. The strongest near-term openings sit in low-sugar drinks, which also link to apple cider supplements, and in coconut supply. The biggest uncertainty is Japanese demand, because rice costs and a shrinking category could weaken a key premium reference for the entire region.
How the regional estimate was built
The report uses 2025 as the base year and presents market values in USD billion through 2035. Market values come from the Credence Research model, and regional and segment shares and growth rates are Credence Research estimates. Public inputs include China Daily reports, the Philippine Nuclear Research Institute, the Philippine Department of Agriculture, FSSAI rules as summarized by Food Safety Helpline, the Australia New Zealand Food Standards Code, National Institutes of Health library articles, TrendEconomy trade data, company releases and named press reports. No interviews or surveys were conducted for this edition, and the most assumption-heavy figures are the segment shares.
Steady volume with value moving toward proven fermentation
Through 2035, the market should keep growing at a measured pace, reaching USD 3.94 billion as staple volumes hold and value per liter rises. Grain brewers in China will likely remain the largest source of value, while restaurant chains and condiment plants deepen bulk contracts for sauces and condiments. Drinking formats should extend beyond Korea if Daesang's planned Japan and Vietnam launches succeed. Demand for fermented foods also supports brewed claims, and tighter synthetic labeling in South and Southeast Asia could widen the gap between tested and untested brands.
Frequently Asked Questions
How big is the Asia Pacific vinegar market?
Which area leads the Asia Pacific vinegar market?
Which product type holds the largest share?
Which product type grows fastest?
Why does synthetic vinegar matter to this market?
Which channel leads vinegar sales in Asia Pacific?
What is the main challenge for Japanese vinegar makers?
Who are the main companies in this market?
Table of Content
Chapter 1 Market Segmentation
- 1.1 Segmentation Framework
- 1.1.1 Product and Service Classification
- 1.1.2 Application and End-Use Classification
- 1.1.3 Technology and Solution Classification
- 1.1.4 Customer and Distribution Channel Classification
- 1.1.5 Geographic Segmentation
- 1.1.6 Market Segment Definitions and Boundaries
- 1.2 By Product Type
- 1.2.1 Rice and Grain Vinegar
- 1.2.2 Spirit Vinegar and Food-Grade Substitutes
- 1.2.3 Fruit Vinegar
- 1.2.4 Cane and Coconut Vinegar
- 1.3 By Application
- 1.3.1 Culinary Seasoning
- 1.3.2 Food Processing
- 1.3.3 Vinegar-Led Functional Use
- 1.4 By End User
- 1.4.1 Households
- 1.4.2 Food Manufacturers
- 1.4.3 Foodservice Operators
Chapter 2 Introduction
- 2.1 Report Objectives and Scope
- 2.2 Product Definition and Industry Terminology
- 2.3 Market Inclusions and Exclusions
- 2.4 Research Process
- 2.4.1 Primary Research and Expert Interviews
- 2.4.2 Secondary Research and Source Review
- 2.4.3 Top-Down and Bottom-Up Estimation
- 2.4.4 Data Triangulation and Verification
- 2.5 Market Size Measurement Basis
- 2.5.1 2025: USD 2.65 billion → 2035: USD 3.94 billion
- 2.6 Historical and Forecast Reference Periods
- 2.6.1 Historical Period: 2018-2025
- 2.6.2 Base Year: 2025
- 2.6.3 Forecast Period: 2025-2035
- 2.7 Research Assumptions and Limitations
Chapter 3 Executive Summary
- 3.1 Market Snapshot and Key Findings
- 3.2 Base-Year Market Size, 2025
- 3.3 Forecast Market Size, 2035
- 3.4 Revenue and Volume Growth Outlook
- 3.5 Key Demand and Supply Indicators
- 3.6 Leading Market Segments
- 3.7 Fastest-Growing Market Opportunities
- 3.8 Regional Performance Highlights
- 3.9 Technology and Industry Transformation
- 3.10 Competitive Landscape Summary
- 3.11 Analyst View and Strategic Implications
Chapter 4 Asia Pacific Vinegar Market Trends and Developments
- 4.1 Historical Industry Development, 2018-2025
- 4.2 Recent Market Trends and Developments
- 4.3 Demand and Customer Behavior Trends
- 4.4 Technology and Product Innovation
- 4.5 Artificial Intelligence, Automation and Digitalization
- 4.6 Local Manufacturing and Supply Chain Realignment
- 4.7 Industry Partnerships, Mergers and Acquisitions
- 4.8 Sustainability and Circular Economy Developments
- 4.9 Government and Private Sector Investment Trends
- 4.10 Emerging Business Models and Commercialization
- 4.11 Industry Developments and Announcements
Chapter 5 Asia Pacific Vinegar Market Production, Supply and Demand Analysis
- 5.1 Demand Trend and Consumption Analysis, 2018-2025
- 5.2 Demand Forecast, 2025-2035
- 5.3 Production and Output Trend, 2018-2025
- 5.4 Production and Output Forecast, 2025-2035
- 5.5 Installed Capacity and Capacity Utilization
- 5.6 Company-Wise Production Plants and Statistics
- 5.6.1 Installed Production Capacity
- 5.6.2 Actual Production
- 5.6.3 Planned Capacity and Expansion Targets
- 5.7 Supply Chain Structure and Procurement Trends
- 5.8 Supply-Demand Gap and Bottlenecks
- 5.9 Import Dependence and Sourcing Structure
- 5.10 Contract Manufacturing and Outsourcing
- 5.11 Regional Supply and Demand Concentration
Chapter 6 Asia Pacific Vinegar Market Pricing Analysis
- 6.1 Pricing Structure and Measurement
- 6.2 Historical Pricing Trends, 2018-2025
- 6.3 Pricing Outlook, 2025-2035
- 6.4 Average Selling Price and Unit Economics
- 6.5 Pricing by Product and Market Segment
- 6.6 Geographic Pricing Differences
- 6.7 Key Input, Energy, Labor and Logistics Costs
- 6.8 Contract Pricing and Purchasing Models
- 6.9 Pricing Sensitivity and Competitive Positioning
- 6.10 Price, Margin and Profitability Implications
Chapter 7 Asia Pacific Vinegar Market Dynamics
- 7.1 Market Growth Drivers
- 7.1.1 Demand-Side Drivers
- 7.1.2 Technology and Innovation Drivers
- 7.1.3 Infrastructure and Investment Drivers
- 7.1.4 Regulatory and Policy Drivers
- 7.2 Market Restraints
- 7.2.1 Cost and Affordability Constraints
- 7.2.2 Technology and Adoption Barriers
- 7.2.3 Supply Chain and Operational Constraints
- 7.3 Market Challenges
- 7.3.1 Competitive Pressure and Margin Erosion
- 7.3.2 Skills, Infrastructure and Implementation Gaps
- 7.4 Emerging Market Opportunities
- 7.5 Market Dynamics Impact and Time-Horizon Assessment
Chapter 8 Asia Pacific Vinegar Value Chain Analysis
- 8.1 Industry Value Chain Overview
- 8.2 Upstream Suppliers and Critical Inputs
- 8.3 Technology and Component Providers
- 8.4 Manufacturing or Service Delivery
- 8.5 Distribution, Channel Partners and Integrators
- 8.6 Downstream Applications and End Users
- 8.7 Value Addition and Profit Pools
- 8.8 Vertical Integration and Outsourcing
- 8.9 Supplier Concentration and Risk
- 8.10 Supply Chain Localization and Resilience
Chapter 9 Asia Pacific Vinegar Market Regulations and Policies
- 9.1 Relevant Laws, Standards and Compliance Frameworks
- 9.2 Product, Service, Safety and Quality Requirements
- 9.3 Government Policies, Incentives and Subsidies
- 9.4 Imports, Exports and Trade Barriers
- 9.5 Public Procurement and Local Content Requirements
- 9.6 Environmental and Sustainability Compliance
- 9.7 Upcoming Policy Changes and Market Implications
Chapter 10 Asia Pacific Vinegar Market Hotspots and Opportunities
- 10.1 Market Opportunity Mapping and Growth Hotspots
- 10.2 High-Growth Applications and Customer Groups
- 10.3 Underserved Markets and White-Space Opportunities
- 10.4 Emerging Technology and Product Opportunities
- 10.5 New Capacity and Investment Hotspots
- 10.6 Market Entry and Expansion Opportunities
- 10.7 Distribution and Partnership Opportunities
- 10.8 Near-Term and Long-Term Commercial Potential
- 10.9 Opportunity Attractiveness and Execution Risks
Chapter 11 Asia Pacific Vinegar Market Outlook, 2025-2035
- 11.1 Market Size and Analysis
- 11.1.1 Revenue (Market Measurement: 2025: USD 2.65 billion → 2035: USD 3.94 billion)
- 11.1.2 Market Volume and Quantity Sold
- 11.1.3 Historical Market Size, 2018-2025
- 11.1.4 Base-Year Market Size, 2025
- 11.2 Market Forecast, 2025-2035
- 11.2.1 Revenue Forecast to 2035
- 11.2.2 Volume Forecast to 2035
- 11.2.3 CAGR and Year-on-Year Growth
- 11.2.4 Incremental Revenue Opportunity
- 11.3 Forecast Assumptions and Scenario Analysis
- 11.3.1 Base-Case Forecast
- 11.3.2 Optimistic and Conservative Scenarios
- 11.3.3 Technology, Pricing and Policy Sensitivities
- 11.4 Market Attractiveness and Growth Outlook
Chapter 12 Asia Pacific Vinegar Market Segmentation and Outlook
- 12.1 Segmentation Summary and Market Shares, 2025
- 12.2 Largest and Fastest-Growing Segments
- 12.3 By Product Type - Market Size and Forecast, 2025-2035
- 12.3.1 Segment Definition and Scope
- 12.3.2 Historical Market Size, 2018-2025
- 12.3.3 Revenue Forecast, 2025-2035
- 12.3.4 Volume Forecast, 2025-2035
- 12.3.5 Base-Year Market Share, 2025
- 12.3.6 Segment CAGR and Growth Drivers
- 12.3.7 Subsegment Market Size and Forecast
- 12.3.7.1 Rice and Grain Vinegar
- 12.3.7.2 Spirit Vinegar and Food-Grade Substitutes
- 12.3.7.3 Fruit Vinegar
- 12.3.7.4 Cane and Coconut Vinegar
- 12.3.8 Subsegment Pricing and Adoption Trends
- 12.3.9 Leading Suppliers and Competition
- 12.3.10 Regional Demand and Opportunities
- 12.4 By Application - Market Size and Forecast, 2025-2035
- 12.4.1 Segment Definition and Scope
- 12.4.2 Historical Market Size, 2018-2025
- 12.4.3 Revenue Forecast, 2025-2035
- 12.4.4 Volume Forecast, 2025-2035
- 12.4.5 Base-Year Market Share, 2025
- 12.4.6 Segment CAGR and Growth Drivers
- 12.4.7 Subsegment Market Size and Forecast
- 12.4.7.1 Culinary Seasoning
- 12.4.7.2 Food Processing
- 12.4.7.3 Vinegar-Led Functional Use
- 12.4.8 Subsegment Pricing and Adoption Trends
- 12.4.9 Leading Suppliers and Competition
- 12.4.10 Regional Demand and Opportunities
- 12.5 By End User - Market Size and Forecast, 2025-2035
- 12.5.1 Segment Definition and Scope
- 12.5.2 Historical Market Size, 2018-2025
- 12.5.3 Revenue Forecast, 2025-2035
- 12.5.4 Volume Forecast, 2025-2035
- 12.5.5 Base-Year Market Share, 2025
- 12.5.6 Segment CAGR and Growth Drivers
- 12.5.7 Subsegment Market Size and Forecast
- 12.5.7.1 Households
- 12.5.7.2 Food Manufacturers
- 12.5.7.3 Foodservice Operators
- 12.5.8 Subsegment Pricing and Adoption Trends
- 12.5.9 Leading Suppliers and Competition
- 12.5.10 Regional Demand and Opportunities
- 12.6 Segment Growth Comparison
- 12.7 Segment Attractiveness and Priority Matrix
Chapter 13 Asia Pacific Vinegar End-Use and Application Market Outlook
- 13.1 End-Use Industry and Customer Demand Structure
- 13.2 Leading Applications and Customer Groups
- 13.3 End-Use Market Size, Share and Forecast
- 13.4 Major End-Use Industry Deep Dives
- 13.4.1 Customer Requirements and Use Cases
- 13.4.2 Demand and Replacement Cycles
- 13.4.3 Technical and Regulatory Considerations
- 13.4.4 Purchasing and Procurement Models
- 13.4.5 Leading Vendors and Distribution Channels
- 13.4.6 Forecast and Commercial Opportunities
- 13.5 Emerging Applications and Cross-Segment Demand
- 13.6 End-Use Industry Investment Priorities
Chapter 14 Asia Pacific Vinegar Geographic Market Outlook, 2025-2035
- 14.1 Regional Market Size and Country-Level Shares, 2025
- 14.2 Country Market Size Comparison, 2025
- 14.3 Country Market Forecasts, 2025-2035
- 14.4 Subregional Industrial and Demand Clusters
- 14.5 Intra-Regional Pricing and Cost Differences
- 14.6 Cross-Border Trade and Supply Networks
- 14.7 Regional Supply and Demand Balances
- 14.8 Country Opportunity Comparison and Prioritization
Note: Every listed country is covered on the structure shown under the first country.
Chapter 15 Asia Pacific Vinegar Technology, Innovation and Sustainability Outlook
- 15.1 Technology Landscape and Maturity
- 15.2 Product, Process and Service Innovation
- 15.3 AI, Automation and Digital Tools in the Industry
- 15.4 Technology Adoption and Performance Benchmarking
- 15.5 Innovation Pipeline and R&D Investment
- 15.6 Patent and Intellectual Property Trends
- 15.7 Energy Efficiency and Resource Management
- 15.8 Sustainability, Recycling and Circularity
- 15.9 Technology Roadmap, 2025-2035
- 15.10 Risks of Obsolescence and Technology Substitution
Chapter 16 Asia Pacific Vinegar Market Key Strategic Imperatives
- 16.1 Growth and Market Entry Priorities
- 16.2 High-Return Products and Segments
- 16.3 Pricing, Profitability and Cost Optimization
- 16.4 Technology Investment and Product Differentiation
- 16.5 Supply Chain Localization and Resilience
- 16.6 Distribution and Customer Acquisition
- 16.7 Partnership, Acquisition and Capacity Strategy
- 16.8 Regional Expansion Priorities
- 16.9 Short-, Medium- and Long-Term Actions
Chapter 17 Competition Outlook
- 17.1 Industry Competition Characteristics
- 17.2 Market Structure and Concentration
- 17.3 Market Share and Competitive Positioning, 2025
- 17.4 Company-Wise Revenue and Product Benchmarking
- 17.5 Production and Service Capacity Benchmarking
- 17.6 Technology, Pricing and Differentiation
- 17.7 Regional Footprint and Distribution Strength
- 17.8 Mergers, Acquisitions and Strategic Alliances
- 17.9 New Entrants and Competitive Threats
- 17.10 Porter's Five Forces and Industry Attractiveness
- 17.11 Competitive Outlook, 2025-2035
Chapter 18 Company Profiles
- 18.1 Company Coverage and Selection Criteria
- 18.2 Mizkan Holdings
- 18.2.1 Business Description
- 18.2.2 Company Ownership and Geographic Presence
- 18.2.3 Product and Service Portfolio
- 18.2.4 Manufacturing and Operating Footprint
- 18.2.5 Production Capacity and Expansion Plans
- 18.2.6 Financial Performance and Investment
- 18.2.7 Market Share and Competitive Position
- 18.2.8 Technology and Innovation Capabilities
- 18.2.9 Strategic Alliances or Partnerships
- 18.2.10 Recent Developments
- 18.2.11 Growth Strategy and Outlook
- 18.3 Jiangsu Hengshun Vinegar
- 18.4 Shanxi Shuita Vinegar
- 18.5 Marukan Vinegar
- 18.6 NutriAsia
- 18.7 Daesang
- 18.8 Goodman Fielder
- 18.9 Other Relevant Market Participants
Note: Every listed company is profiled on the structure shown under the first company. The company list is preliminary and may change based on research findings, market developments, data availability and client requirements.
Chapter 19 Disclaimer
- 19.1 Research and Forecast Disclaimer
- 19.2 Data Source and Estimation Limitations
Note: The depth of individual sections depends on data availability for this market. Volume, capacity, trade and other unit-based metrics are included where applicable.

