
Quick answer
An onion powder plant slices high-solids white onions, dries them to about 4–5% moisture and mills them into powder and granules. This overview models a greenfield plant making 4,000 tonnes a year, with estimated CapEx of USD 6–20 million by build standard and region. Gross margin is estimated at 12–28% on an assumed specification-grade mix, with payback at 4–12 years. Plain bulk powder at recent Indian quotes may not cover modeled costs.
Viable for processors with contracted high-solids onions, low-cost heat and specification-grade customers; a plant selling plain bulk powder at recent Indian quotes may not cover its modeled costs.
Onion Powder plant: key highlights
| Parameter | Indicative value | Note |
|---|---|---|
| Plant capacity | 4,000 tonnes of finished product per year | About 16 tonnes a day over 250 operating days, using 32,000–40,000 tonnes of fresh onions at full capacity |
| Total CapEx | USD 6–20 million | Greenfield; low end a basic build in a low-cost region, high end a fuller specification; U.S. or EU sites may exceed it; excludes working capital |
| Raw material share of operating cost | 50–60% | Modeled at 8–10 kg of fresh onions per kg of product |
| Gross margin | 12–28% | At an assumed USD 2.2–3.2 per kg blended price and assumed USD 0.10–0.16 per kg onions |
| Payback period | 4–12 years | From commissioning at 80% utilization; weak price and high-CapEx pairings fall outside this band |
| IRR | Available in report | Post-tax, 10-year model |
| Break-even | Available in report | Capacity utilization basis |
Ranges assume a 4,000 tonnes-per-year greenfield plant, 250 operating days, 80% utilization and 2026 prices. The blended price of USD 2.2–3.2 per kg, onions at USD 0.10–0.16 per kg and land rates are assumed. Conversions use assumed rates of USD 1.10 per euro, 90 rupees and 50 Egyptian pounds per USD. CapEx is scaled from disclosed projects and excludes working capital. The full report can be customized to any country or region.
What is onion powder?
Onion powder is a shelf-stable seasoning made by drying sliced bulbs of Allium cepa and grinding them to a fine, free-flowing particle. Food manufacturers favor it because it delivers a measured onion flavor without peeling, chopping, cold storage or added water.
The same drying line usually makes a family of products. Sliced and kibbled onion, chopped, minced and granulated pieces and powder differ mainly in particle size, and toasted grades add a roasted note. White onions dominate because high-solids varieties yield more product and stronger pungency, while red and pink types serve regional demand. Buyers judge lots on moisture, color, flavor, microbial load, pesticide residues and foreign matter, and ISO 5559 sets a widely used specification for dehydrated onion.
Dried onions, whole, cut, sliced, broken or in powder, fall under Harmonized System subheading 0712.20. End uses include soups, sauces, snack seasonings, processed meat, ready meals, instant noodles and retail spice jars. Oil-fried onion is a separate product, covered in Credence Research's fried onion market study.
Onion powder market overview and global demand
No Credence Research report sizes onion powder alone, so this overview uses adjacent markets and physical trade data. Credence Research values the global seasoning market at about USD 46.9 billion in 2025, based on its USD 44.7 billion for 2024 and a 4.9% CAGR. Its dehydrated food study puts that much broader category at USD 47.5 billion in 2023, with a 7% CAGR. Dehydrated onion is a small slice of both.
Fresh onion supply is abundant worldwide. Turkey's agriculture ministry research institute reports world dry onion output of about 111 million tonnes in 2023, with India and China holding 49.4%. Only a small share goes to dehydration, since most bulbs are too watery. IFC said in 2020 that 5,000 tonnes a year equals about 2% of global supply, which implies roughly 250,000 tonnes of dried onion.
Trade statistics for HS 0712.20 show India as the top exporter, with USD 167.4 million and 36% of world export value in 2023, implying world trade near USD 465 million. Egypt shipped 19,474 tonnes worth USD 66.2 million in 2024, led by Germany, the Netherlands and Japan. Its average value of about USD 3.40 per kg sits well above commodity Indian powder offers. China and the U.S. are also major suppliers, with the U.S. exporting about 27,000–31,000 tonnes a year and importing 6,000–9,000 tonnes, according to a 2023 EastFruit report.
Demand follows packaged food output. Seasoning blenders and meal makers buy on specification and audited safety, which favors plants able to prove traceability. That matters more than headline growth for a new entrant.
Onion powder manufacturing process
The process is simple on paper, but it removes a great deal of water from a fragile flavor. Dehydration varieties are harvested at high solids and reach the plant quickly, because bulbs lose quality in field storage.
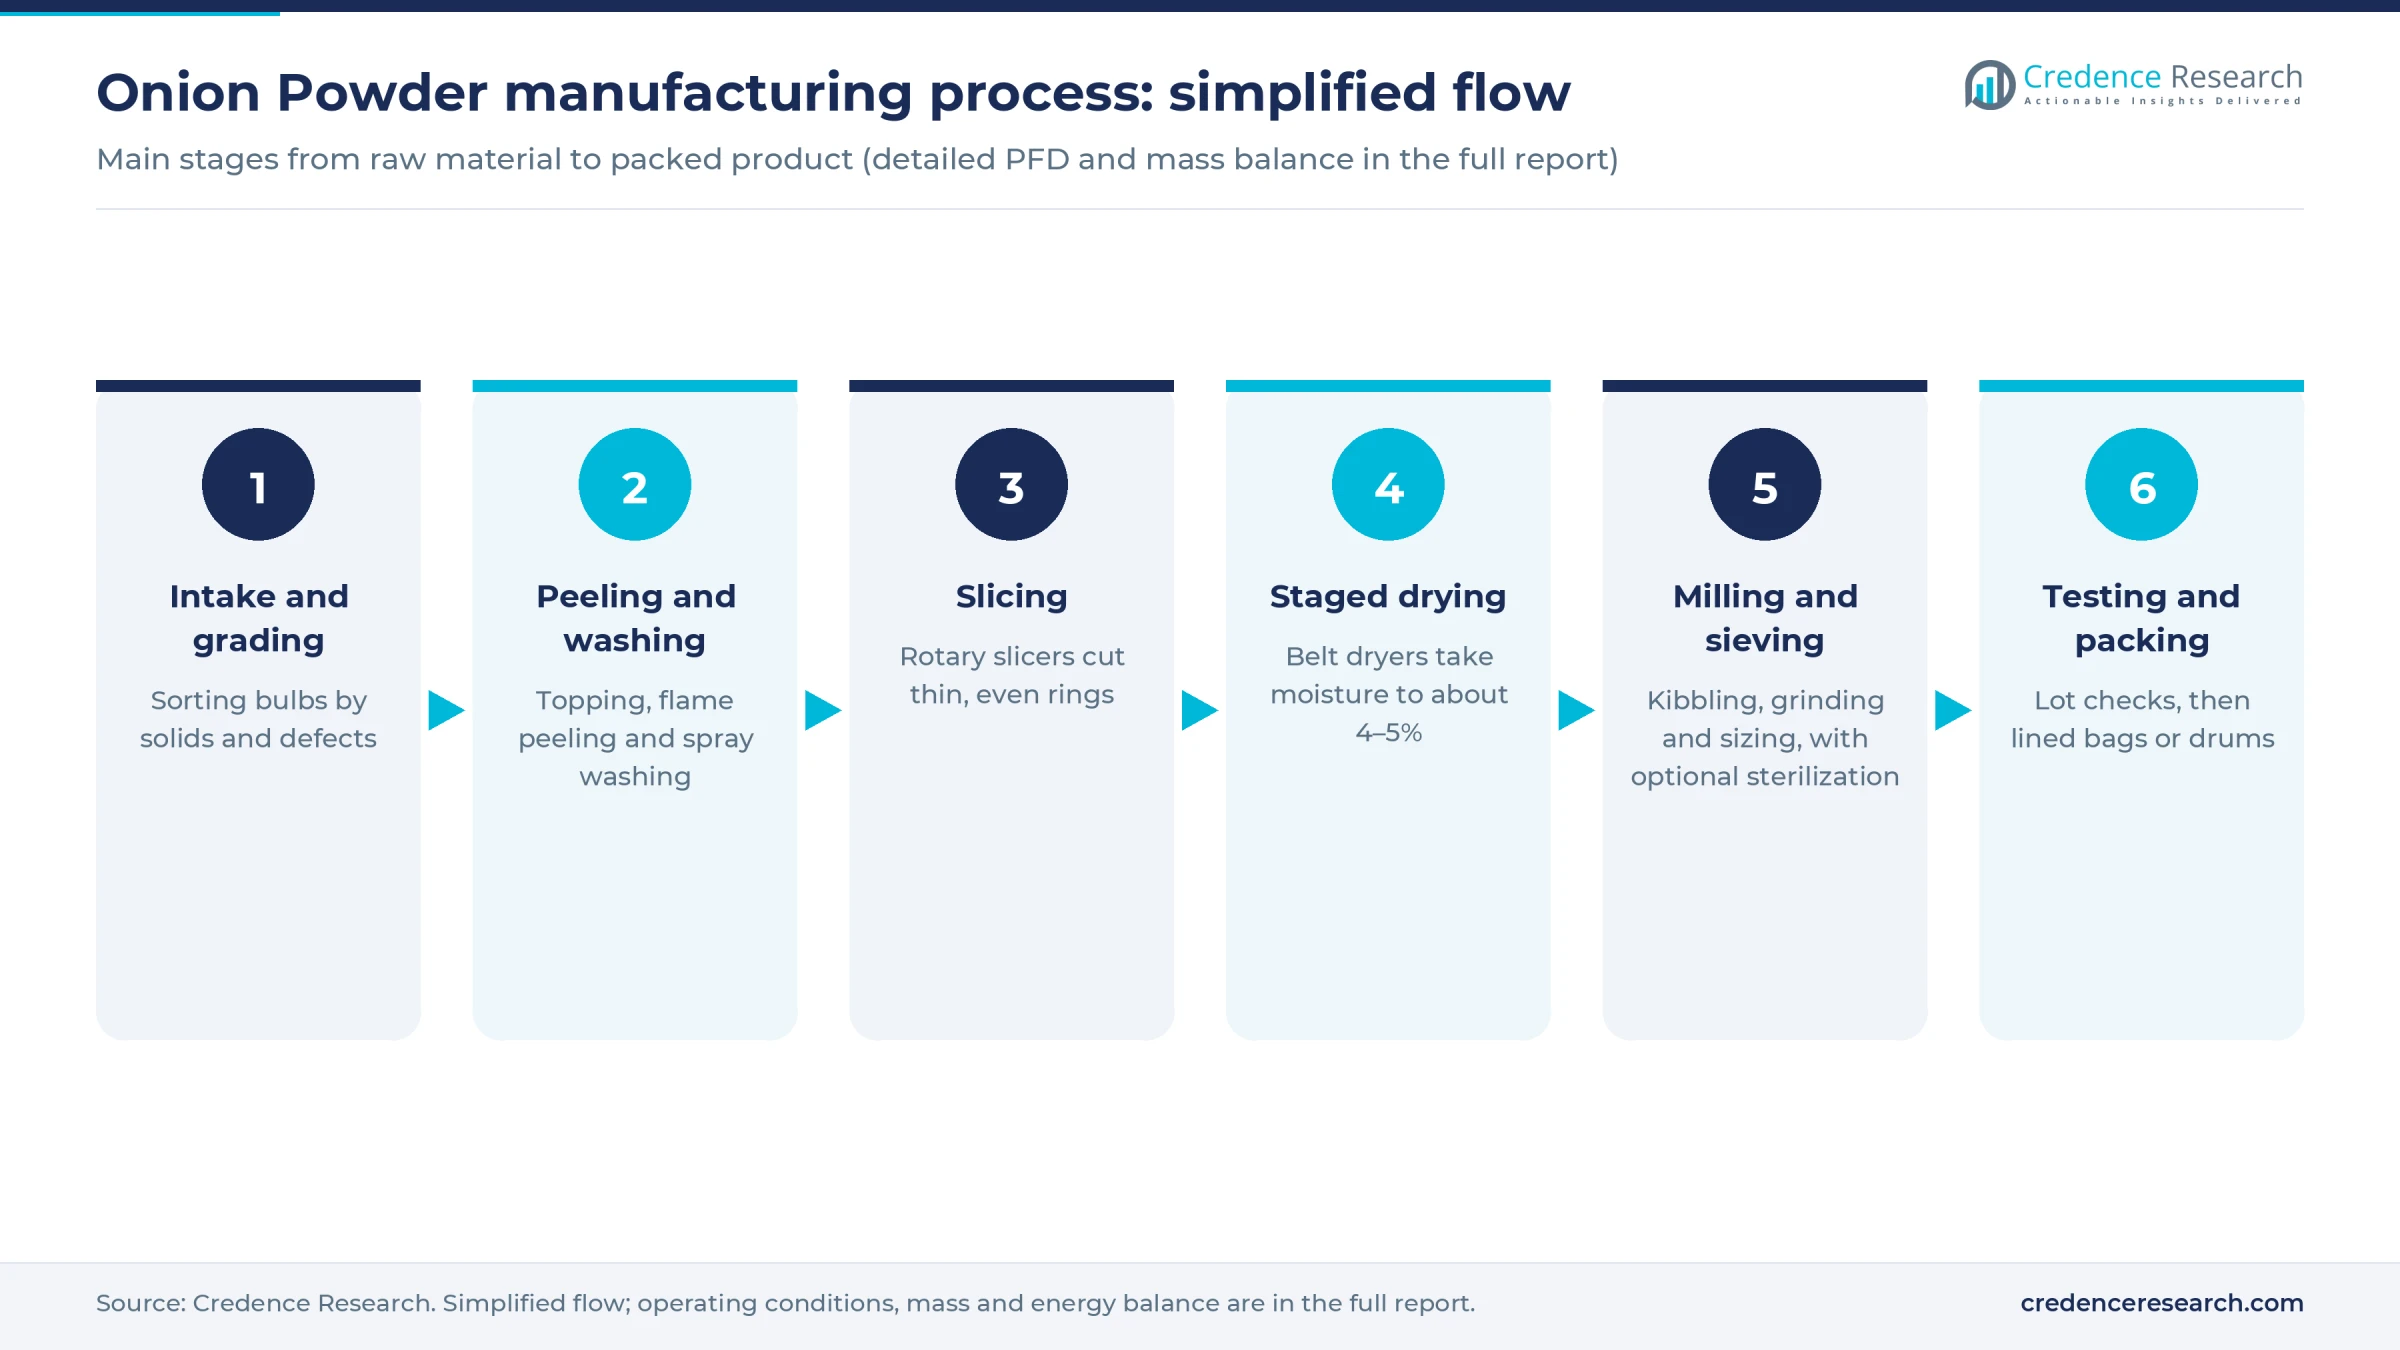
- Intake and grading. Bulbs are sampled for solids and defects, then sorted. Sprouted or rotten bulbs are removed, since they spoil flavor and raise microbial counts.
- Topping, peeling and washing. Machines trim necks and roots, flame or abrasive peelers remove skins and spray washers clean the bulbs. Skins leave as solid waste.
- Slicing. Rotary slicers cut bulbs into thin rings. Blanching is generally avoided, as heat at this stage would reduce pungency.
- Staged drying. A published technical paper describes a four-stage belt system that takes moisture from about 83% to 4%, with air near 104°C at first, then about 49°C at the finish. Early stages run hot while evaporation keeps slices cool, and later stages run cooler to protect color and flavor.
- Milling and sieving. Dried pieces are kibbled, granulated or ground, then sized. Some grades pass through steam sterilization to meet buyers' microbial limits.
- Testing and packing. Lots pass moisture, color, microbial and metal checks, then go into lined bags or drums. Powder absorbs moisture readily, so low-humidity rooms are important.
Yield is the main variable in the economics. Published ratios run from about 6 kg of fresh onions per kg of product at high-solids U.S. lines to about 7 kg at SODELEG in France and about 12 kg for strips in a 2013 Niger farm note, close to the ratio implied by reported figures for Senegal. This overview models 8–10 kg. Drying energy comes next, with the same paper citing about 35–46 MJ of heat and 14 MJ of electricity per kg of dry product. Newer dryers may use less, so those figures serve only as a guide.
Onion powder plant setup cost
This overview models a greenfield plant making 4,000 tonnes of powder, granules and kibbled onion a year, about 16 tonnes a day, at an estimated total CapEx of USD 6–20 million. Disclosed benchmarks vary widely, so each was scaled with a 0.7 power rule and escalated to 2026 prices.
The low end starts from a small Kazakh project of 600 tonnes a year, listed at about 202.5 million tenge in 2015, or about USD 0.9 million at an assumed 220 tenge per USD. Scaled up, that gives about USD 5 million, though the project later stopped operating and is only a weak guide. The upper end draws on two sources. Olam paid USD 30.8 million in 2012 for an Egyptian processor with 8,500 tonnes of onion and 2,300 tonnes of herb capacity. Excluding about USD 3.5 million of working capital, that scales to about USD 19 million. IFC listed a project cost of EUR 18 million for Senegal's SAF Ingredients, which scales to USD 16–18 million after an assumed allowance for its 760-hectare farm.
SAF also shows how far reported costs can move. Food Business MEA reported USD 35.4 million in 2025 for 4,000 tonnes, far above the modeled range, though its scope is undisclosed.
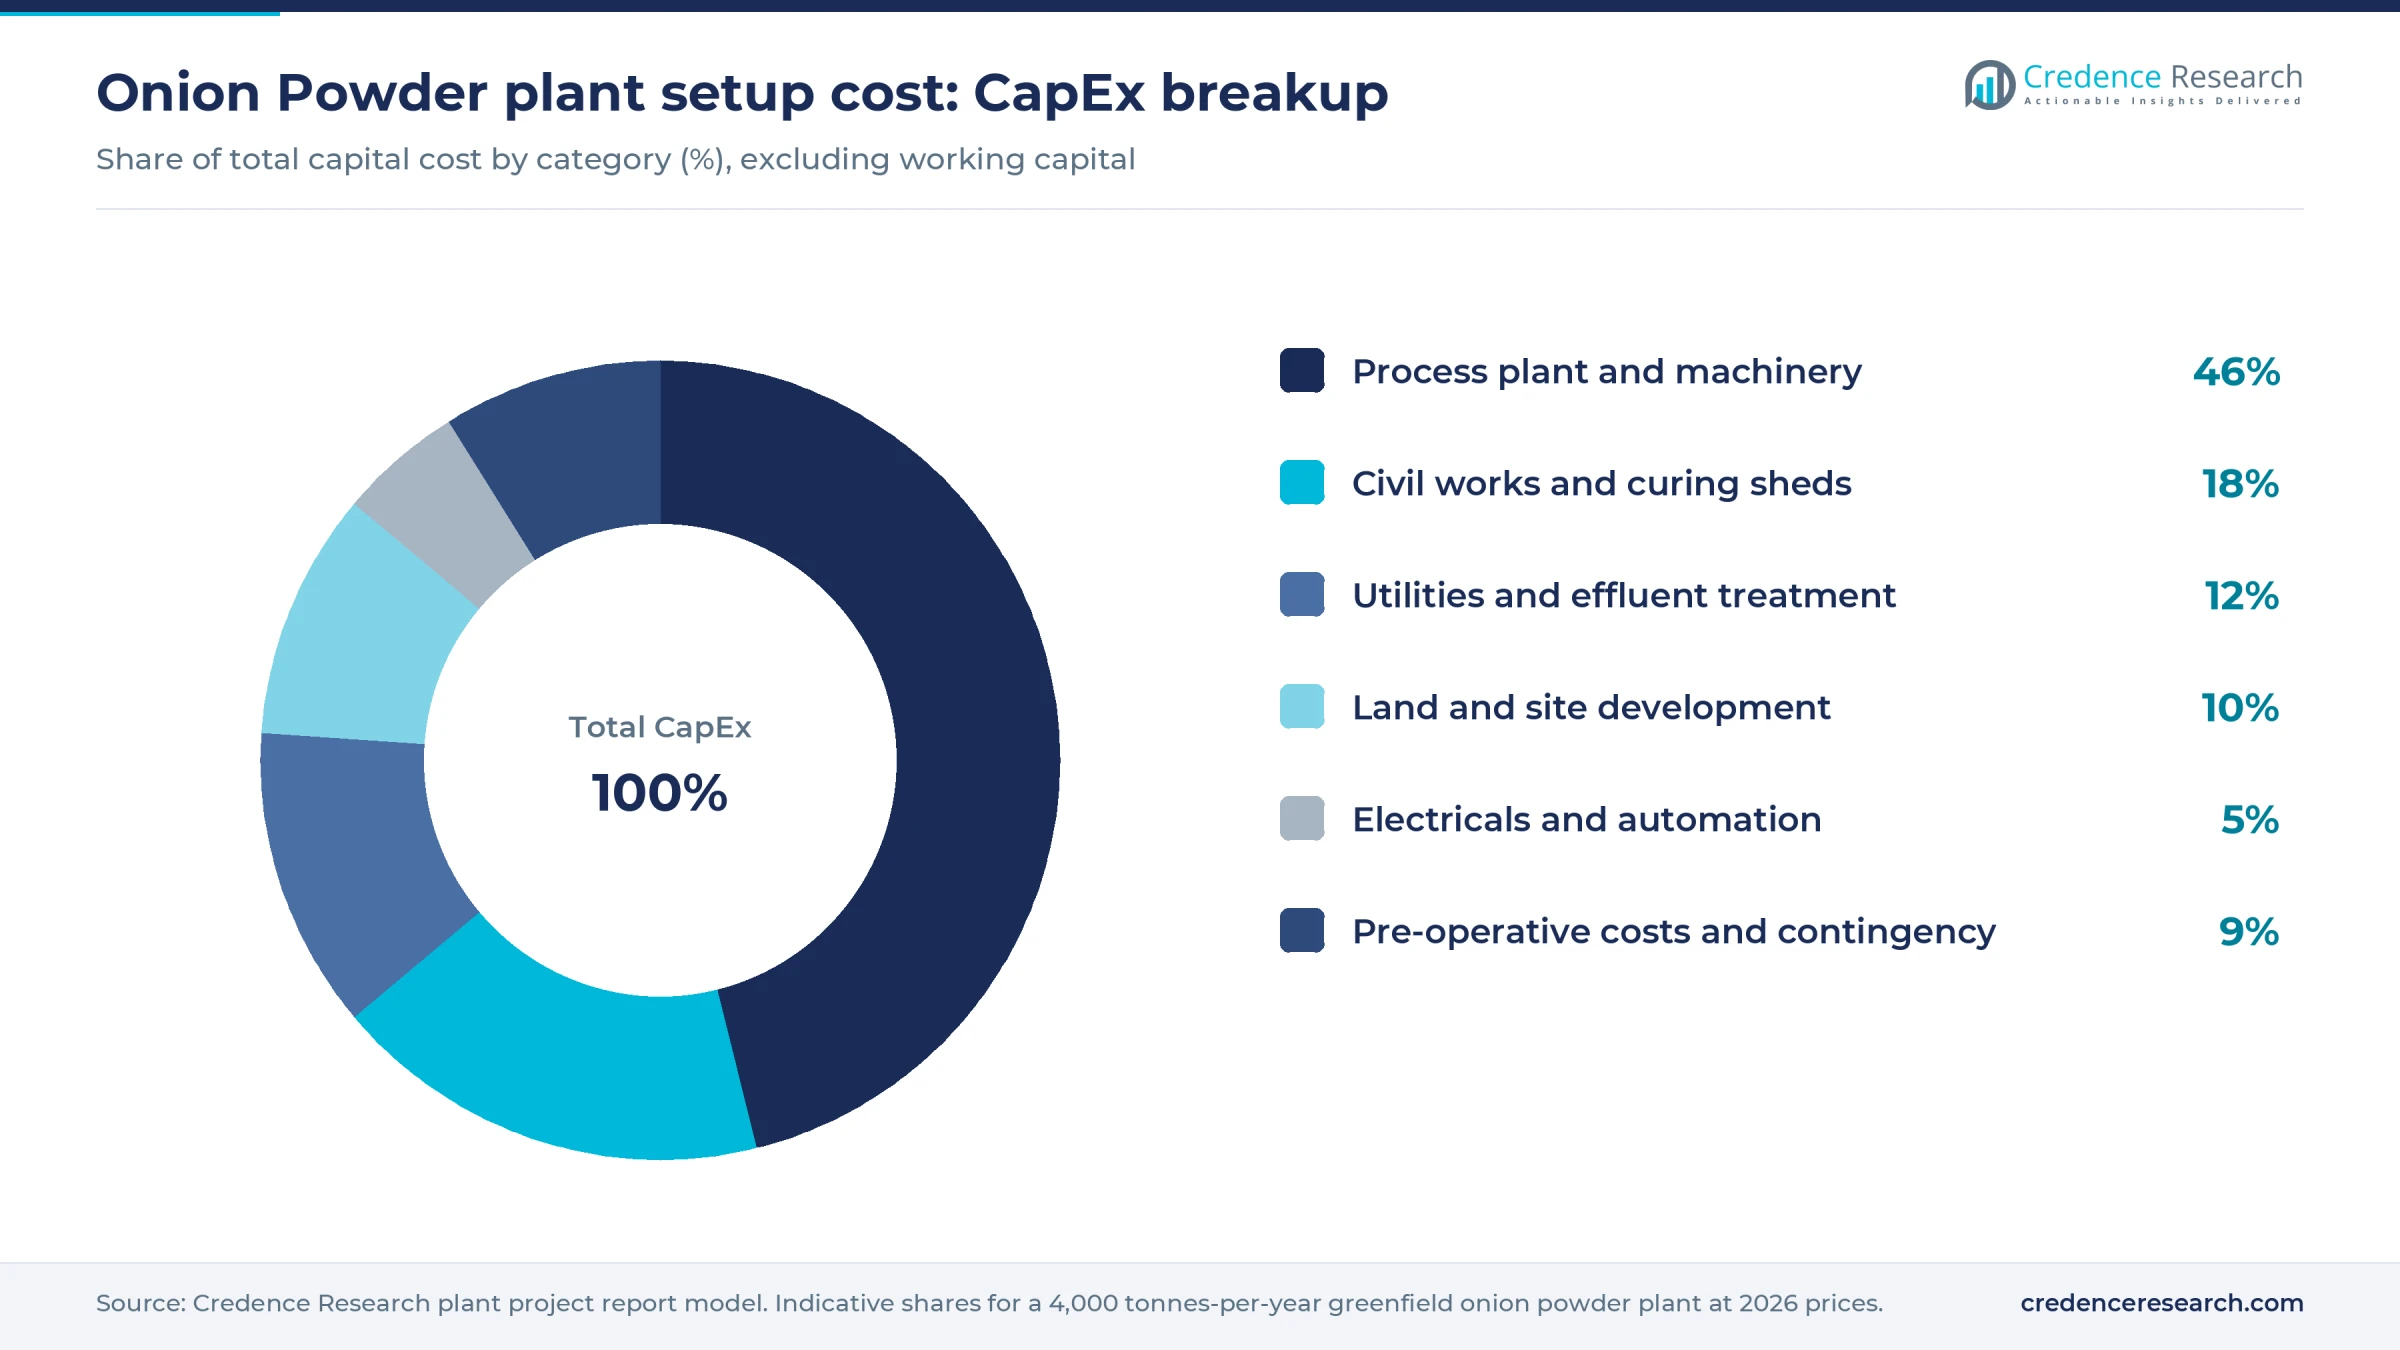
Worked example, land and site development. The plant needs an assumed 20,000–35,000 square meters, including onion curing sheds and effluent treatment. At an assumed USD 20–50 per square meter in an Asian industrial park, the plot costs about USD 0.4–1.8 million. At an assumed USD 30–80 at a U.S. or EU site, it costs about USD 0.6–2.8 million. Site works add an assumed USD 0.1–0.4 million, so this row usually runs 8–15% of CapEx.
Working capital adds an estimated USD 2–3.5 million, because harvests are seasonal and finished stock must carry sales between campaigns.
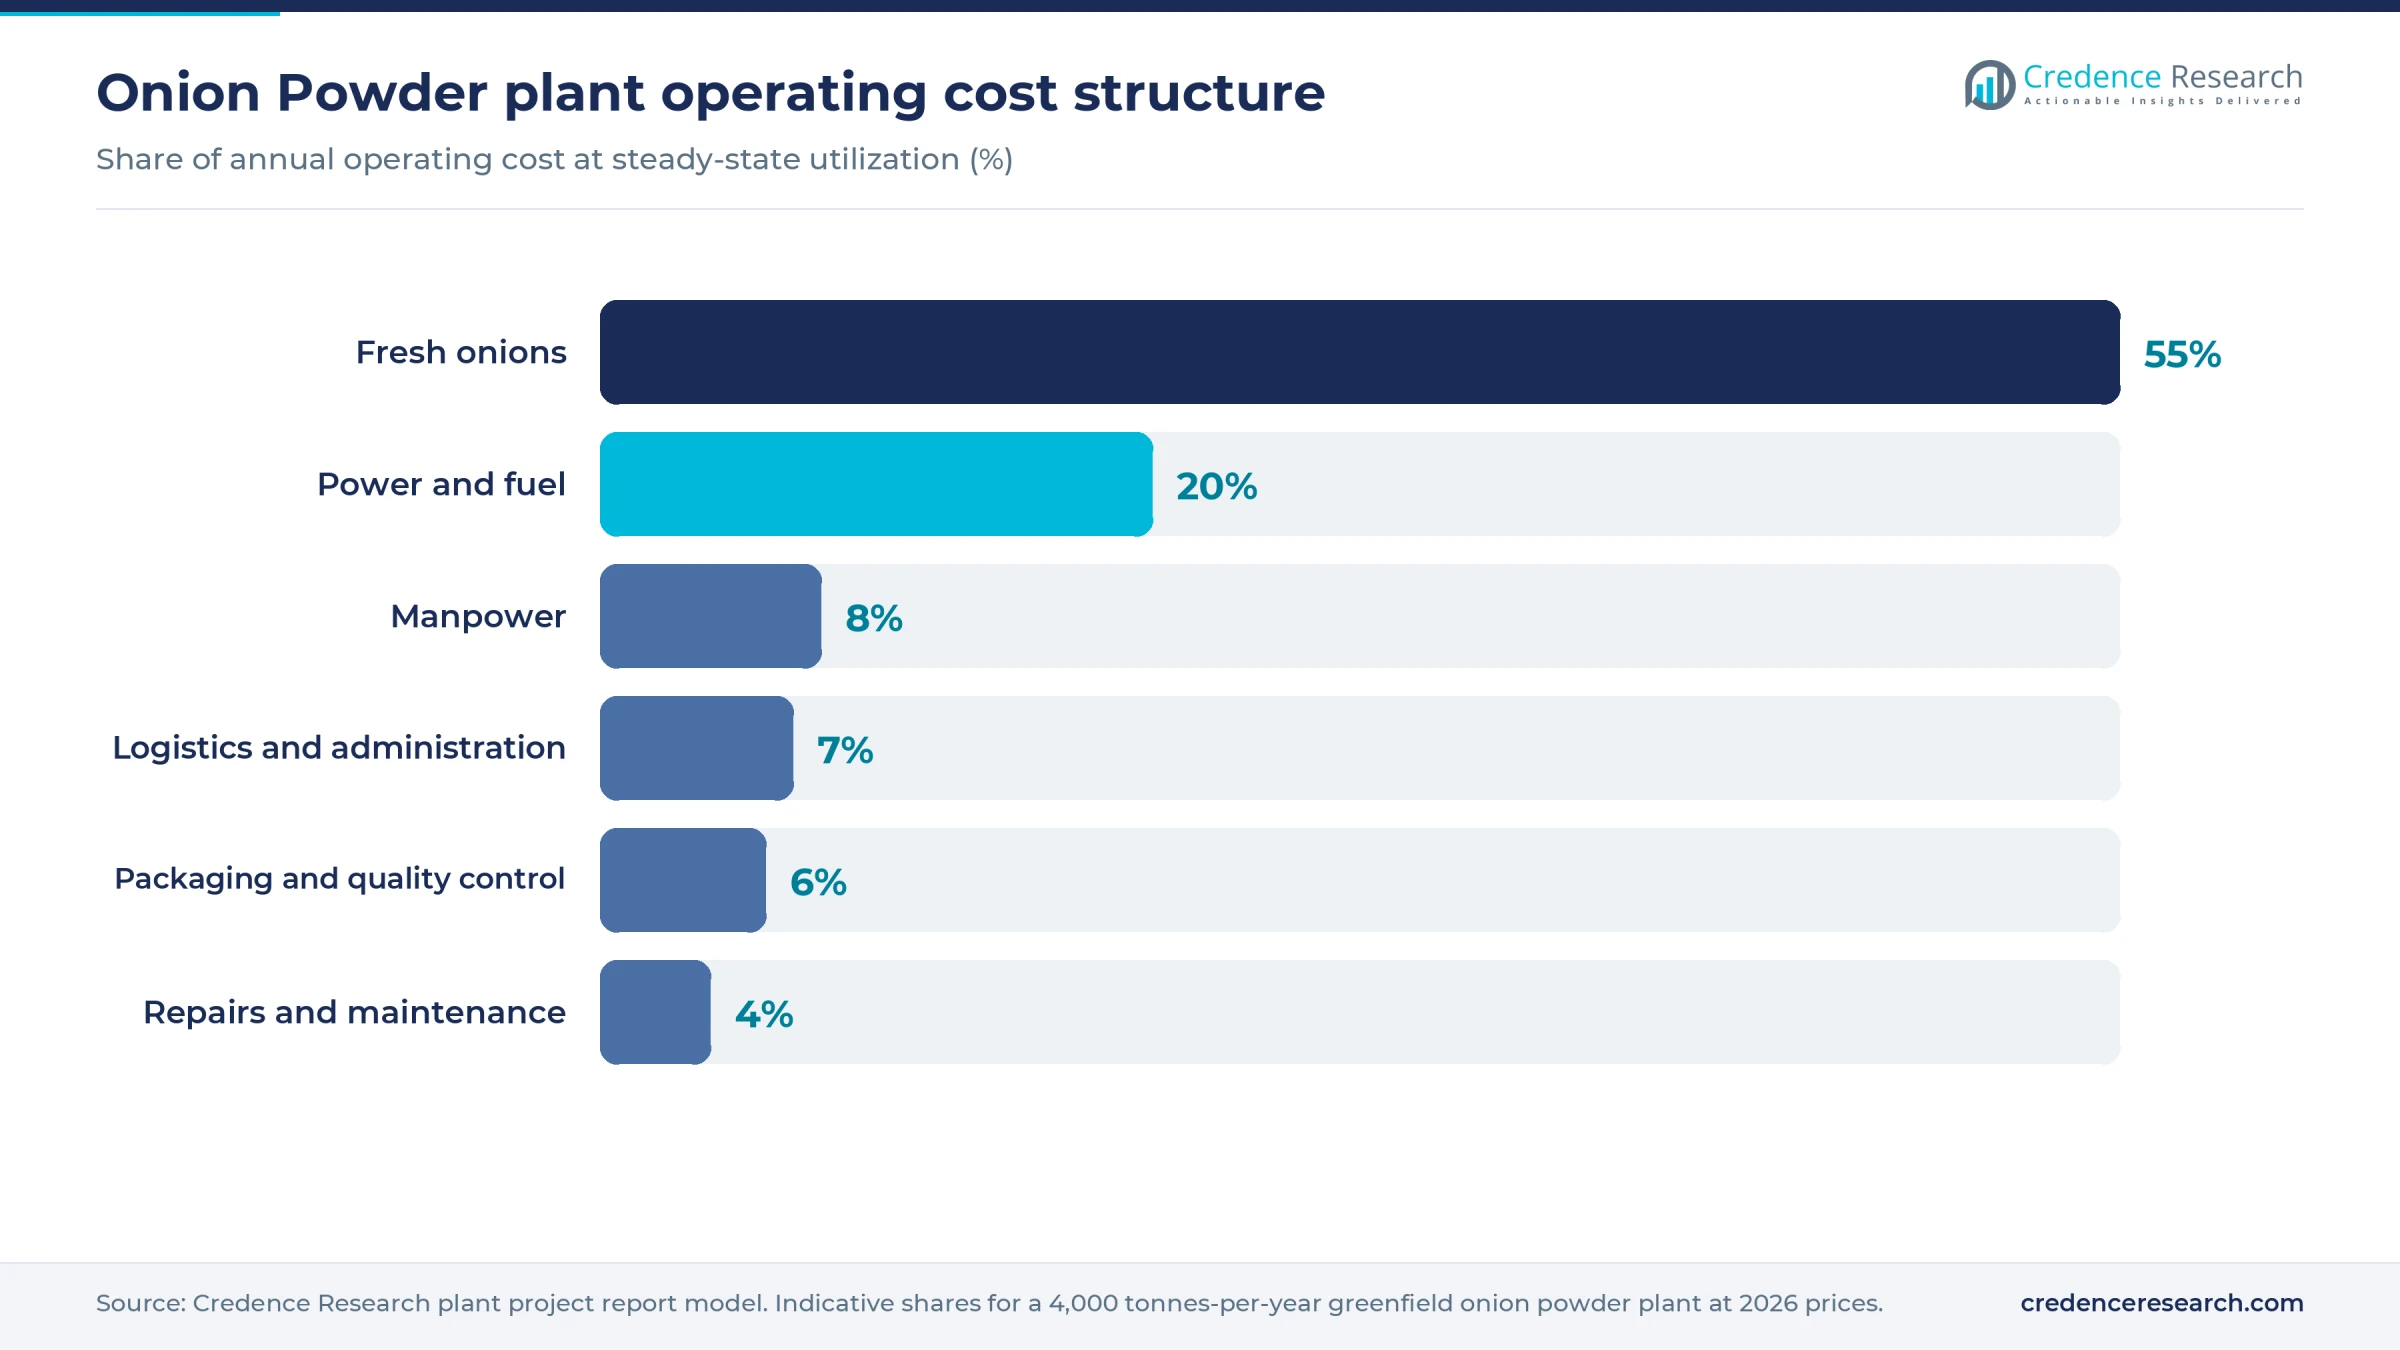
Onions take the largest share of operating cost, while energy ranks second and matters more here than in most food plants.
Machinery and raw materials for an onion powder plant
The main machinery groups are listed below; capacities, specifications and quotations are available in the report.
- Intake: bulb hoppers, curing sheds, conveyors, graders and sorting tables
- Preparation: toppers, flame or abrasive peelers, spray washers and rotary slicers
- Drying: multi-stage belt dryers, bin finishers, air dehumidifiers and heat recovery
- Finishing: kibblers, hammer or pin mills, sifters, steam sterilizers, metal detectors and bagging lines
- Quality: moisture analyzers, pyruvate or pungency tests, colorimeters and a microbiology lab
- Utilities: gas or biomass heaters, power backup, effluent treatment and dust collection
Fresh onions are the core input, and supply must sit close to the plant. Gujarat leads Indian dehydration, with about 120 plants reported around Mahuva, while Egypt draws on the Nile Valley. California supplies much of the U.S. contract crop, and China remains a major origin. Northern France and northern Senegal show that contract farming can support plants outside those centers.
Most serious processors contract seed and growers, because table onions rarely reach the solids needed. Olam SVI told FreshPlaza in 2016 that its dehydration onions exceed 25% dry matter. Plants also buy packaging, process water and heating fuel. Skins and trimmings need an outlet, such as compost or feed, or they become a disposal cost.
Onion powder business profit margin and ROI
For the modeled plant, gross margin after onions and direct conversion costs is estimated at 12–28%, at an assumed blended price of USD 2.2–3.2 per kg. Payback runs 4–12 years after commissioning, with the shorter end needing a low-cost build and firm pricing. The modeled unit cost is about USD 1.6–2.5 per kg, including onions at an assumed USD 0.10–0.16 per kg.
India Seatrade News reported Gujarat exports at about USD 2,400–2,500 per tonne in 2024, and Egypt averaged about USD 3.40 per kg that year. Yet recent trade listings put Indian white and Grade B powder at about EUR 1.12–1.60 per kg FOB in July 2026, and other quotes run about USD 1.50–2.00. At those prices, plain bulk powder may not cover modeled costs, so the plant needs specification grades, organic lines or low-cost local onions.
Revenue of about USD 7–10 million on 3,200 tonnes supports gross profit of about USD 0.8–2.9 million, before assumed overheads of USD 0.3–0.6 million. Onion cost is the sharpest swing factor: a USD 0.02 per kg rise that cannot be passed through cuts gross margin by about 7 percentage points. Heat recovery and a low-cost fuel are the next lever. The modeled onion cost is an assumption for contract-grade dehydration onions, not a sourced price. India paid about USD 0.19 per kg for buffer table onions in June 2026, and that rate at 9 kg per kg of product would cost about USD 1.70, pushing margin below the modeled range at most assumed prices.
| Metric | Value |
|---|---|
| Project IRR (post-tax) | Available in report |
| NPV | Available in report |
| Return on investment | Available in report |
| DSCR | Available in report |
| Break-even utilization | Available in report |
How to start an onion powder business, licenses and approvals
An onion powder plant needs approvals in six areas wherever it is built. These are business and tax registration; land use, zoning and building permits; an environmental permit covering wash water, skins, dryer stacks and odor; occupational safety approvals, including combustible dust controls in milling; food facility registration with a documented safety plan; and customs registration for export. Food customers also commonly ask for FSSC 22000 or BRCGS certification, plus kosher, halal or organic certificates.
| Market | Food and product | Environment and safety |
|---|---|---|
| United States | FDA food facility registration and preventive controls under 21 CFR 117; importers must meet FDA's Foreign Supplier Verification Program | State air permit; NPDES or local pretreatment permit; OSHA rules, including combustible dust enforcement |
| European Union | Food business registration under Regulation (EC) No 852/2004; traceability under Regulation (EC) No 178/2002; pesticide limits under Regulation (EC) No 396/2005 | National environmental permit, with this plant's finished output below the Industrial Emissions Directive's 300-tonne daily threshold for vegetable materials; ATEX rules for explosive dust |
| India | FSSAI central license, which applies to exporters; importer-exporter code and APEDA registration for processed vegetable exports | State pollution control board consents to establish and operate; factory license and boiler registration |
Buyers often test each lot for Salmonella and residues on arrival, so a plant should validate its sterilization and supplier controls before the first export shipment.
Key onion powder manufacturers and recent developments
Sensient Technologies and ofi, part of Olam, are major U.S. suppliers, and Olam bought Egypt's Dehydro Foods in 2012. SODELEG operates a large plant in northern France. India's field includes Jain Farm Fresh Foods, Pardes Dehydration and Chhatariya Foods, while Qingdao Wanlin Food processes onions in China. SAF Ingredients, inaugurated in Senegal in June 2025, is a newer African entrant.
- February 2026. Sensient's annual filing said it believes it is the second-largest U.S. producer of dehydrated onion and garlic by sales. It said heavy rain and flooding delayed 2025 harvests and caused crop losses, and that its renamed Agricultural Ingredients unit incurred extra costs from equipment inefficiencies.
- June 2026. India lifted the price paid for onions for its 200,000-tonne buffer stock target in steps, from 12.70 rupees per kg to 17.30 by June 20, about USD 0.19 at an assumed 90 rupees per dollar, raising the reference for raw onion costs.
- August 2026. India began a targeted release of buffer onions to check seasonal price rises.
What's inside the Onion Powder project report PDF
The report runs to 21 chapters. Open a chapter to see its sections.
1. Preface
2. Scope and Methodology
- 2.1 Objectives of the Study
- 2.2 Stakeholders
- 2.3 Research Methodology
- 2.4 Data Sources and Key Assumptions
3. Executive Summary
- 3.1 Market Snapshot
- 3.2 Project at a Glance (Capacity, CapEx, OpEx)
- 3.3 Key Financial Indicators (IRR, NPV, Payback, Break-even)
- 3.4 Feasibility Verdict
4. Product Overview
- 4.1 Onion Powder Definition and Properties
- 4.2 Grades and Specifications (BIS / ISO / ASTM)
- 4.3 HS Code and Classification
- 4.4 Key Applications
- 4.5 Substitutes
5. Global Onion Powder Market
- 5.1 Market Overview
- 5.2 Historical and Current Market Performance (Volume and Value)
- 5.3 Market Breakup by Grade / Type
- 5.4 Market Breakup by End-Use Industry
- 5.5 Market Breakup by Region
- 5.6 Market Drivers, Restraints and Trends
- 5.7 Value Chain Analysis
- 5.8 Market Forecast
6. Target Country Onion Powder Market Analysis
- 6.1 Demand and Supply Analysis
- 6.2 Installed Capacity vs Demand Gap
- 6.3 Import Dependence
- 6.4 Demand Forecast by End-Use
7. Trade Analysis
- 7.1 Imports by Volume, Value and Country
- 7.2 Exports by Volume, Value and Country
- 7.3 Trade Balance and Opportunities
8. Price Analysis
- 8.1 Historical Onion Powder Price Trends by Region
- 8.2 Raw Material / Feedstock Price Trends and Linkage
- 8.3 Price Forecast
- 8.4 Margins Across the Value Chain
9. Competitive Landscape
- 9.1 Market Structure
- 9.2 Key Players and Installed Capacities
- 9.3 Profiles of Key Players
- 9.4 Recent Developments (Expansions, M&A, New Plants)
10. Manufacturing Process and Technology
- 10.1 Comparison of Technology Routes
- 10.2 Selected Route and Process Flow Diagram
- 10.3 Unit Operations Involved
- 10.4 Chemical Reactions Involved
- 10.5 Mass Balance and Raw Material Requirements
- 10.6 Energy Balance
- 10.7 Quality Assurance Criteria and Technical Tests
- 10.8 By-products and Waste Handling
- 10.9 Technology Licensors / Providers
11. Project Details, Requirements and Costs
- 11.1 Land, Location and Site Development
- 11.1.1 Site Selection Criteria
- 11.1.2 Location Analysis
- 11.1.3 Land Requirement and Costs
- 11.1.4 Site Development Costs
- 11.2 Plant Layout
- 11.2.1 Layout Principles
- 11.2.2 Proposed Layout
- 11.2.3 Factors Influencing Layout
- 11.3 Civil Works and Buildings
- 11.4 Plant Machinery
- 11.4.1 Machinery Requirements and Specifications
- 11.4.2 Machinery Costs
- 11.4.3 Machinery Suppliers
- 11.5 Raw Materials
- 11.5.1 Requirements per Tonne of Output
- 11.5.2 Procurement and Sourcing
- 11.5.3 Costs
- 11.5.4 Suppliers
- 11.6 Packaging
- 11.6.1 Packaging Requirements
- 11.6.2 Packaging Costs
- 11.6.3 Packaging Suppliers
- 11.7 Storage and Material Handling
- 11.8 Transportation Requirements and Costs
- 11.9 Utilities
- 11.9.1 Power Requirements and Costs
- 11.9.2 Water Requirements and Costs
- 11.9.3 Steam, Fuel and Other Utilities
- 11.10 Manpower Requirements and Wages
12. Environment, Health, Safety and Sustainability
- 12.1 Effluent and Emissions Management
- 12.2 Hazard Classification and Safety Measures
- 12.3 Carbon Footprint
- 12.4 Green / Low-Carbon Process Options
13. Regulatory Procedures, Approvals and Certifications
- 13.1 Licences and Registrations
- 13.2 Environmental Clearances
- 13.3 Product Certifications (BIS, REACH, etc.)
- 13.4 Approval Timeline
14. Project Implementation Schedule
15. Project Economics
- 15.1 Capital Cost of the Project
- 15.2 Techno-Economic Parameters
- 15.3 Capacity Utilization and Ramp-up
- 15.4 Product Pricing and Margins
- 15.5 Income Projections
- 15.6 Expenditure Projections
- 15.7 Working Capital Requirement
- 15.8 Taxation
- 15.9 Depreciation
16. Financial Analysis
- 16.1 Projected Profit and Loss Account
- 16.2 Projected Cash Flow Statement
- 16.3 Projected Balance Sheet
- 16.4 Liquidity Analysis
- 16.5 Profitability Analysis (Payback, NPV, IRR, ROI)
- 16.6 Break-even Analysis
- 16.7 Debt Service Coverage Ratio (DSCR)
- 16.8 Sensitivity Analysis
- 16.9 Scenario and Uncertainty Analysis
17. Funding and Incentives
- 17.1 Means of Finance and Debt-Equity Structure
- 17.2 Loans and Financial Assistance
- 17.3 Government Schemes and Subsidies (PLI, State Policies)
18. Risk Assessment
- 18.1 Key Success Factors
- 18.2 Key Risk Factors
- 18.3 Risk Mitigation
19. Strategic Recommendations
20. Case Study of a Successful Venture
21. Appendix
- 21.1 Detailed Assumptions
- 21.2 Abbreviations
- 21.3 List of Tables and Figures
- 21.4 Sources
This page vs. the full report
| Data point | On this page (free) | In the full report |
|---|---|---|
| Total CapEx | One rounded range at one capacity | Exact figure at three capacities with a line-item breakup |
| CapEx breakup | Category shares (%) only | Cost, quantity and supplier for every machine |
| Operating cost | Share of raw materials, utilities and labor | Per-unit cost sheet with each input price and consumption |
| Profitability | Gross margin range and payback band | Exact IRR, NPV, ROI, break-even and DSCR |
| Financial statements | List of what is included | 10-year P&L, cash flow, balance sheet and Excel model |
| Sensitivity | One directional line | Full sensitivity and scenario tables |
| Process | Simplified flow diagram | Detailed process flow, mass and energy balance, operating conditions |
| Machinery | Names of the main machines | Specifications, capacity, cost and supplier list |
| Market | Headline size, growth and India demand trend | Segment, region, trade and price forecast tables |
| Suppliers and buyers | Supplier types and sourcing hubs | Named suppliers and buyers |
Onion Powder project report: FAQs
How much does it cost to set up an onion powder plant?
How many onions are needed to make 1 kg of onion powder?
What profit margin can an onion powder plant earn?
Why do ordinary table onions make poor raw material?
Which licenses does an onion powder plant need?
Where should an onion powder plant be located?
Who buys onion powder?

About the analyst
Priyanka Mor, Senior Consultant
Senior Consultant at Credence Research Inc directing strategic market advisory, cross-border commercial due diligence and enterprise intelligence frameworks for global B2B clients. Combines quantitative modeling with executive advisory, translating macroeconomic variables and supply chain data into go-to-market blueprints, M&A screenings and competitive war-gaming strategies.
Related market research
- Seasoning Market Size, Growth, Trends, Share and Forecast 2032
- Dehydrated Food Market Size, Growth & Forecast to 2032
- Fried Onion Market Size, Growth, Share and Forecast 2032
- Dehydrated Potato Products Market Size, Share and Growth Report 2032
- Dehydrated Green Bean Market Size, Growth and Forecast Report 2032
- Asia Pacific Seasoning and Spices Market Size, Share, Growth and Forecast, 2025-2035
More plant project reports
- Vinegar Manufacturing Plant Project Report (DPR) 2026
- Tea Processing Plant Project Report (DPR) 2026
- Fruit Juice Processing Plant Project Report (DPR) 2026
- Guar Gum Powder Manufacturing Plant Project Report (DPR) 2026
- Shrimp Processing Plant Project Report (DPR) 2026
- Instant Coffee Manufacturing Plant Project Report (DPR) 2026