
Quick answer
A tea processing plant turns freshly plucked leaf into dry made tea through withering, rolling, oxidation, drying and grading. This overview models a greenfield factory with capacity for 2,500 tonnes of made tea a year, with estimated CapEx of USD 4–9 million, excluding tea fields. Gross margin after leaf and conversion costs is estimated at 12–25%, with payback at 5–11 years, because auction prices and leaf supply decide returns.
Viable for factories with secured leaf from their own estates or committed growers and some orthodox or packaged sales; a standalone bought-leaf CTC factory selling at bulk auction prices faces a slow, price-exposed payback.
Tea plant: key highlights
| Parameter | Indicative value | Note |
|---|---|---|
| Plant capacity | 2,500 tonnes of made tea per year | About 11,900 tonnes of green leaf at full capacity, with flush peaks near 65 tonnes a day |
| Total CapEx | USD 4–9 million | Greenfield factory, excluding tea fields, woodlots and working capital |
| Raw material share of operating cost | 65–80% | About 4.5–5 kg of green leaf per kg of made tea |
| Gross margin | 12–25% | After green leaf and direct conversion costs, at USD 2.4–3 per kg |
| Payback period | 5–11 years | From commissioning, including ramp-up; longer in years of weak auction prices |
| IRR | Available in report | Post-tax, 10-year model |
| Break-even | Available in report | Capacity utilization basis |
Ranges assume a 2,500 tonnes-per-year greenfield factory, 85% average utilization, no tea fields and 2026 prices. Selling price of USD 2.4–3 per kg is assumed from auction and export values; bought green leaf at USD 0.32–0.40 per kg and conversion at USD 0.30–0.45 per kg are assumed. Euro converted at an assumed 1.08 and Kenyan shillings at 129–158 per USD. The full report can be customized to any country or region.
What is tea processing?
Tea processing converts the fresh shoots of Camellia sinensis into a shelf-stable dry product, known in the trade as made tea. Leaf starts to deteriorate soon after plucking, so factories sit close to the fields, and growing and processing are usually a single regional business rather than separate global ones.
How far the leaf oxidizes defines the product. Black tea is fully oxidized and is made either by cut-tear-curl (CTC) machines, which give the strong, fast-brewing grades favored for tea bags, or by the orthodox rolling method, which keeps whole leaf and commands higher prices. Green tea is heated early to stop oxidation, and oolong sits between the two.
Buyers include blenders and packers, auction traders, instant tea and ready-to-drink makers, and retail brands. Made tea falls under Harmonized System heading 0902. Bulk black tea, the largest item for a factory of this kind, is subheading 0902.40, and bulk green tea is 0902.20. Packs of up to 3 kg move to 0902.30 and 0902.10, and instant tea is classified separately under 2101.20.
Tea market overview and global demand
Credence Research values the global tea market at USD 121.35 billion in 2023, with a 5.5% CAGR through 2032. That implies about USD 135 billion in 2025, a figure derived from the 2023 base and growth rate. The value covers finished tea at consumer-facing levels, so it sits far above what factories earn for bulk made tea.
The physical market is much smaller in money terms. FAO's tea market review puts world output at 6.7 million tonnes in 2022, with China at 3.34 million tonnes, India at 1.37 million and Kenya at about 543,000. Consumption reached 6.5 million tonnes, growing 3.3% a year over the prior decade, with China and India together taking about 64%. FAO projects green tea output growing about 6.3% a year to 2032, and black tea output about 1.6%.
Most tea is drunk where it grows, so exports were only 1.84 million tonnes in 2022. UN Comtrade records for 2024 show about USD 7.3 billion and 1.94 million tonnes of reported exports under heading 0902. China, Kenya and Sri Lanka each shipped about USD 1.4 billion, followed by India at USD 0.8 billion. Their unit values explain the industry's main divide: Kenya averaged about USD 2.25 per kg, India USD 3.22, China USD 3.79 and Sri Lanka USD 5.73.
Pakistan, Russia and the U.S. were the largest importers in FAO's review. Prices remain under pressure for now. The Kenya tea Development Agency cited a global slump and lost sales to Iran and Sudan in February 2026, and Sri Lanka's first-half 2026 auction average fell to USD 3.66 per kg from USD 3.89 a year earlier. Oversupply of plain black tea is therefore the central risk, while premium and specialty lines are where buyers still pay more. Readers can compare value-added demand in the ready-to-drink tea study.
Tea manufacturing process
A factory has little time to fix mistakes. Leaf quality at intake sets the ceiling on final price, and each later stage can only protect that quality or lose it. Fine plucking raises the grade, while coarse or bruised leaf sells at a discount.
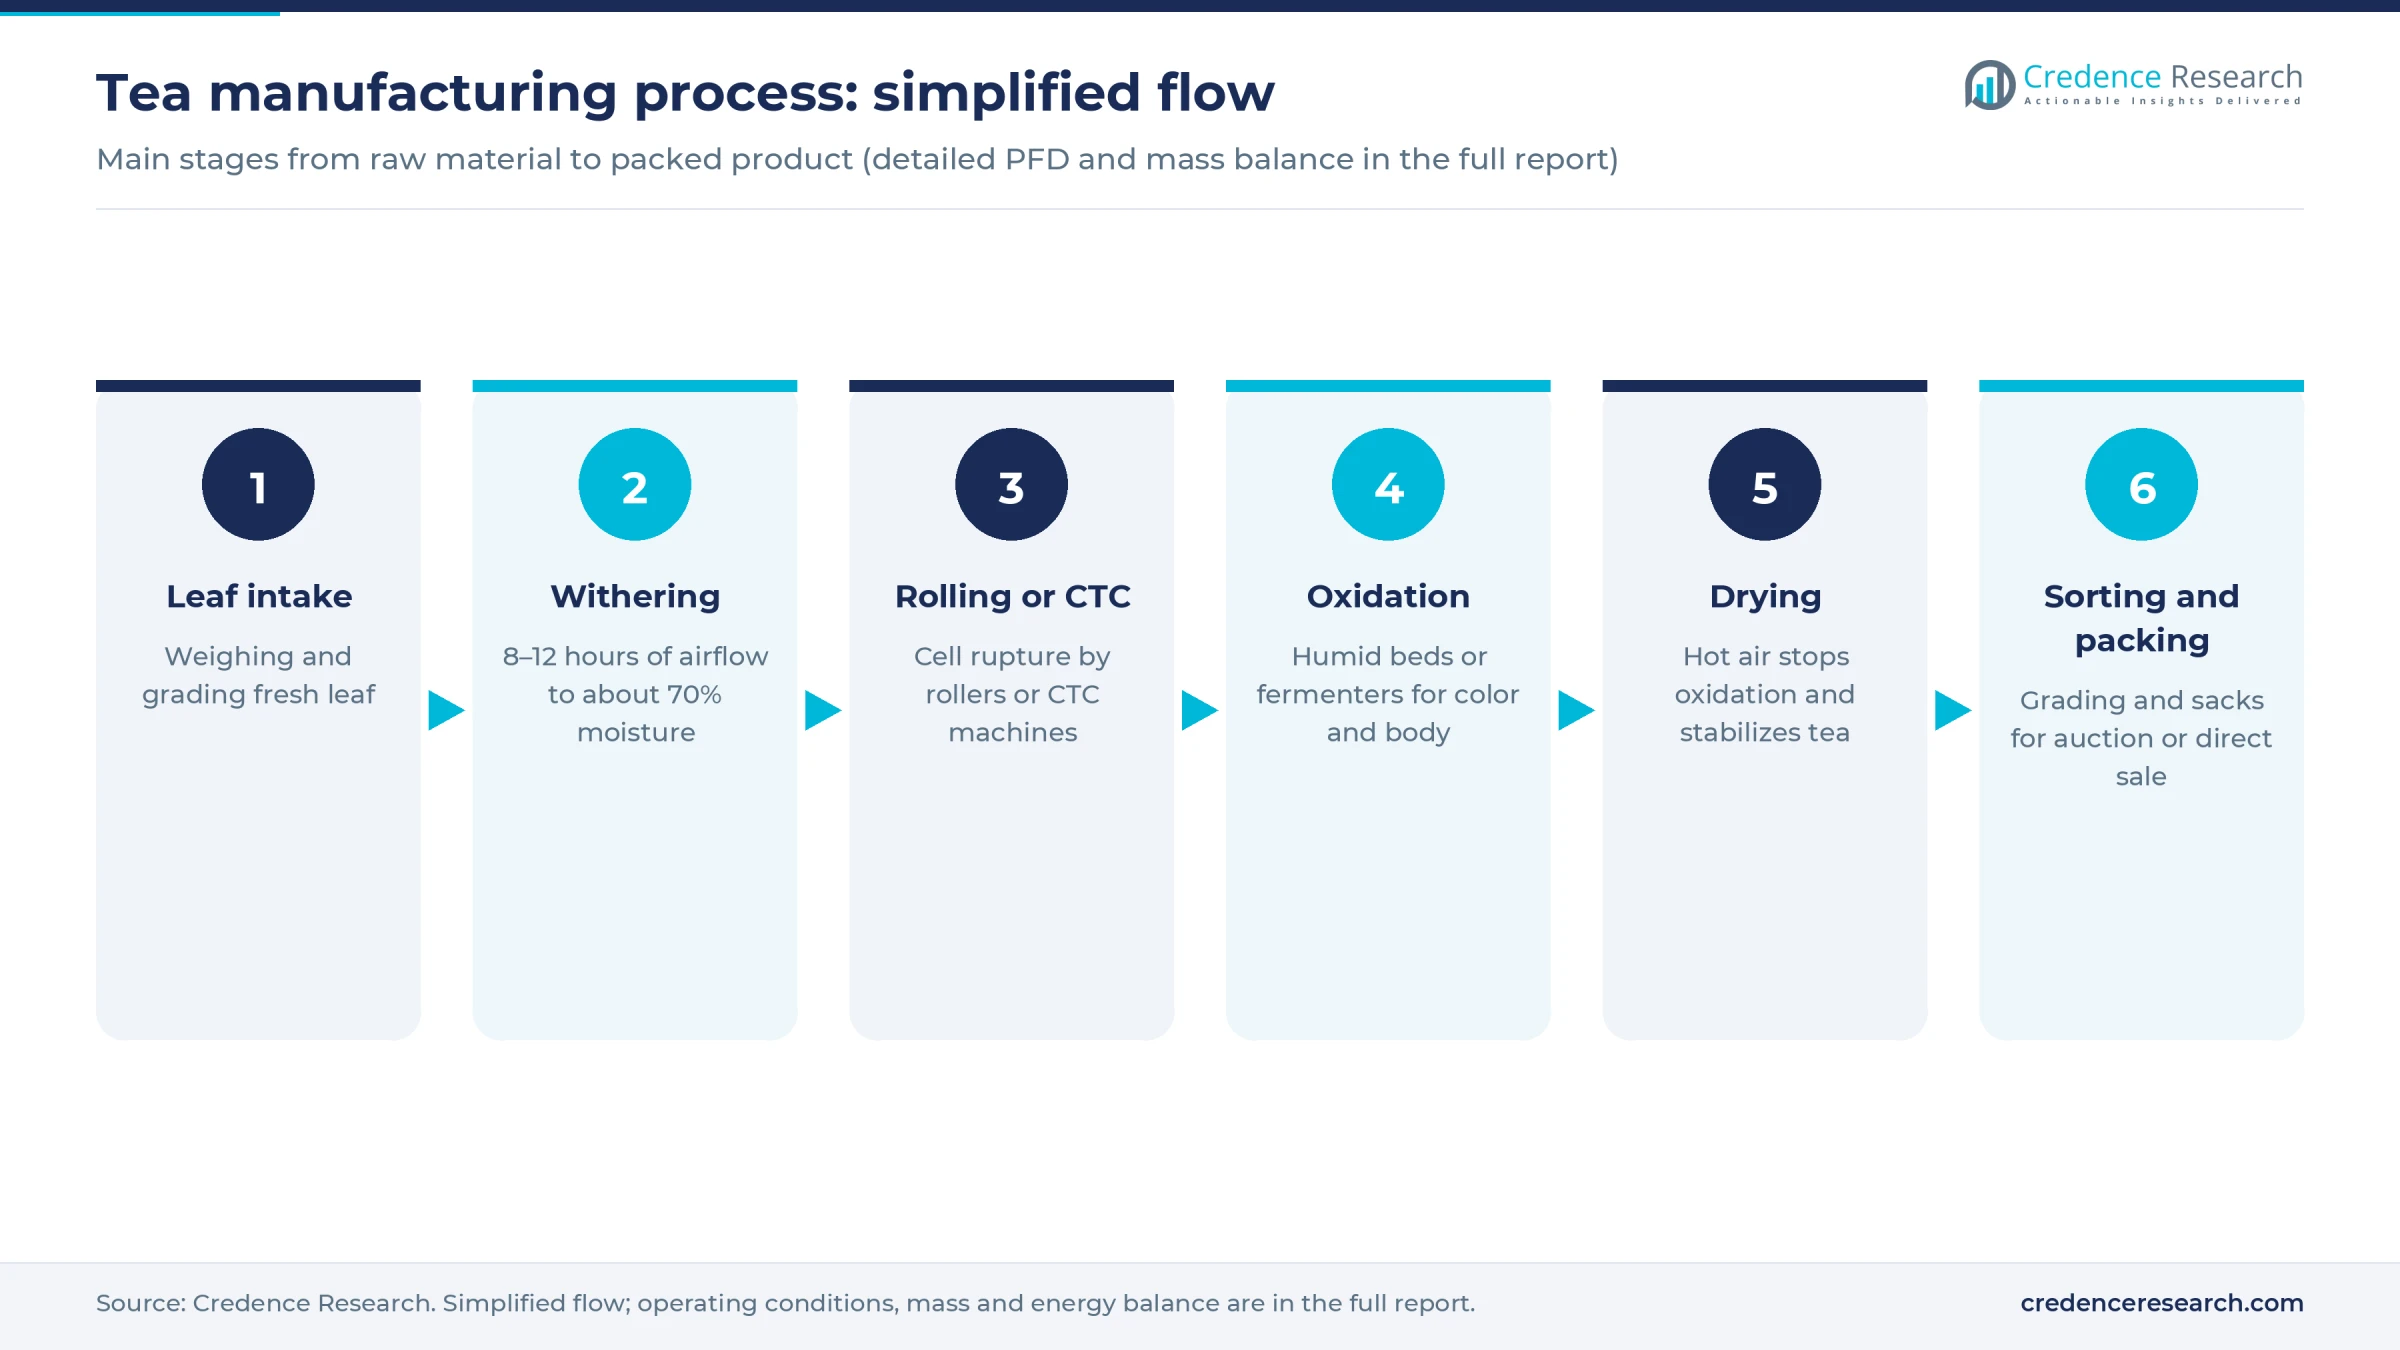
- Leaf intake and weighing. Growers' leaf is received, weighed, graded and moved quickly to the troughs, since heat builds up in packed loads.
- Withering. Leaf rests in troughs for about 8–12 hours while fans blow air through it, removing water until moisture falls to about 70%.
- Rolling or CTC. Orthodox lines twist leaf in rollers. CTC lines pass it through a rotor vane and serrated rollers, which rupture the cells and start oxidation. Green tea is steamed or pan-fired first, which prevents oxidation.
- Oxidation. Often called fermentation in the trade, this stage lets enzymes and oxygen develop color and body on floors, beds or continuous fermenters under humid conditions.
- Drying. Hot air at about 90–110°C in endless chain dryers, or 140–160°C in fluid bed dryers, halts oxidation and brings moisture to low single digits for storage.
- Sorting, grading and packing. Vibrating meshes and fiber extractors split tea into leaf, fannings and dust grades, packed in multi-wall paper sacks for auction or direct sale.
Fuel is the largest conversion cost. An energy audit of an Indian factory recorded 5 kg of green leaf per kg of made tea and total use near 9.5–10 kWh per kg, with about 95% of it thermal. Firewood, coal, gas and biomass are all in use, so a dependable, legal fuel source shapes siting.
Tea processing plant setup cost
This overview models a greenfield CTC factory with some orthodox capacity, rated at 2,500 tonnes of made tea a year, with an estimated CapEx of USD 4–9 million. Tea fields, woodlots and working capital are excluded, because their cost varies with who owns the leaf.
The range rests on disclosed factories, each scaled with a standard capacity exponent. The Kibeho factory in Rwanda was reported at more than EUR 5 million for 150 tonnes of leaf a day, which scales to about USD 3 million at the model's roughly 65-tonne peak. Sorwathe's USD 1.12 million, 300-tonne organic green tea factory, opened in 2018, scales to about USD 6 million in current money. Kenyan projects sit in between, with Kiptere budgeted at 960 million shillings, about USD 6 million, and Madala allocated 700 million shillings, about USD 5.4 million, though neither discloses rated capacity.
The floor of USD 4 million adds site utilities to the lean African builds. The USD 9 million top assumes about a 1.5 times premium on the Kenyan and Sorwathe scale for tighter emission controls, automation and higher-cost construction, a judgment rather than a disclosed figure. Basic cooperative plants can cost far less: a Vietnamese cooperative plans a 900-tonne unit for about USD 535,000, which this overview judges a simpler specification.
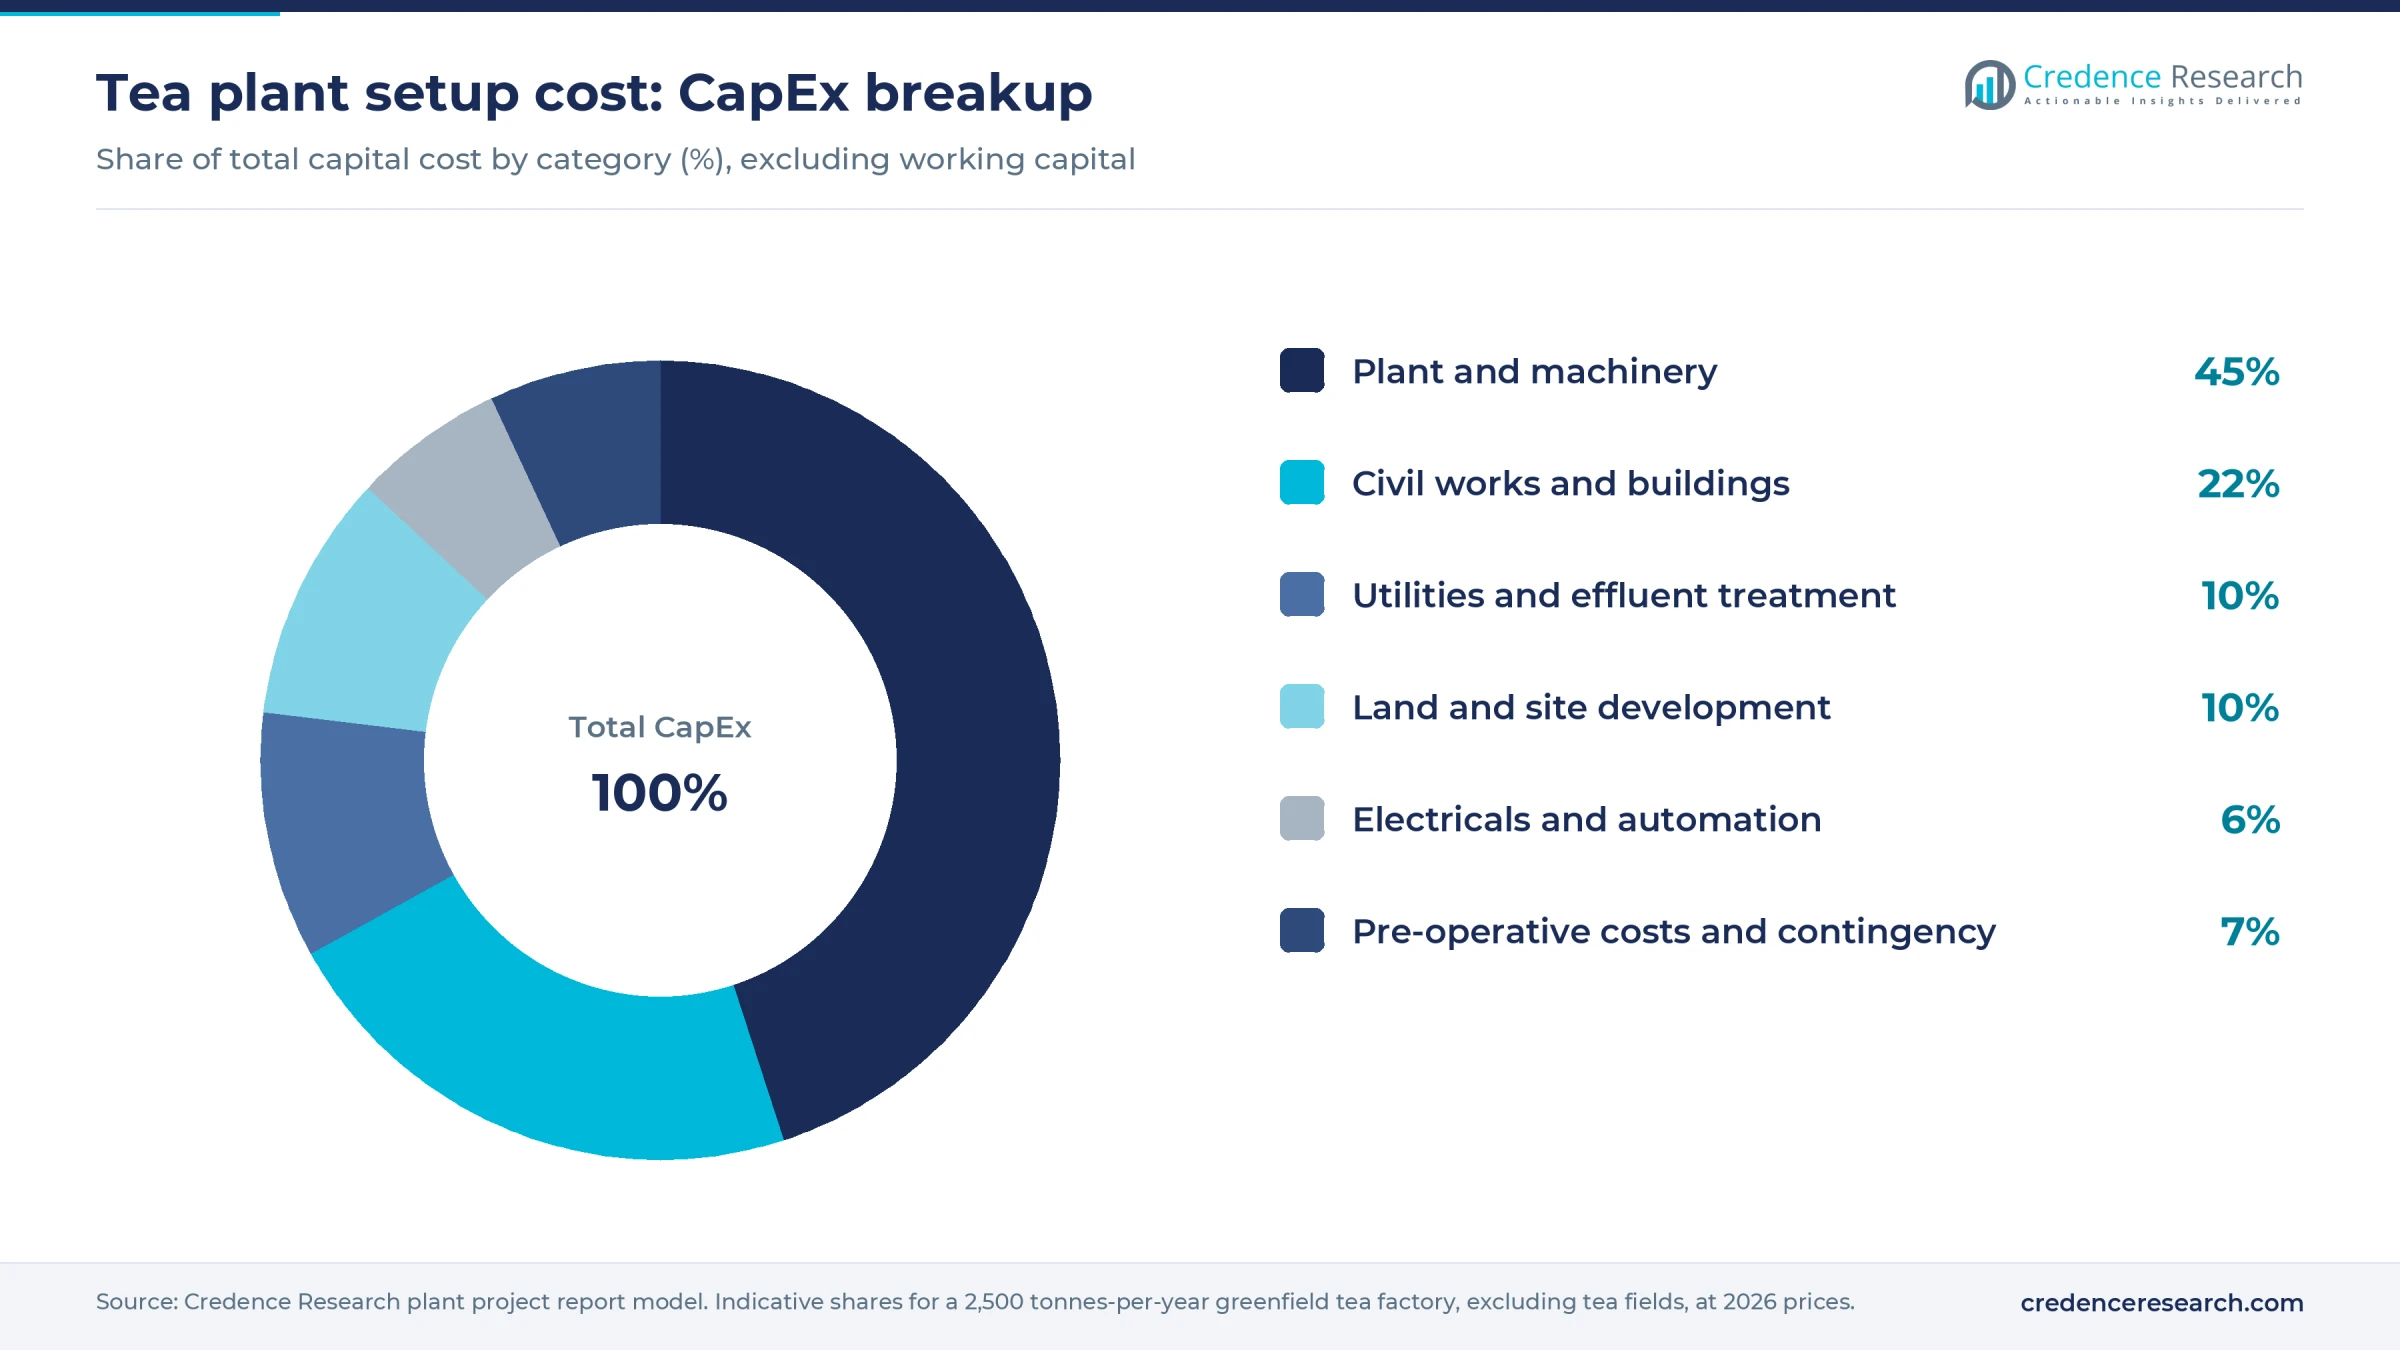
Worked example, land and site development. Kiptere uses 12 acres, about 49,000 square meters, so the model takes an assumed 20,000–40,000 square meters. At an assumed USD 10–30 per square meter in a tea-growing district in Africa or Asia, land costs USD 0.2–1.2 million, or an assumed USD 30–80 at a U.S. or EU site, USD 0.6–3.2 million. Site works add an assumed USD 0.1–0.3 million, so this row runs about 7–17% of CapEx in tea-growing regions.
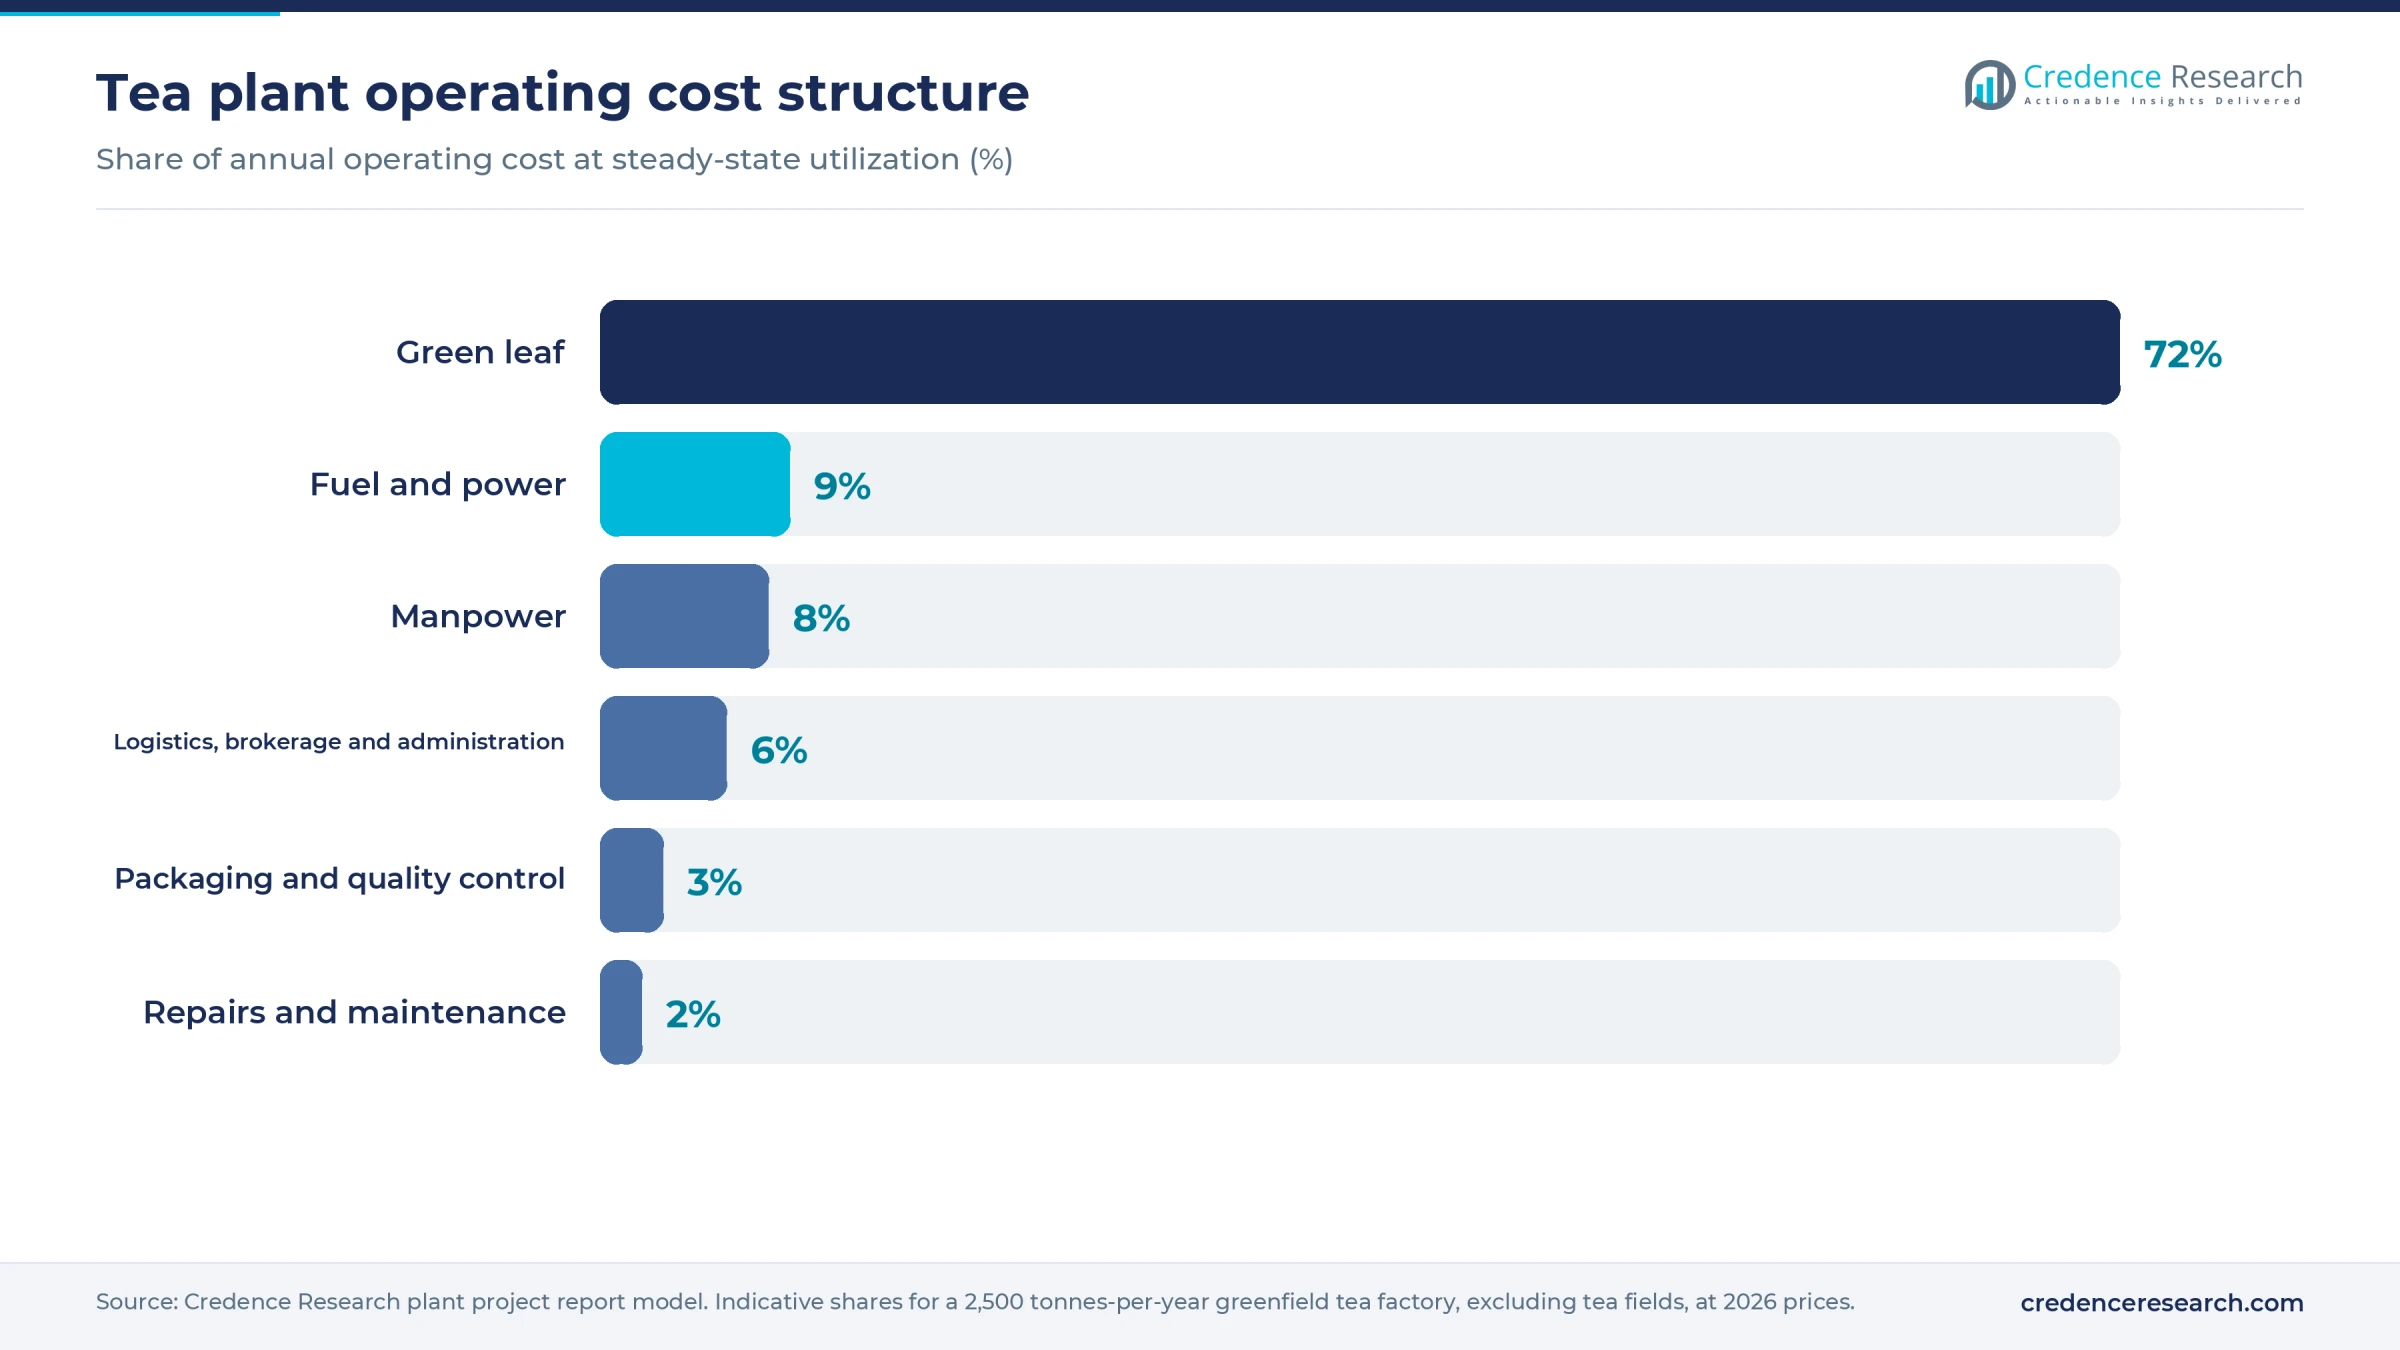
Green leaf dominates operating cost, well ahead of fuel, power and labor. Exact line items and cost sheets remain in the full report, which can be customized to any country's land, fuel and wage costs.
Machinery and raw materials for a tea plant
The main machinery groups are listed below; capacities, specifications and quotations are available in the report.
- Leaf handling: weighbridge, leaf sheds, monorail or conveyors, withering troughs with axial fans
- Rolling: CTC machines, rotor vanes and ball breakers, orthodox rollers and roll breakers
- Oxidation: continuous fermenting machines or floors, humidifiers
- Drying: endless chain or fluid bed dryers, hot air furnaces or heat exchangers
- Finishing: fiber extractors, vibrating sorters, tea bulking bins, packing lines, tasting and quality laboratory
- Utilities: boiler or biomass furnace, standby generator, water treatment, wastewater system, dust collection and fire protection
Green leaf is the one input that cannot be sourced from far away. Main growing belts are China's Yunnan, Fujian and Zhejiang provinces, Assam, West Bengal and the Nilgiris in India, Kenya's highlands east and west of the Rift Valley, Sri Lanka, Vietnam, Indonesia, Turkey's Rize coast, and Rwanda, Uganda, Tanzania and Malawi. Rules can tighten this further: Kenya's factory license asks for 700 hectares of planted bushes, and joint applicants must sit within 50 km. A factory needs roughly 2,300–3,000 hectares at typical smallholder yields, an assumed planning figure, so grower contracts matter more than any machine. Packers can review demand in the tea bag packaging report.
Tea business profit margin and ROI
A bought-leaf factory earns the gap between auction proceeds and what it pays growers, and in many regions that gap is shared by formula or cooperative rule. For the modeled factory, gross margin after leaf and direct conversion is estimated at 12–25%, at USD 2.4–3 per kg. Payback runs about 5–11 years after commissioning, including ramp-up, on mid-case cash profit of an assumed USD 0.9–1.2 million a year. A costlier build with weaker cash profit takes longer.
Kenyan tea averaged USD 2.25 per kg in 2024 export values and about USD 2.20 at a recent Mombasa sale, while Rwanda reached USD 2.81 at that sale and India's 2024 export value was USD 3.22. Orthodox lots at specialty sales can reach USD 3–10 per kg, against about USD 2.28 for average CTC, in figures cited by Browns Plantations Kenya. On the cost side, Kenyan factories paid growers monthly rates of about USD 0.18–0.23 per kg of leaf in early 2026, before year-end bonus, and this overview assumes USD 0.32–0.40 per kg all-in. That is about USD 1.44–2 of leaf per kg of made tea.
Leaf cost is the key sensitivity. A 10% rise that cannot be passed on cuts gross margin by about 6 percentage points. A weak auction year can erase cash profit, and Kenya's stated goal of leaf prices near USD 0.77 per kg by 2027 would be hard for plain CTC factories to absorb. Shifting 10–20% of output to orthodox, specialty or packed tea is the most direct way to lift returns.
| Metric | Value |
|---|---|
| Project IRR (post-tax) | Available in report |
| NPV | Available in report |
| Return on investment | Available in report |
| DSCR | Available in report |
| Break-even utilization | Available in report |
How to start a tea business, licenses and approvals
A tea factory needs approvals in six areas wherever it is built. These are business and tax registration; land use and building permits; an environmental permit covering dryer and furnace stacks, tea fluff and wastewater; occupational safety and boiler approvals, with attention to fire risk from tea dust; food business registration with product standards; and customs registration for exports. Several producing countries also license factories through a dedicated tea authority. New tea factories concentrate in producing countries, so Kenya is a key example. Exporters to the U.S. must still register foreign facilities with the FDA.
| Market | Tea and food rules | Environment and other approvals |
|---|---|---|
| Kenya | Tea Board of Kenya manufacturing license under the tea Act, 2020, with 700 hectares of planted tea, a feasibility study and a county no-objection | Environmental impact assessment license from the National Environment Management Authority; a wood fuel sustainability plan if firewood is used |
| India | Tea Board no-objection certificate and factory registration under the tea (Marketing) Control Order, 2003, with auction-sale rules; FSSAI central license above 2 tonnes a day | State pollution control board consents to establish and operate; factory license and boiler registration |
| European Union | Food business registration under Regulation (EC) No 852/2004; pesticide residue limits under Regulation (EC) No 396/2005; a 150 micrograms per kg pyrrolizidine alkaloid limit for dried tea under Regulation (EU) 2023/915 | National environmental permit for any processing or packing site; limits above also apply to tea imported from outside the EU |
Large buyers also commonly ask for ISO 22000 or FSSC 22000, plus Rainforest Alliance, Fairtrade, organic or trustea certification. Requirements vary locally, and the full report lists the steps for a chosen country.
Key tea manufacturers and recent developments
Made tea production is highly fragmented across regions. KTDA-managed smallholder factories, Browns Plantations and McLeod Russel are large producers in Africa and India, joined by Tata Consumer Products, Goodricke, China tea under COFCO, Turkey's state-owned Çaykur and Japan's Ito En. Lipton teas and Infusions is the leading global brand owner and a major buyer. Producers weighing extract lines can review the natural tea extract study.
- September 2026. The Wood Foundation Africa acquired a co-majority stake in Mushubi tea Factory in Rwanda, which can process 60 tonnes of leaf a day and expects about 1.3 million kg of made tea in 2026.
- May 2026. Tata Consumer Products' board approved up to 1.6 billion rupees, about USD 18 million at an assumed 90 rupees per dollar, for a 2,000-tonne instant tea plant in India, expected within about two years.
- November 2025. Browns Plantations Kenya commissioned an upgraded orthodox line at its Kitumbe factory, raising orthodox capacity to 3 million kg a year.
These moves point the same way, with capital flowing to premium and value-added tea rather than more plain bulk capacity.
What's inside the Tea project report PDF
The report runs to 21 chapters. Open a chapter to see its sections.
1. Preface
2. Scope and Methodology
- 2.1 Objectives of the Study
- 2.2 Stakeholders
- 2.3 Research Methodology
- 2.4 Data Sources and Key Assumptions
3. Executive Summary
- 3.1 Market Snapshot
- 3.2 Project at a Glance (Capacity, CapEx, OpEx)
- 3.3 Key Financial Indicators (IRR, NPV, Payback, Break-even)
- 3.4 Feasibility Verdict
4. Product Overview
- 4.1 Tea Definition and Properties
- 4.2 Grades and Specifications (BIS / ISO / ASTM)
- 4.3 HS Code and Classification
- 4.4 Key Applications
- 4.5 Substitutes
5. Global Tea Market
- 5.1 Market Overview
- 5.2 Historical and Current Market Performance (Volume and Value)
- 5.3 Market Breakup by Grade / Type
- 5.4 Market Breakup by End-Use Industry
- 5.5 Market Breakup by Region
- 5.6 Market Drivers, Restraints and Trends
- 5.7 Value Chain Analysis
- 5.8 Market Forecast
6. Target Country Tea Market Analysis
- 6.1 Demand and Supply Analysis
- 6.2 Installed Capacity vs Demand Gap
- 6.3 Import Dependence
- 6.4 Demand Forecast by End-Use
7. Trade Analysis
- 7.1 Imports by Volume, Value and Country
- 7.2 Exports by Volume, Value and Country
- 7.3 Trade Balance and Opportunities
8. Price Analysis
- 8.1 Historical Tea Price Trends by Region
- 8.2 Raw Material / Feedstock Price Trends and Linkage
- 8.3 Price Forecast
- 8.4 Margins Across the Value Chain
9. Competitive Landscape
- 9.1 Market Structure
- 9.2 Key Players and Installed Capacities
- 9.3 Profiles of Key Players
- 9.4 Recent Developments (Expansions, M&A, New Plants)
10. Manufacturing Process and Technology
- 10.1 Comparison of Technology Routes
- 10.2 Selected Route and Process Flow Diagram
- 10.3 Unit Operations Involved
- 10.4 Chemical Reactions Involved
- 10.5 Mass Balance and Raw Material Requirements
- 10.6 Energy Balance
- 10.7 Quality Assurance Criteria and Technical Tests
- 10.8 By-products and Waste Handling
- 10.9 Technology Licensors / Providers
11. Project Details, Requirements and Costs
- 11.1 Land, Location and Site Development
- 11.1.1 Site Selection Criteria
- 11.1.2 Location Analysis
- 11.1.3 Land Requirement and Costs
- 11.1.4 Site Development Costs
- 11.2 Plant Layout
- 11.2.1 Layout Principles
- 11.2.2 Proposed Layout
- 11.2.3 Factors Influencing Layout
- 11.3 Civil Works and Buildings
- 11.4 Plant Machinery
- 11.4.1 Machinery Requirements and Specifications
- 11.4.2 Machinery Costs
- 11.4.3 Machinery Suppliers
- 11.5 Raw Materials
- 11.5.1 Requirements per Tonne of Output
- 11.5.2 Procurement and Sourcing
- 11.5.3 Costs
- 11.5.4 Suppliers
- 11.6 Packaging
- 11.6.1 Packaging Requirements
- 11.6.2 Packaging Costs
- 11.6.3 Packaging Suppliers
- 11.7 Storage and Material Handling
- 11.8 Transportation Requirements and Costs
- 11.9 Utilities
- 11.9.1 Power Requirements and Costs
- 11.9.2 Water Requirements and Costs
- 11.9.3 Steam, Fuel and Other Utilities
- 11.10 Manpower Requirements and Wages
12. Environment, Health, Safety and Sustainability
- 12.1 Effluent and Emissions Management
- 12.2 Hazard Classification and Safety Measures
- 12.3 Carbon Footprint
- 12.4 Green / Low-Carbon Process Options
13. Regulatory Procedures, Approvals and Certifications
- 13.1 Licences and Registrations
- 13.2 Environmental Clearances
- 13.3 Product Certifications (BIS, REACH, etc.)
- 13.4 Approval Timeline
14. Project Implementation Schedule
15. Project Economics
- 15.1 Capital Cost of the Project
- 15.2 Techno-Economic Parameters
- 15.3 Capacity Utilization and Ramp-up
- 15.4 Product Pricing and Margins
- 15.5 Income Projections
- 15.6 Expenditure Projections
- 15.7 Working Capital Requirement
- 15.8 Taxation
- 15.9 Depreciation
16. Financial Analysis
- 16.1 Projected Profit and Loss Account
- 16.2 Projected Cash Flow Statement
- 16.3 Projected Balance Sheet
- 16.4 Liquidity Analysis
- 16.5 Profitability Analysis (Payback, NPV, IRR, ROI)
- 16.6 Break-even Analysis
- 16.7 Debt Service Coverage Ratio (DSCR)
- 16.8 Sensitivity Analysis
- 16.9 Scenario and Uncertainty Analysis
17. Funding and Incentives
- 17.1 Means of Finance and Debt-Equity Structure
- 17.2 Loans and Financial Assistance
- 17.3 Government Schemes and Subsidies (PLI, State Policies)
18. Risk Assessment
- 18.1 Key Success Factors
- 18.2 Key Risk Factors
- 18.3 Risk Mitigation
19. Strategic Recommendations
20. Case Study of a Successful Venture
21. Appendix
- 21.1 Detailed Assumptions
- 21.2 Abbreviations
- 21.3 List of Tables and Figures
- 21.4 Sources
This page vs. the full report
| Data point | On this page (free) | In the full report |
|---|---|---|
| Total CapEx | One rounded range at one capacity | Exact figure at three capacities with a line-item breakup |
| CapEx breakup | Category shares (%) only | Cost, quantity and supplier for every machine |
| Operating cost | Share of raw materials, utilities and labor | Per-unit cost sheet with each input price and consumption |
| Profitability | Gross margin range and payback band | Exact IRR, NPV, ROI, break-even and DSCR |
| Financial statements | List of what is included | 10-year P&L, cash flow, balance sheet and Excel model |
| Sensitivity | One directional line | Full sensitivity and scenario tables |
| Process | Simplified flow diagram | Detailed process flow, mass and energy balance, operating conditions |
| Machinery | Names of the main machines | Specifications, capacity, cost and supplier list |
| Market | Headline size, growth and India demand trend | Segment, region, trade and price forecast tables |
| Suppliers and buyers | Supplier types and sourcing hubs | Named suppliers and buyers |
Tea project report: FAQs
How much does it cost to set up a tea processing plant?
How much green leaf does a tea factory need?
What profit margin can a tea factory earn?
Is CTC or orthodox tea better for a new plant?
Which licenses does a tea factory need?
Where is tea produced and who buys it?
Should a tea factory own its tea fields?

About the analyst
Priyanka Mor, Senior Consultant
Senior Consultant at Credence Research Inc directing strategic market advisory, cross-border commercial due diligence and enterprise intelligence frameworks for global B2B clients. Combines quantitative modeling with executive advisory, translating macroeconomic variables and supply chain data into go-to-market blueprints, M&A screenings and competitive war-gaming strategies.
Related market research
- Tea Market Industry Size, Share, Growth & Forecast 2032
- Ready To Drink Tea Market Size, Growth and Forecast 2032
- Tea Bag Packaging Market Size, Trends, Share and Forecast 2032
- Natural Tea Extract Market Size, Trends, Share and Forecast 2032
- Matcha Tea Market Size, Growth & Forecast to 2032
- Fruit Tea Market Size, Share, Growth, Trends and Forecast 2032
More plant project reports
- Vinegar Manufacturing Plant Project Report (DPR) 2026
- Onion Powder Manufacturing Plant Project Report (DPR) 2026
- Fruit Juice Processing Plant Project Report (DPR) 2026
- Guar Gum Powder Manufacturing Plant Project Report (DPR) 2026
- Shrimp Processing Plant Project Report (DPR) 2026
- Instant Coffee Manufacturing Plant Project Report (DPR) 2026