
Quick answer
A whey protein plant filters liquid cheese whey through ultrafiltration membranes and spray-dries the protein-rich retentate into powder such as WPC80. This overview models a greenfield plant making 3,000 tonnes of WPC80 a year from about 390,000 tonnes of whey, with estimated CapEx of USD 18–30 million. Gross margin is estimated at 30–45% at an assumed through-cycle price, with payback at 3–8 years. A secure whey supply decides feasibility.
Attractive for a processor with a long-term whey contract beside a large cheese plant; a stand-alone plant that must truck whey, or one that prices its plan on 2026 spot powder prices, carries high risk.
Whey Protein plant: key highlights
| Parameter | Indicative value | Note |
|---|---|---|
| Plant capacity | 3,000 tonnes of WPC80 per year | About 9 tonnes a day over 330 days, from about 390,000 tonnes of liquid whey |
| Total CapEx | USD 18–30 million | Greenfield, scaled from DMK's EUR 26 million, 7,000-tonne WPC80 project; excludes working capital and permeate drying |
| Raw material share of operating cost | 55–75% | Liquid whey bought at an assumed 40–50% of the WPC80 price |
| Gross margin | 30–45% | At an assumed through-cycle price of USD 9,000–15,000 per tonne, well below 2026 spot quotes |
| Payback period | 3–8 years | At 80% utilization, including an assumed one-year ramp-up; extreme pairings run about 2.5–11 years |
| IRR | Available in report | Post-tax, 10-year model |
| Break-even | Available in report | Capacity utilization basis |
Ranges assume a 3,000 tonnes-per-year greenfield WPC80 plant, 330 operating days, 80% utilization and 2026 costs. The through-cycle price of USD 9,000–15,000 per tonne, whey at 40–50% of that price, conversion costs, permeate credit and land rates are assumed. Euros convert at an assumed USD 1.15. CapEx excludes working capital and permeate drying. The full report can be customized to any country or region.
What is whey protein?
Whey protein is the soluble protein fraction left in the liquid whey that drains from curd during cheese or casein making. It is recovered mainly by membrane filtration and sold as a dry powder. Sweet whey holds only about 0.8% protein within 6–7% total solids, so a plant must remove more than 99% of the water and most of the lactose to make a high-protein ingredient.
Grades are set by protein content on a dry basis. WPC34 replaces skim milk powder in many foods. WPC80 carries at least 79.5% protein under the American Dairy Products Institute standard, isolate exceeds 90%, and hydrolysates are partly broken down for infant and clinical nutrition. Microparticulated and instantized forms add creaminess or mixability.
For trade, HS subheading 3502.20 covers milk albumin and concentrates of two or more whey proteins containing more than 80% whey protein on dry matter, which takes in isolates and many high-end concentrates. Lower grades fall under 0404.10, whey whether or not concentrated. Buyers include sports nutrition brands, makers of shakes and bars, infant formula producers, bakeries and dairy processors. Credence Research tracks the isolate segment separately.
Whey protein market overview and global demand
Credence Research estimates the global whey protein ingredients market at about USD 7.6 billion in 2025, based on its USD 7.04 billion figure for 2024 and a 7.31% CAGR, and expects USD 12.3 billion by 2032. Its separate concentrate study put that segment at USD 4.1 billion in 2024. Sports nutrition, high-protein snacks and ready-to-drink shakes drive the growth, and processors such as Wisconsin whey protein also cite rising use of GLP-1 weight-loss drugs.
Supply is tied to cheese output. The United States made 14.8 billion pounds of cheese in 2025, and the USDA's Dairy Products 2025 Summary recorded 380.6 million pounds of WPC with 50–89.9% protein, up 8.6%, and 213.5 million pounds of isolate, up 10.9%. Together that is about 270,000 tonnes. Lower-protein WPC fell 14.1% as processors moved whey solids into higher grades.
Trade in the over-80% grade is concentrated. UN Comtrade data for 2023 show world exports under HS 3502.20 of about USD 2.1 billion. The U.S. supplied about 30%, Germany and the Netherlands about 15% each, New Zealand 11% and Poland 7%. China was the largest importer, with about 17%, followed by Japan, the Netherlands, India and the U.K.
Powder prices have surged since mid-2025. USDA Dairy Market News quoted WPC80 at USD 12.50–13.00 per pound in mid-July 2026, about USD 27,500–28,700 per tonne, with isolate in the mid-USD 13s to mid-USD 14s. Suppliers are booking orders months ahead and adding capacity, so a plant starting in 2028 should expect lower prices than today.
Whey protein manufacturing process
A whey protein plant is a separation and water-removal operation. Freshness matters, because warm whey loses quality and grows bacteria within hours, so most plants sit beside a cheese plant or collect chilled whey over a short haul. The steps below describe a WPC80 line.
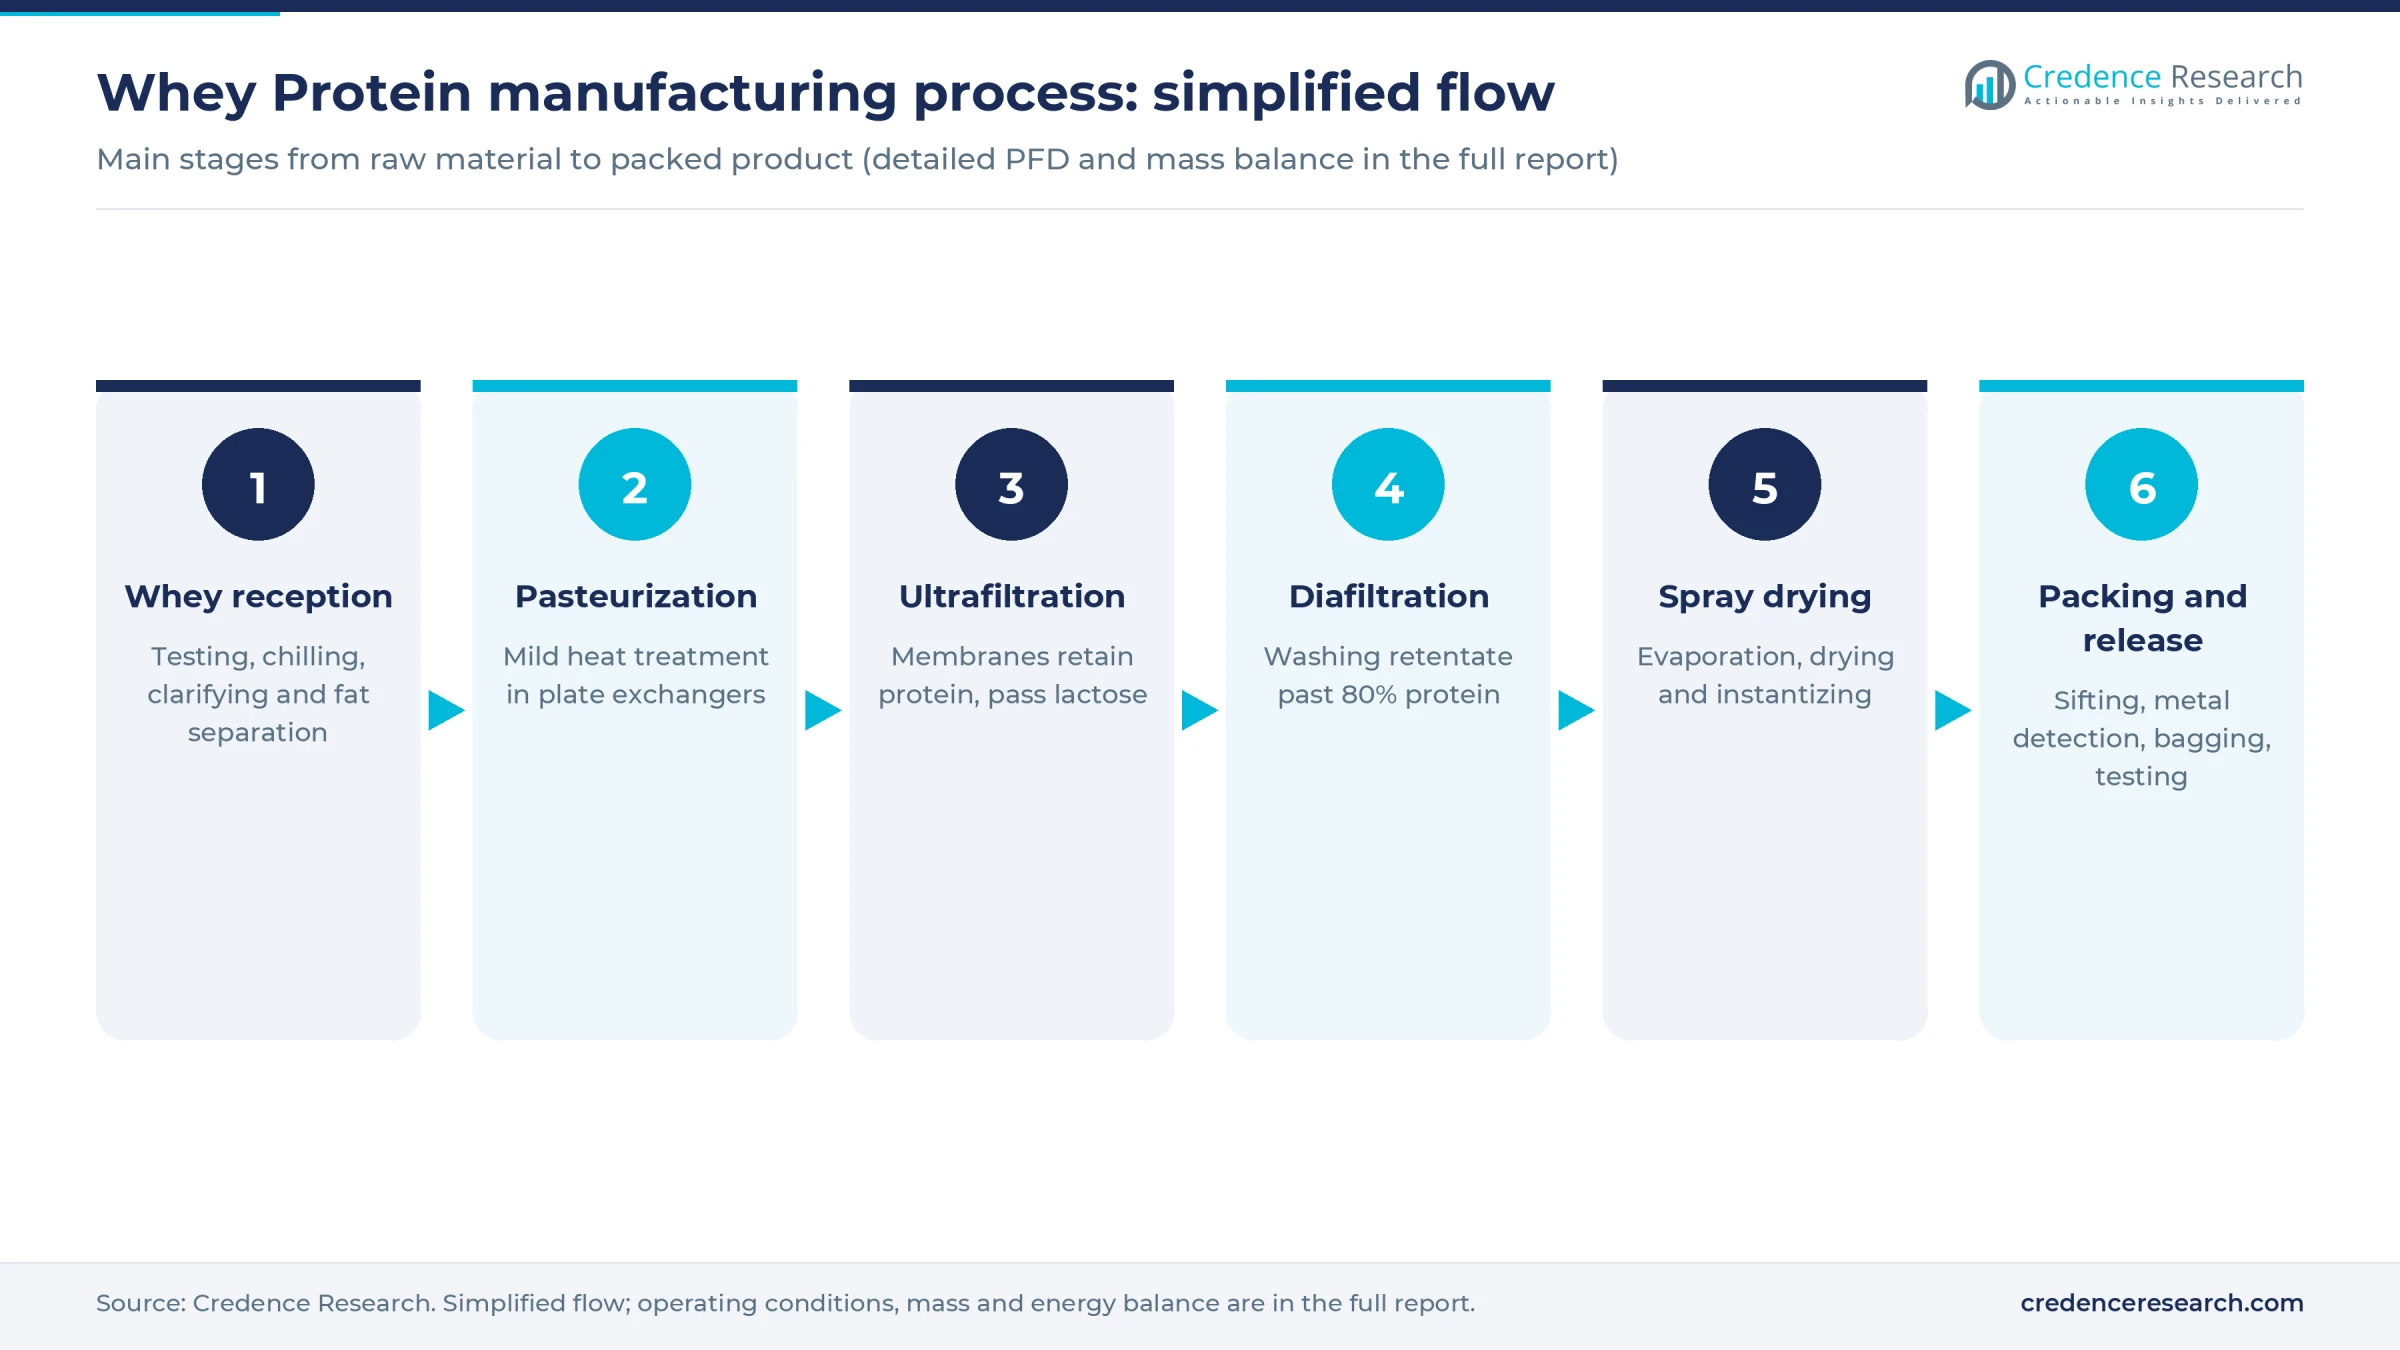
- Whey reception and pretreatment. Tankers or pipelines deliver sweet whey, which is tested, chilled and passed through a clarifier to remove cheese fines and a separator to strip residual fat as whey cream.
- Pasteurization. A plate heat exchanger pasteurizes the whey, which U.S. rules require for WPC used in food, with heat kept mild enough to avoid denaturing the protein.
- Ultrafiltration. Spiral-wound polymer membranes retain the protein and let water, lactose and minerals pass as permeate. The process runs cold to limit microbial growth.
- Diafiltration. Water is added to the retentate and filtered again to wash out more lactose and minerals until protein exceeds 80% of solids. Isolate lines add microfiltration or ion exchange to remove fat.
- Evaporation and spray drying. Retentate may be concentrated further in a falling-film evaporator, then spray-dried to 4–5% moisture. Many plants instantize the powder with lecithin in a fluid bed so it disperses in shakes.
- Packing and release. Powder is sifted, passed through metal detection and packed into lined bags or big bags, then held until microbial and protein tests clear.
Yield is the number that drives the business. With about 0.8% protein in whey, as a USDA technical review states, and some nonprotein nitrogen lost to permeate, a plant recovers roughly 7–8 kg of WPC80 per tonne of whey, or about 130 kg of whey per kilogram of powder. Each kilogram also leaves more than 120 kg of lactose-rich permeate that must be sold, dried or treated. Larger sites dry it into permeate or lactose powder, products covered in Credence Research's dairy ingredients analysis.
Whey protein plant setup cost
This overview models a greenfield plant making 3,000 tonnes of WPC80 a year, about 9 tonnes a day over 330 days, from roughly 390,000 tonnes of whey. Estimated total CapEx is USD 18–30 million, excluding working capital and permeate drying.
The main benchmark is DMK's May 2026 plan to spend EUR 26 million on a WPC80 plant of up to 7,000 tonnes at Edewecht, Germany, part of a EUR 55 million site program. At an assumed USD 1.15 per euro, that is about USD 30 million. Scaled to 3,000 tonnes with an assumed 0.7 power rule, it gives about USD 16.5 million. Because Edewecht is an existing dairy site, an assumed USD 4–10 million is added for whey intake, utilities, effluent treatment and buildings on a bare plot, giving about USD 20–27 million.
A process equipment supplier offers a cross-check. It put a WPC80 line at EUR 7–11 million in remarks reported in September 2026 from an industry event in Kazakhstan, about USD 8–13 million, with payback of four to seven years. If the line is 40–55% of a greenfield project, the total is about USD 15–32 million.
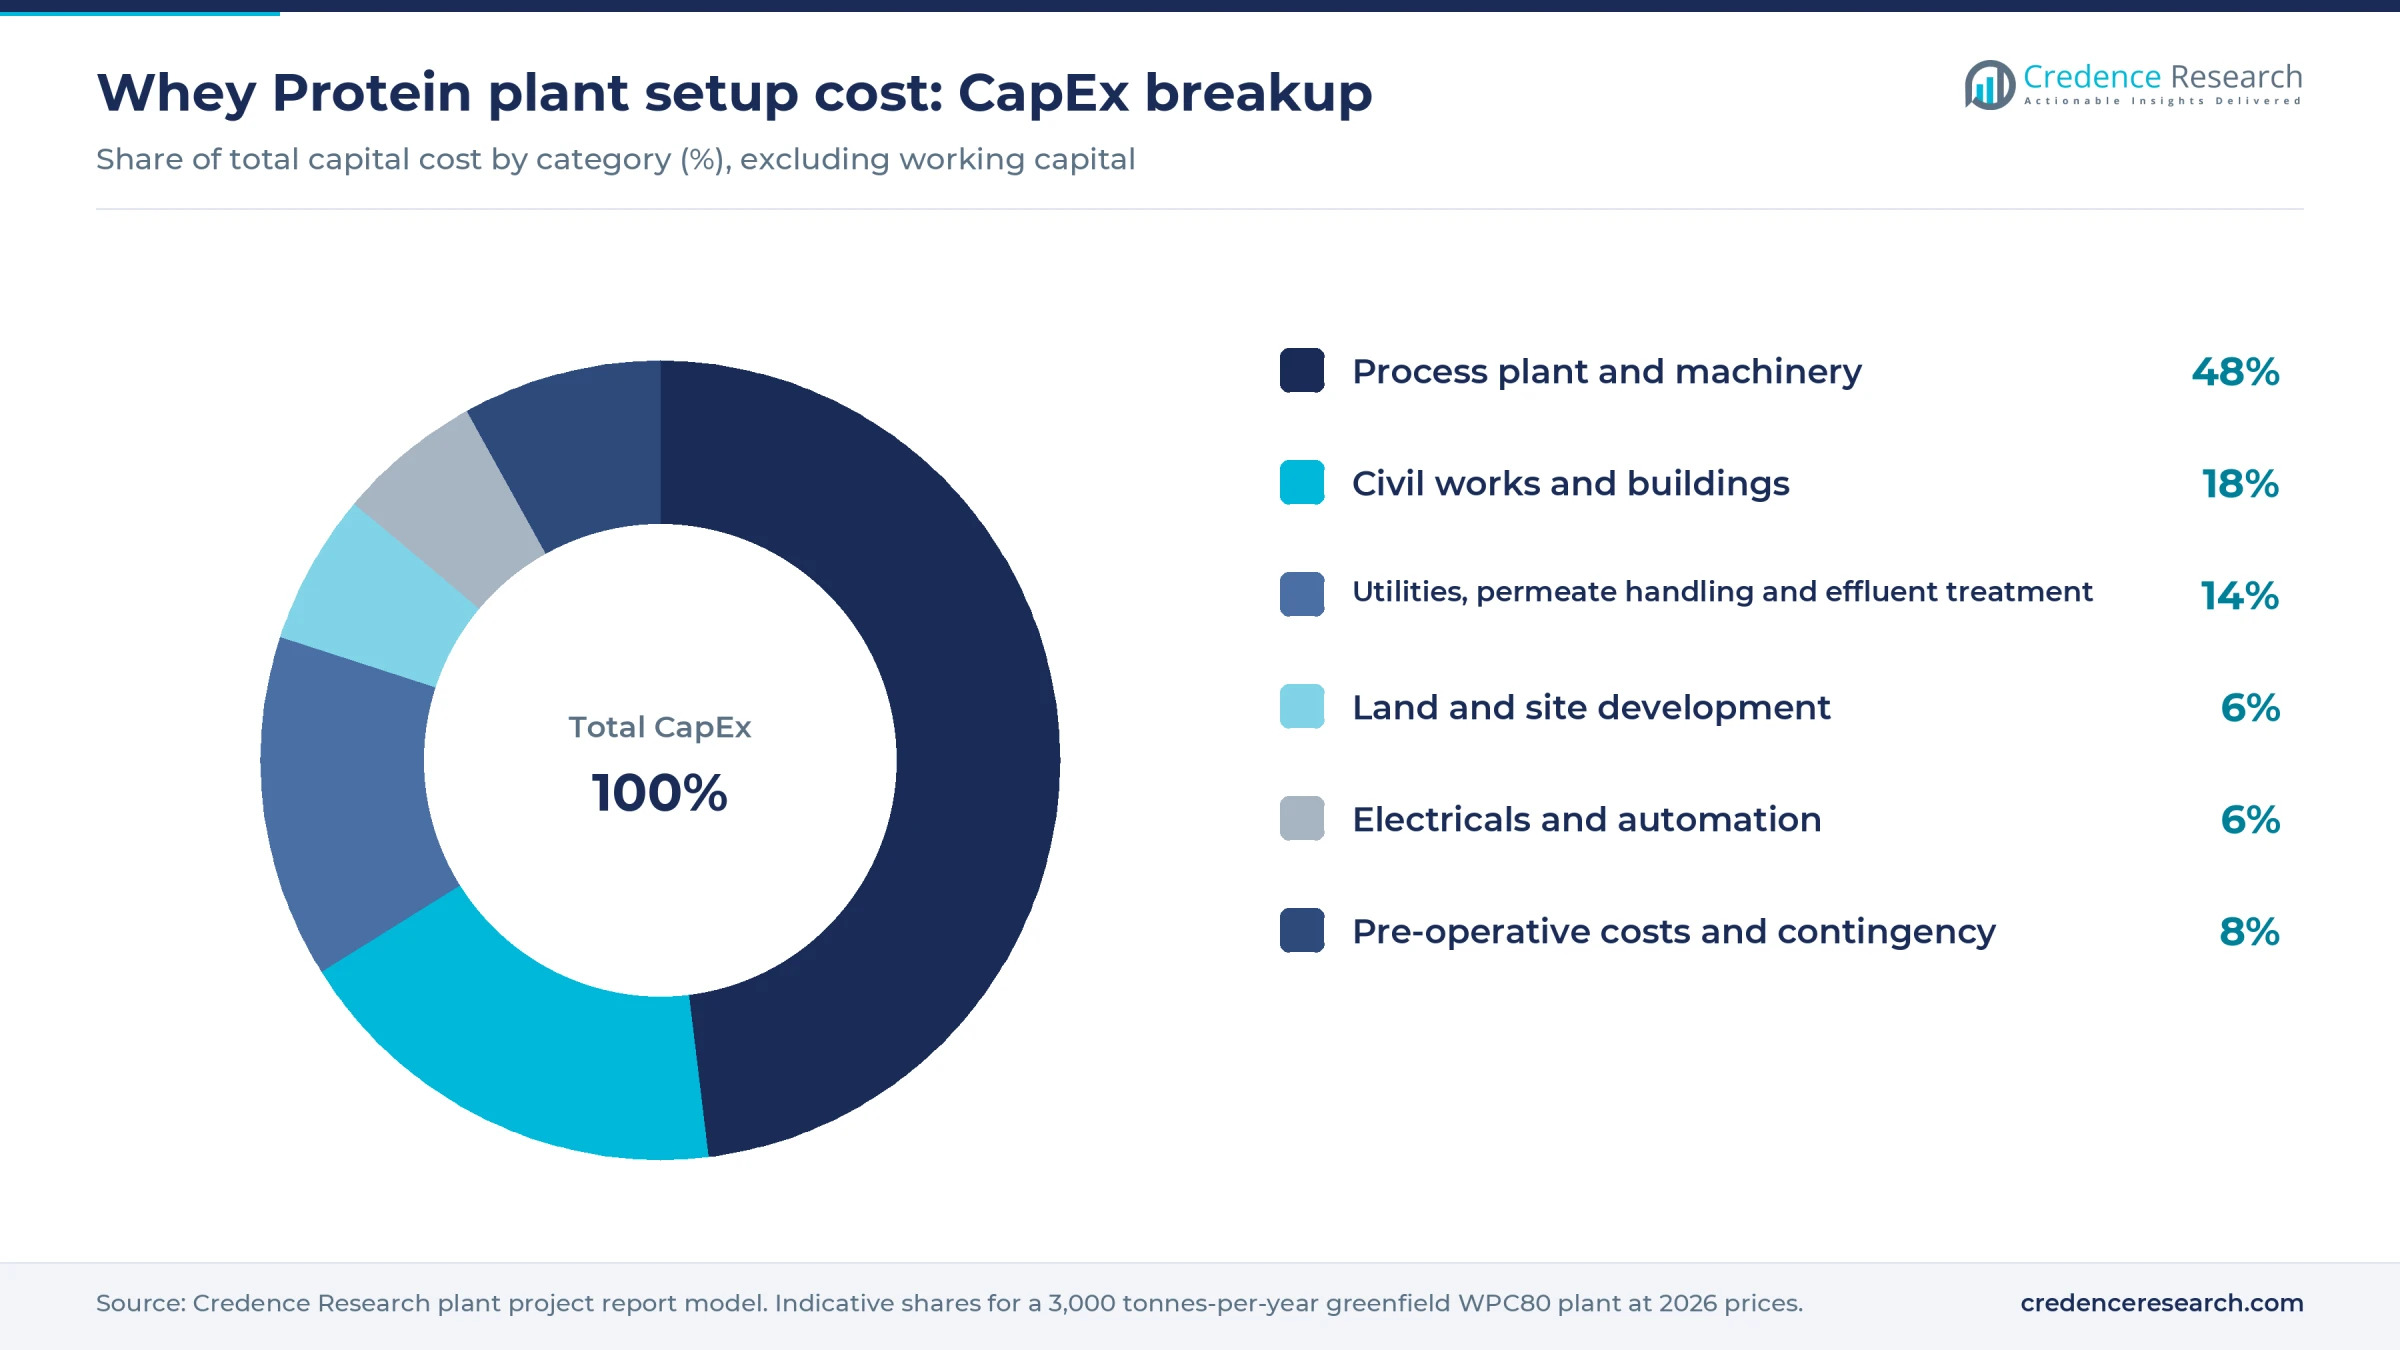
Worked example, land and site development. The plant needs an assumed 20,000–30,000 square meters for tanker bays, whey and permeate tanks, a dryer tower, a warehouse and effluent treatment. At an assumed USD 20–50 per square meter in an Asian industrial park, land costs about USD 0.4–1.5 million. At an assumed USD 30–80 at a U.S. or EU site, it costs about USD 0.6–2.4 million. Site works add an assumed USD 0.3–0.8 million, so this row runs about 4–10% of CapEx.
Working capital adds an estimated USD 3–5 million, mostly for whey payments, packaging and powder held for release tests. The full report can model costs for any country.
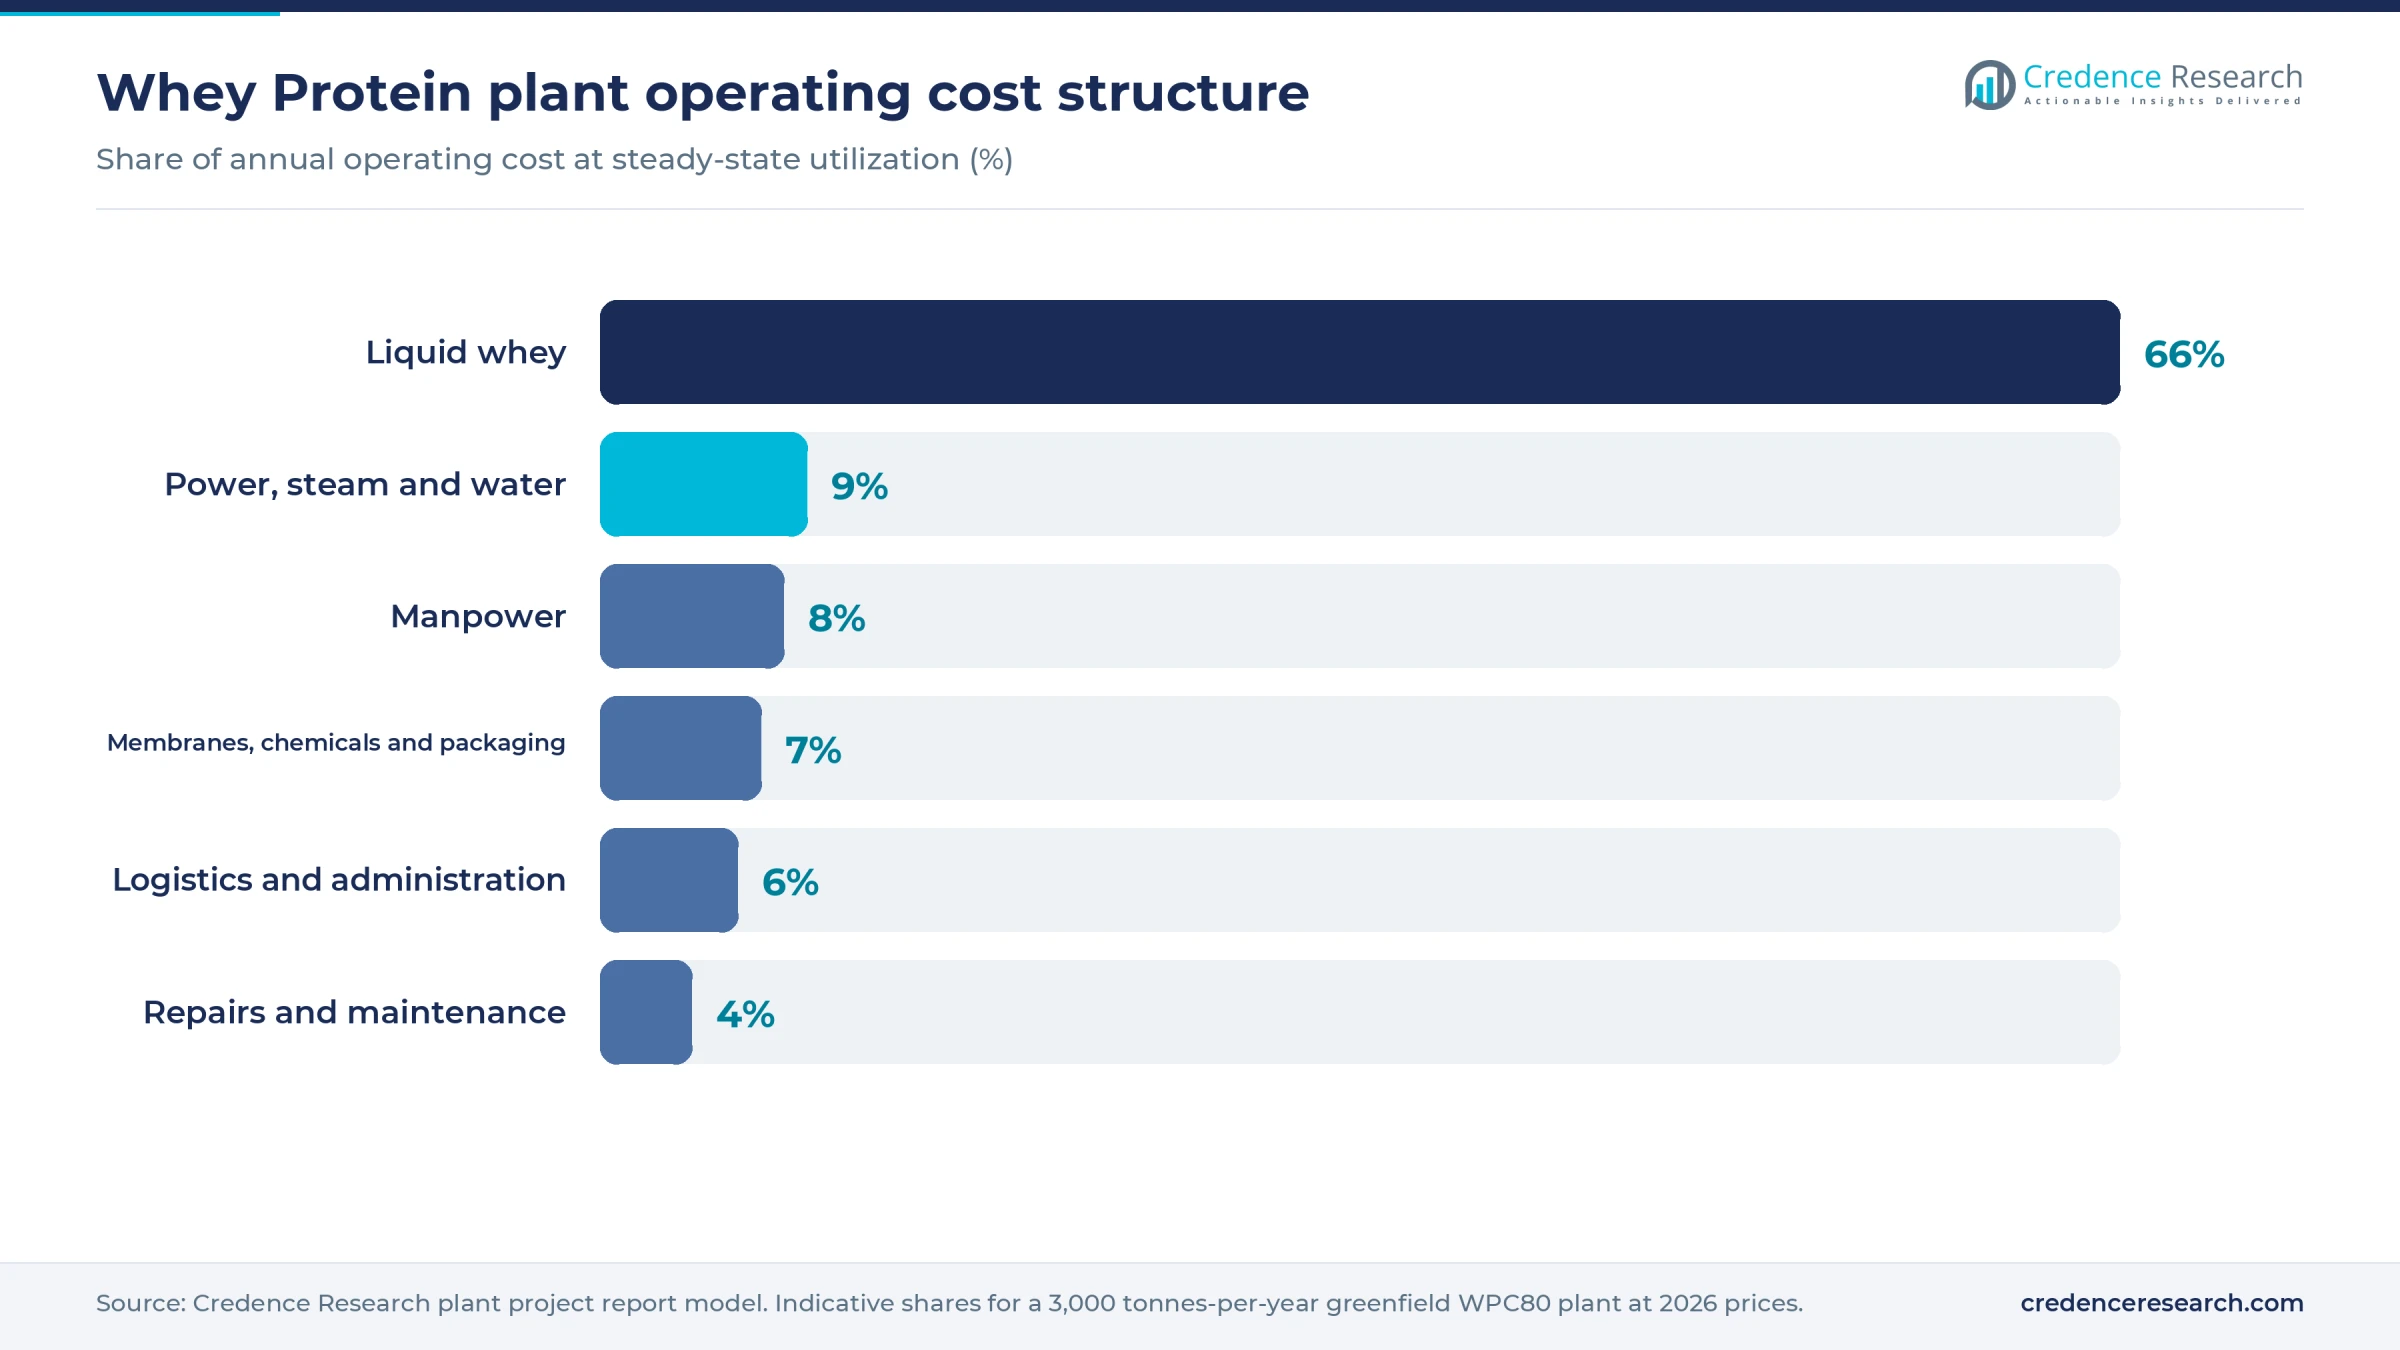
Whey dominates operating cost, and its price is increasingly linked to protein values rather than treated as a waste stream.
Machinery and raw materials for a whey protein plant
The main machinery groups are listed below; capacities, specifications and quotations are available in the report.
- Whey intake: tanker bays, test laboratory, plate coolers, insulated silos, clarifiers and fat separators
- Heat treatment: plate pasteurizer with regeneration and cooling sections
- Membranes: ultrafiltration and diafiltration skids, optional microfiltration for isolate, and reverse osmosis to concentrate permeate and recover water
- Drying: falling-film evaporator, spray dryer with integrated fluid bed, lecithin dosing and powder silos
- Packing: sifters, metal detectors, bag and big-bag fillers and palletizers
- Utilities: boilers or heat pumps, chillers, clean-in-place, compressed air and effluent treatment
Liquid whey is about 93% water and cannot travel far, so supply follows cheese output. The largest surplus regions are the EU dairy belt, led by Germany, France, the Netherlands, Italy, Poland, Ireland and Denmark; the U.S. Upper Midwest, California, Idaho and the Southwest; New Zealand and Australia; and Argentina and Brazil. Large cheese plants are rarer in South and Southeast Asia, and India remains a sizable importer of high-grade whey protein.
The modeled plant needs the whey from about 43,000 tonnes of cheese a year, so a long-term contract with one or two large cheese makers comes first. Lecithin, bag liners and cleaning chemicals are minor and widely traded.
Whey protein business profit margin and ROI
Gross margin after whey and direct conversion costs is estimated at 30–45%. The model uses an assumed through-cycle WPC80 price of USD 9,000–15,000 per tonne, well below the July 2026 spot quote, because new capacity in the U.S. and Europe is likely to cool prices. It assumes whey is bought under contracts that index its price to protein value, at 40–50% of the WPC80 price, with direct conversion at an assumed USD 1,500–2,300 per tonne and an assumed permeate credit of USD 340–670.
At 80% utilization, 2,400 tonnes generate revenue of about USD 22–36 million and gross profit of about USD 6.5–16 million. After assumed overheads of USD 1.5–2.5 million and an assumed 25% tax rate, cash profit is about USD 3–11 million. Including a one-year ramp-up, payback is typically 3–8 years. A USD 18 million build at the top of the profit range pays back in under three years, while a USD 30 million build at the bottom takes about 11.
The spread between powder and whey is the main risk. A USD 1,000 per tonne fall in the WPC80 price, with whey costs unchanged, cuts gross margin by about 5–7 percentage points.
| Metric | Value |
|---|---|
| Project IRR (post-tax) | Available in report |
| NPV | Available in report |
| Return on investment | Available in report |
| DSCR | Available in report |
| Break-even utilization | Available in report |
How to start a whey protein business, licenses and approvals
A whey protein plant needs approvals in the same broad areas in most countries. These are business and tax registration; land use, zoning and building permits; an environmental permit covering high-strength permeate, wash water and dryer emissions; occupational safety approvals for boilers, pressure vessels and combustible dust in drying and packing areas; dairy or food establishment approval with a hazard analysis plan; and export registration. Sports nutrition and infant formula buyers usually also require FSSC 22000 or BRCGS certification, halal and kosher certificates and, for some sports brands, banned-substance testing.
| Market | Food and product | Environment and safety |
|---|---|---|
| United States | FDA food facility registration; preventive controls under 21 CFR 117; WPC affirmed as GRAS under 21 CFR 184.1979c; state dairy plant license; protein supplement blenders also follow 21 CFR 111 | NPDES or local pretreatment permit; state air permit for the dryer and boilers; OSHA workplace safety rules, including combustible dust hazards |
| European Union | Establishment approval and identification mark under Regulation (EC) No 853/2004; hygiene under Regulation (EC) No 852/2004; infant formula grades must meet Delegated Regulation (EU) 2016/127 | National environmental permit, or an Industrial Emissions Directive permit where the site counts as dairy processing above 200 tonnes of milk a day; ATEX rules for dust zones |
| India | FSSAI central license, required for dairy units handling more than 50,000 liters a day or 2,500 tonnes of milk solids a year, a level the modeled plant exceeds; Export Inspection Council certification where importers require it | State pollution control board consents to establish and operate; factory license and boiler registration |
Key whey protein manufacturers and recent developments
Leading makers include Glanbia, Arla Foods Ingredients, FrieslandCampina Ingredients, Fonterra, Lactalis Ingredients, Hilmar Ingredients, Leprino Foods, Saputo, DMK, Agropur and Carbery. Ireland's Tirlán is building a EUR 126 million whey facility at Ballyragget due by mid-2027, and specialists such as Actus Nutrition process whey bought from cheese makers.
- November 2025. Glanbia said it will add 10 million pounds of isolate capacity, about 4,500 tonnes, at its Southwest Cheese joint venture in New Mexico, due online in 2027.
- May 2026. DMK announced a EUR 26 million WPC80 plant of up to 7,000 tonnes at Edewecht, Germany, within a EUR 55 million site upgrade.
- August 2026. Actus Nutrition said it is adding 40 million pounds of annual whey powder capacity in Fond du Lac, Wisconsin, covering concentrates, isolates and hydrolysates.
What's inside the Whey Protein project report PDF
The report runs to 21 chapters. Open a chapter to see its sections.
1. Preface
2. Scope and Methodology
- 2.1 Objectives of the Study
- 2.2 Stakeholders
- 2.3 Research Methodology
- 2.4 Data Sources and Key Assumptions
3. Executive Summary
- 3.1 Market Snapshot
- 3.2 Project at a Glance (Capacity, CapEx, OpEx)
- 3.3 Key Financial Indicators (IRR, NPV, Payback, Break-even)
- 3.4 Feasibility Verdict
4. Product Overview
- 4.1 Whey Protein Definition and Properties
- 4.2 Grades and Specifications (BIS / ISO / ASTM)
- 4.3 HS Code and Classification
- 4.4 Key Applications
- 4.5 Substitutes
5. Global Whey Protein Market
- 5.1 Market Overview
- 5.2 Historical and Current Market Performance (Volume and Value)
- 5.3 Market Breakup by Grade / Type
- 5.4 Market Breakup by End-Use Industry
- 5.5 Market Breakup by Region
- 5.6 Market Drivers, Restraints and Trends
- 5.7 Value Chain Analysis
- 5.8 Market Forecast
6. Target Country Whey Protein Market Analysis
- 6.1 Demand and Supply Analysis
- 6.2 Installed Capacity vs Demand Gap
- 6.3 Import Dependence
- 6.4 Demand Forecast by End-Use
7. Trade Analysis
- 7.1 Imports by Volume, Value and Country
- 7.2 Exports by Volume, Value and Country
- 7.3 Trade Balance and Opportunities
8. Price Analysis
- 8.1 Historical Whey Protein Price Trends by Region
- 8.2 Raw Material / Feedstock Price Trends and Linkage
- 8.3 Price Forecast
- 8.4 Margins Across the Value Chain
9. Competitive Landscape
- 9.1 Market Structure
- 9.2 Key Players and Installed Capacities
- 9.3 Profiles of Key Players
- 9.4 Recent Developments (Expansions, M&A, New Plants)
10. Manufacturing Process and Technology
- 10.1 Comparison of Technology Routes
- 10.2 Selected Route and Process Flow Diagram
- 10.3 Unit Operations Involved
- 10.4 Chemical Reactions Involved
- 10.5 Mass Balance and Raw Material Requirements
- 10.6 Energy Balance
- 10.7 Quality Assurance Criteria and Technical Tests
- 10.8 By-products and Waste Handling
- 10.9 Technology Licensors / Providers
11. Project Details, Requirements and Costs
- 11.1 Land, Location and Site Development
- 11.1.1 Site Selection Criteria
- 11.1.2 Location Analysis
- 11.1.3 Land Requirement and Costs
- 11.1.4 Site Development Costs
- 11.2 Plant Layout
- 11.2.1 Layout Principles
- 11.2.2 Proposed Layout
- 11.2.3 Factors Influencing Layout
- 11.3 Civil Works and Buildings
- 11.4 Plant Machinery
- 11.4.1 Machinery Requirements and Specifications
- 11.4.2 Machinery Costs
- 11.4.3 Machinery Suppliers
- 11.5 Raw Materials
- 11.5.1 Requirements per Tonne of Output
- 11.5.2 Procurement and Sourcing
- 11.5.3 Costs
- 11.5.4 Suppliers
- 11.6 Packaging
- 11.6.1 Packaging Requirements
- 11.6.2 Packaging Costs
- 11.6.3 Packaging Suppliers
- 11.7 Storage and Material Handling
- 11.8 Transportation Requirements and Costs
- 11.9 Utilities
- 11.9.1 Power Requirements and Costs
- 11.9.2 Water Requirements and Costs
- 11.9.3 Steam, Fuel and Other Utilities
- 11.10 Manpower Requirements and Wages
12. Environment, Health, Safety and Sustainability
- 12.1 Effluent and Emissions Management
- 12.2 Hazard Classification and Safety Measures
- 12.3 Carbon Footprint
- 12.4 Green / Low-Carbon Process Options
13. Regulatory Procedures, Approvals and Certifications
- 13.1 Licences and Registrations
- 13.2 Environmental Clearances
- 13.3 Product Certifications (BIS, REACH, etc.)
- 13.4 Approval Timeline
14. Project Implementation Schedule
15. Project Economics
- 15.1 Capital Cost of the Project
- 15.2 Techno-Economic Parameters
- 15.3 Capacity Utilization and Ramp-up
- 15.4 Product Pricing and Margins
- 15.5 Income Projections
- 15.6 Expenditure Projections
- 15.7 Working Capital Requirement
- 15.8 Taxation
- 15.9 Depreciation
16. Financial Analysis
- 16.1 Projected Profit and Loss Account
- 16.2 Projected Cash Flow Statement
- 16.3 Projected Balance Sheet
- 16.4 Liquidity Analysis
- 16.5 Profitability Analysis (Payback, NPV, IRR, ROI)
- 16.6 Break-even Analysis
- 16.7 Debt Service Coverage Ratio (DSCR)
- 16.8 Sensitivity Analysis
- 16.9 Scenario and Uncertainty Analysis
17. Funding and Incentives
- 17.1 Means of Finance and Debt-Equity Structure
- 17.2 Loans and Financial Assistance
- 17.3 Government Schemes and Subsidies (PLI, State Policies)
18. Risk Assessment
- 18.1 Key Success Factors
- 18.2 Key Risk Factors
- 18.3 Risk Mitigation
19. Strategic Recommendations
20. Case Study of a Successful Venture
21. Appendix
- 21.1 Detailed Assumptions
- 21.2 Abbreviations
- 21.3 List of Tables and Figures
- 21.4 Sources
This page vs. the full report
| Data point | On this page (free) | In the full report |
|---|---|---|
| Total CapEx | One rounded range at one capacity | Exact figure at three capacities with a line-item breakup |
| CapEx breakup | Category shares (%) only | Cost, quantity and supplier for every machine |
| Operating cost | Share of raw materials, utilities and labor | Per-unit cost sheet with each input price and consumption |
| Profitability | Gross margin range and payback band | Exact IRR, NPV, ROI, break-even and DSCR |
| Financial statements | List of what is included | 10-year P&L, cash flow, balance sheet and Excel model |
| Sensitivity | One directional line | Full sensitivity and scenario tables |
| Process | Simplified flow diagram | Detailed process flow, mass and energy balance, operating conditions |
| Machinery | Names of the main machines | Specifications, capacity, cost and supplier list |
| Market | Headline size, growth and global demand | Segment, region, trade and price forecast tables |
| Suppliers and buyers | Supplier types and sourcing hubs | Named suppliers and buyers |
Whey Protein project report: FAQs
How much does it cost to set up a whey protein plant?
How much whey is needed to make 1 kg of whey protein concentrate?
What profit margin can a whey protein plant earn?
What is the difference between WPC80 and whey protein isolate?
Which licenses does a whey protein plant need?
What happens to permeate from a whey protein plant?
Should a whey protein plant be built next to a cheese plant?

About the analyst
Priyanka Mor, Senior Consultant
Senior Consultant at Credence Research Inc directing strategic market advisory, cross-border commercial due diligence and enterprise intelligence frameworks for global B2B clients. Combines quantitative modeling with executive advisory, translating macroeconomic variables and supply chain data into go-to-market blueprints, M&A screenings and competitive war-gaming strategies.
Related market research
- Whey Protein Ingredients Market Size, Growth and Forecast 2032
- Whey Protein Concentrate Market Size, Share and Forecast 2032
- Isolate Whey Protein Market Size, Share and Forecast 2032
- Microparticulated Whey Protein Market Size, Share and Forecast 2032
- Acidified Whey Protein Market Size, Growth and Forecast 2032
- Dairy Ingredients Market Size, Growth, Share and Forecast 2032
More plant project reports
- Ice Cream Cone Manufacturing Plant Project Report (DPR) 2026
- Soda Water Manufacturing Plant Project Report (DPR) 2026
- Garlic Powder Manufacturing Plant Project Report (DPR) 2026
- Extruded Snacks Manufacturing Plant Project Report (DPR) 2026
- Bread Manufacturing Plant Project Report (DPR) 2026
- Chocolate Manufacturing Plant Project Report (DPR) 2026