
Quick answer
A soda water plant treats potable water, adds minerals, chills and carbonates it, then fills it under pressure into PET bottles or cans. This overview models a greenfield plant with one 12,000-bottle-an-hour PET line, with estimated CapEx of USD 4.5–17 million depending on equipment origin and cost region. Gross margin at commodity prices is estimated at 35–55%, and payback at 4–8 years for a plant in a lower-cost region.
Viable where a filler can be kept busy with private-label or mixer contracts, but packaging costs and thin commodity prices punish a high-cost site without a brand.
Soda Water plant: key highlights
| Parameter | Indicative value | Note |
|---|---|---|
| Plant capacity | 12,000 bottles an hour (500 mL PET) | 57.6 million bottles a year at nameplate; about 43 million sold at 75% utilization, or 21.6 million liters |
| Total CapEx | USD 4.5–17 million | Low end Asian-built line in an Asian park; top end European-built line on a U.S. or EU site; excludes working capital |
| Raw material share of operating cost | 50–60% | PET preforms, closures, labels, film and CO2; the water itself costs little |
| Gross margin | 35–55% | After packaging, CO2, utilities and direct conversion, at commodity prices |
| Payback period | 4–8 years | Lower-cost region, including about a year of ramp-up |
| IRR | Available in report | Post-tax, 10-year model |
| Break-even | Available in report | Capacity utilization basis |
Ranges assume one 12,000-bottle-an-hour PET line, 500 mL bottles, 16-hour days, 300 days, 75% utilization and 2026 prices. Ex-factory price of USD 0.10–0.13 a bottle, packaging, CO2, land and building rates are assumed, informed by 2024 Comtrade export unit values. Converted at about 17.8 rand, 0.92 euro, 0.74 pound and 88 rupees per USD (assumed). The full report can be customized to any country or region.
What is soda water?
Soda water is potable water charged with carbon dioxide under pressure, usually with small additions of mineral salts such as sodium bicarbonate, potassium bicarbonate or sodium citrate that give it a faintly salty, rounded taste. Seltzer is the same drink without added minerals, and club soda is the name used for mineralized mixer grades. Sparkling mineral water comes from a recognized spring, so it falls under separate source-water rules.
Unsweetened, unflavored soda water is classified under Harmonized System subheading 2201.10, mineral waters and aerated waters, within heading 2201. Once sugar, sweetener or flavor is added, the product moves to heading 2202, where tonic water and flavored sparkling drinks sit.
Buyers include supermarkets and their private-label programs, bars, hotels and caterers that need a neutral mixer, and consumers swapping sweetened soft drinks for zero-calorie fizz. Carbonation level is the main quality lever. Mixer grades are filled at about 3.5–4.5 volumes of CO2, or roughly 7–9 grams per liter, so the bubbles survive dilution with spirits and ice.
Soda water market overview and global demand
Credence Research values the global carbonated bottled water market at about USD 35.4 billion in 2025, a figure derived from its USD 32.5 billion for 2024 and a 9% CAGR. Its wider carbonated beverage study puts all fizzy drinks at USD 456.2 billion for 2024, with a 5.3% CAGR. Plain sparkling water is a small but fast-growing slice of that total, gaining share as sugar taxes push buyers away from sweetened colas.
Trade data show where packaged water travels, although subheading 2201.10 mixes still mineral water with sparkling products. UN Comtrade reporters recorded 2024 exports of about USD 4.5 billion and 10.9 million tonnes. France led with USD 1.83 billion, followed by Italy at USD 0.96 billion, reflecting the export reach of brands such as Perrier and S.Pellegrino. Belgium, Mexico, Georgia, Germany, China and the United States followed. The United States was the largest importer at about USD 836 million, ahead of France, the United Kingdom, Germany, Belgium, the Netherlands and China.
Unit values explain the business model. France shipped at about USD 0.37 per kilogram, Germany at USD 0.26 and China at USD 0.21, while Mexico and the United States averaged USD 0.86 and USD 0.61, levels that point to branded packs. Because water is heavy and cheap, most soda water is drunk within a few hundred kilometers of the filler. A new plant should therefore be sized for a regional market, not for export.
Soda water manufacturing process
The modeled plant draws municipal or well water, treats it to a consistent standard, carbonates it cold and fills it on one integrated PET line. Every step affects how long the bubbles last on a store shelf.
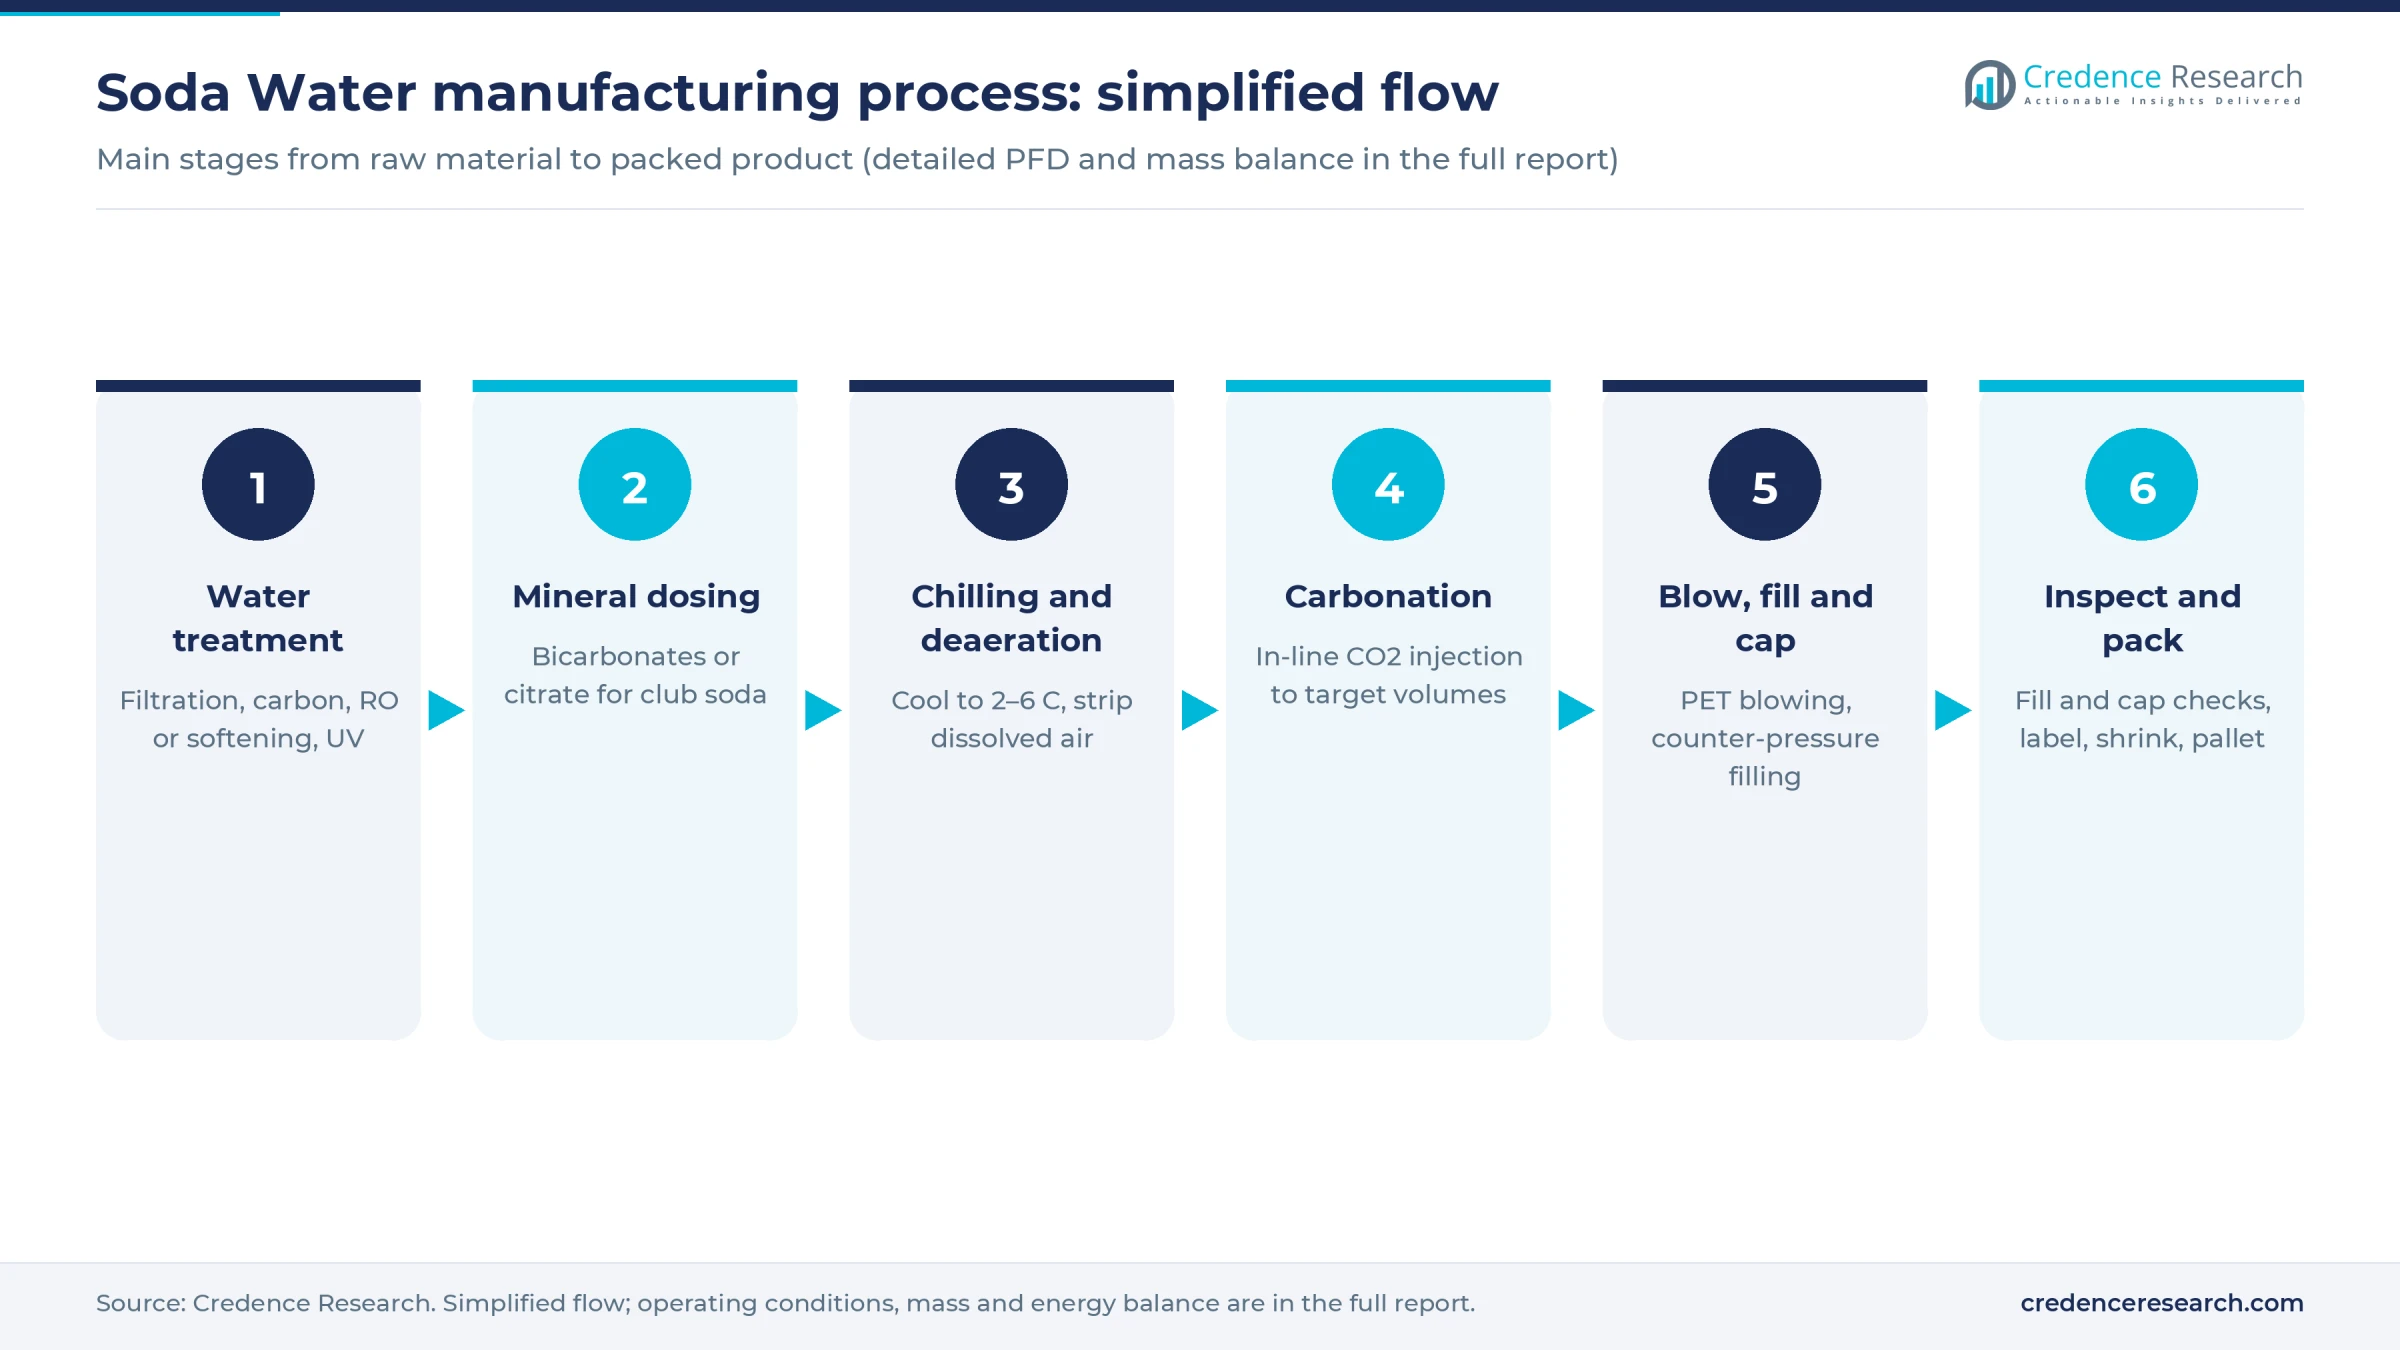
- Water treatment. Raw water passes through sand or multimedia filters, activated carbon to remove chlorine and taste, and softening or reverse osmosis to fix total dissolved solids. A UV unit and fine cartridge filters protect against microbes before storage in stainless tanks.
- Mineral dosing. For club soda, a metered solution of sodium and potassium bicarbonates or citrate is dosed in-line. Seltzer skips this step, which is why one line can run both products.
- Chilling and deaeration. A plate heat exchanger cools the water to about 2–6 degrees Celsius, because cold water holds far more CO2. Removing dissolved air first prevents foaming and fill-level variation.
- Carbonation. An in-line carbonator or carbo-cooler injects food-grade CO2 to the target volumes, with a meter checking content continuously.
- Blowing, filling and capping. A stretch blow molder forms bottles from preforms. A combined rinser, isobaric counter-pressure filler and capper then fills without losing gas. Cans need a seamer instead.
- Inspection and packing. Fill-level and cap-torque inspectors reject faulty units before coding, labeling, shrink wrapping and palletizing.
Quality control centers on CO2 volumes, cap seal and microbiology. Each shift samples carbonation with a shake-and-read tester, and retained bottles are checked for gas loss over the planned shelf life, often six to 12 months for PET. Exact treatment designs, mineral recipes and line balances are in the full report.
Soda water plant setup cost
This overview models a greenfield plant with one PET line rated at 12,000 bottles of 500 mL an hour, or 57.6 million bottles a year over 16-hour days and 300 days. At 75% utilization it sells about 43 million bottles, or 21.6 million liters. Estimated CapEx is USD 4.5–17 million before working capital, a wide band driven by where the machinery is built and where the plant stands.
The top of the range rests on disclosed bottling line investments by large producers. Czech maker Mattoni 1873 spent more than EUR 8.2 million on a turnkey line filling up to 20,000 cans an hour for its mineral water ranges, including building conversions. Coca-Cola Beverages Africa put R365 million, about USD 20.5 million, into a 72,000-bottle-an-hour water and sports drink line in South Africa in July 2025. Varun Beverages reported USD 12 million for a 24,000-bottle-an-hour water line in Zimbabwe in 2021. Scaled to 12,000 bottles an hour with a standard capacity exponent, these give USD 6.4–7.6 million for a European-grade line. A greenfield U.S. or EU plant adds buildings, land and utilities, which lifts the total to about USD 13–17 million.
The floor reflects Asian-built equipment, which costs far less. An Indian supplier lists a 200-bottle-a-minute soda filler at 4.2 million rupees, about USD 48,000, and a complete Asian line with blow molder, packing and water treatment is assumed at USD 1.2–1.8 million, giving about USD 4.5 million in all.
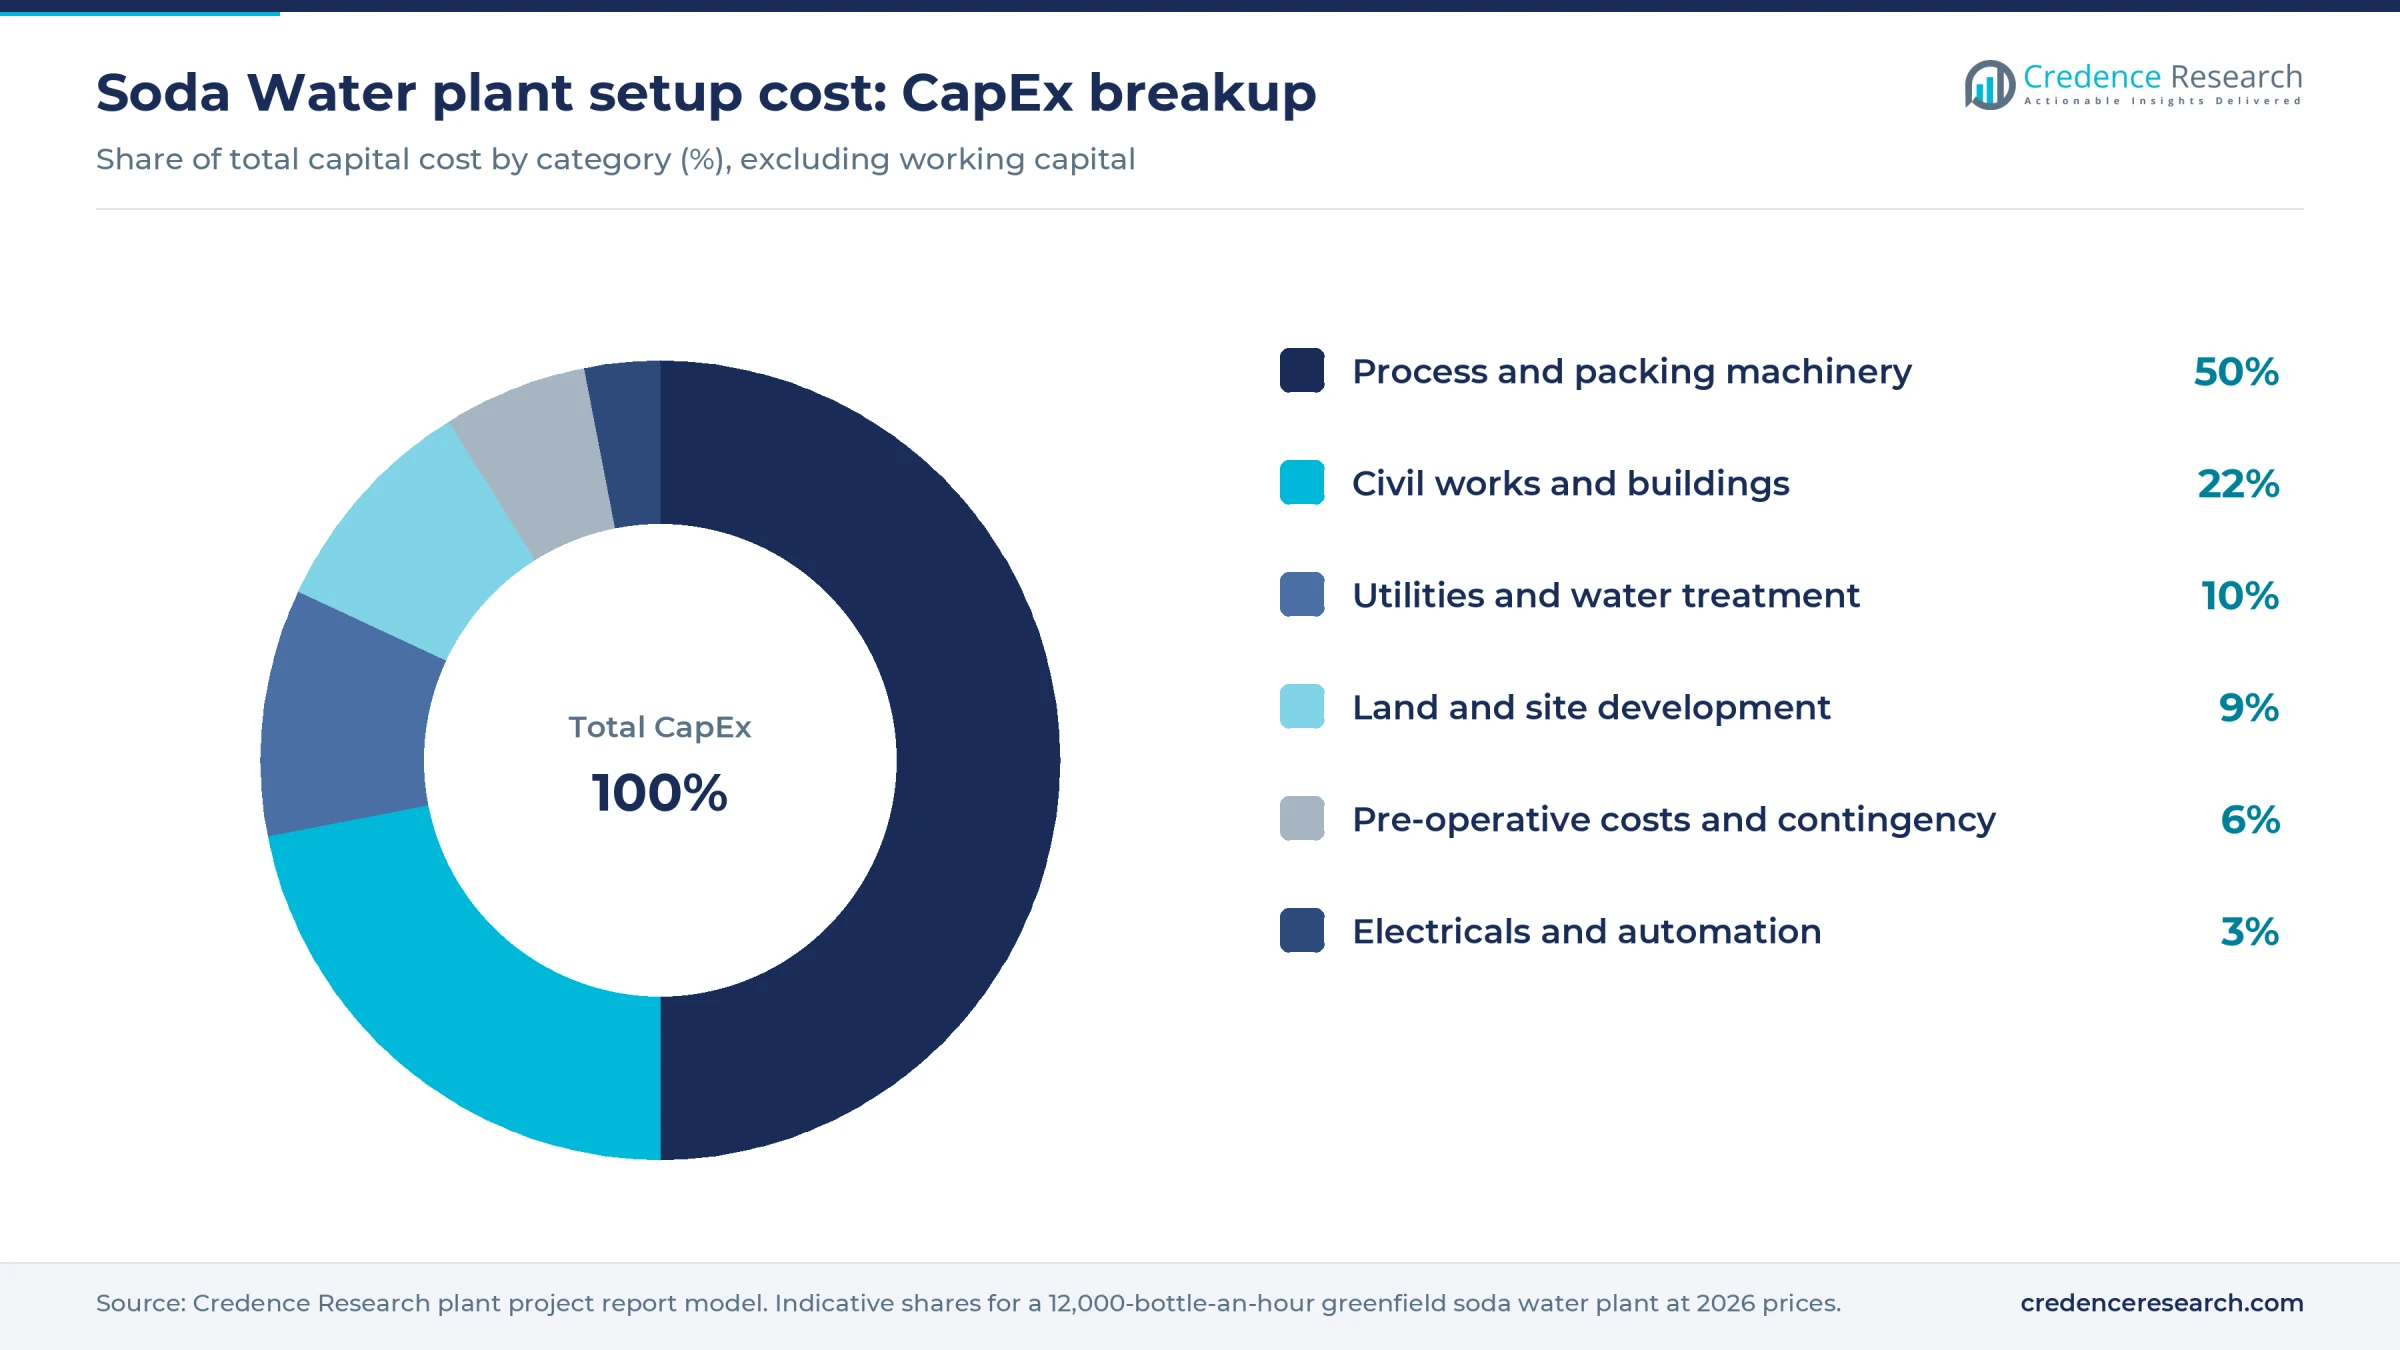
Worked example, land and site development. The plant needs an assumed 15,000 square meters, mostly for finished-goods storage, since soda water is bulky. At an assumed USD 30–60 per square meter in an Asian industrial park, land costs about USD 0.45–0.9 million, and at an assumed USD 40–80 at a U.S. or EU site, about USD 0.6–1.2 million. Site works add an assumed USD 0.2–0.3 million, so this row runs about 9–14% of CapEx.
Working capital is modest, an estimated USD 0.6–1.2 million, covering receivables and packaging stock.
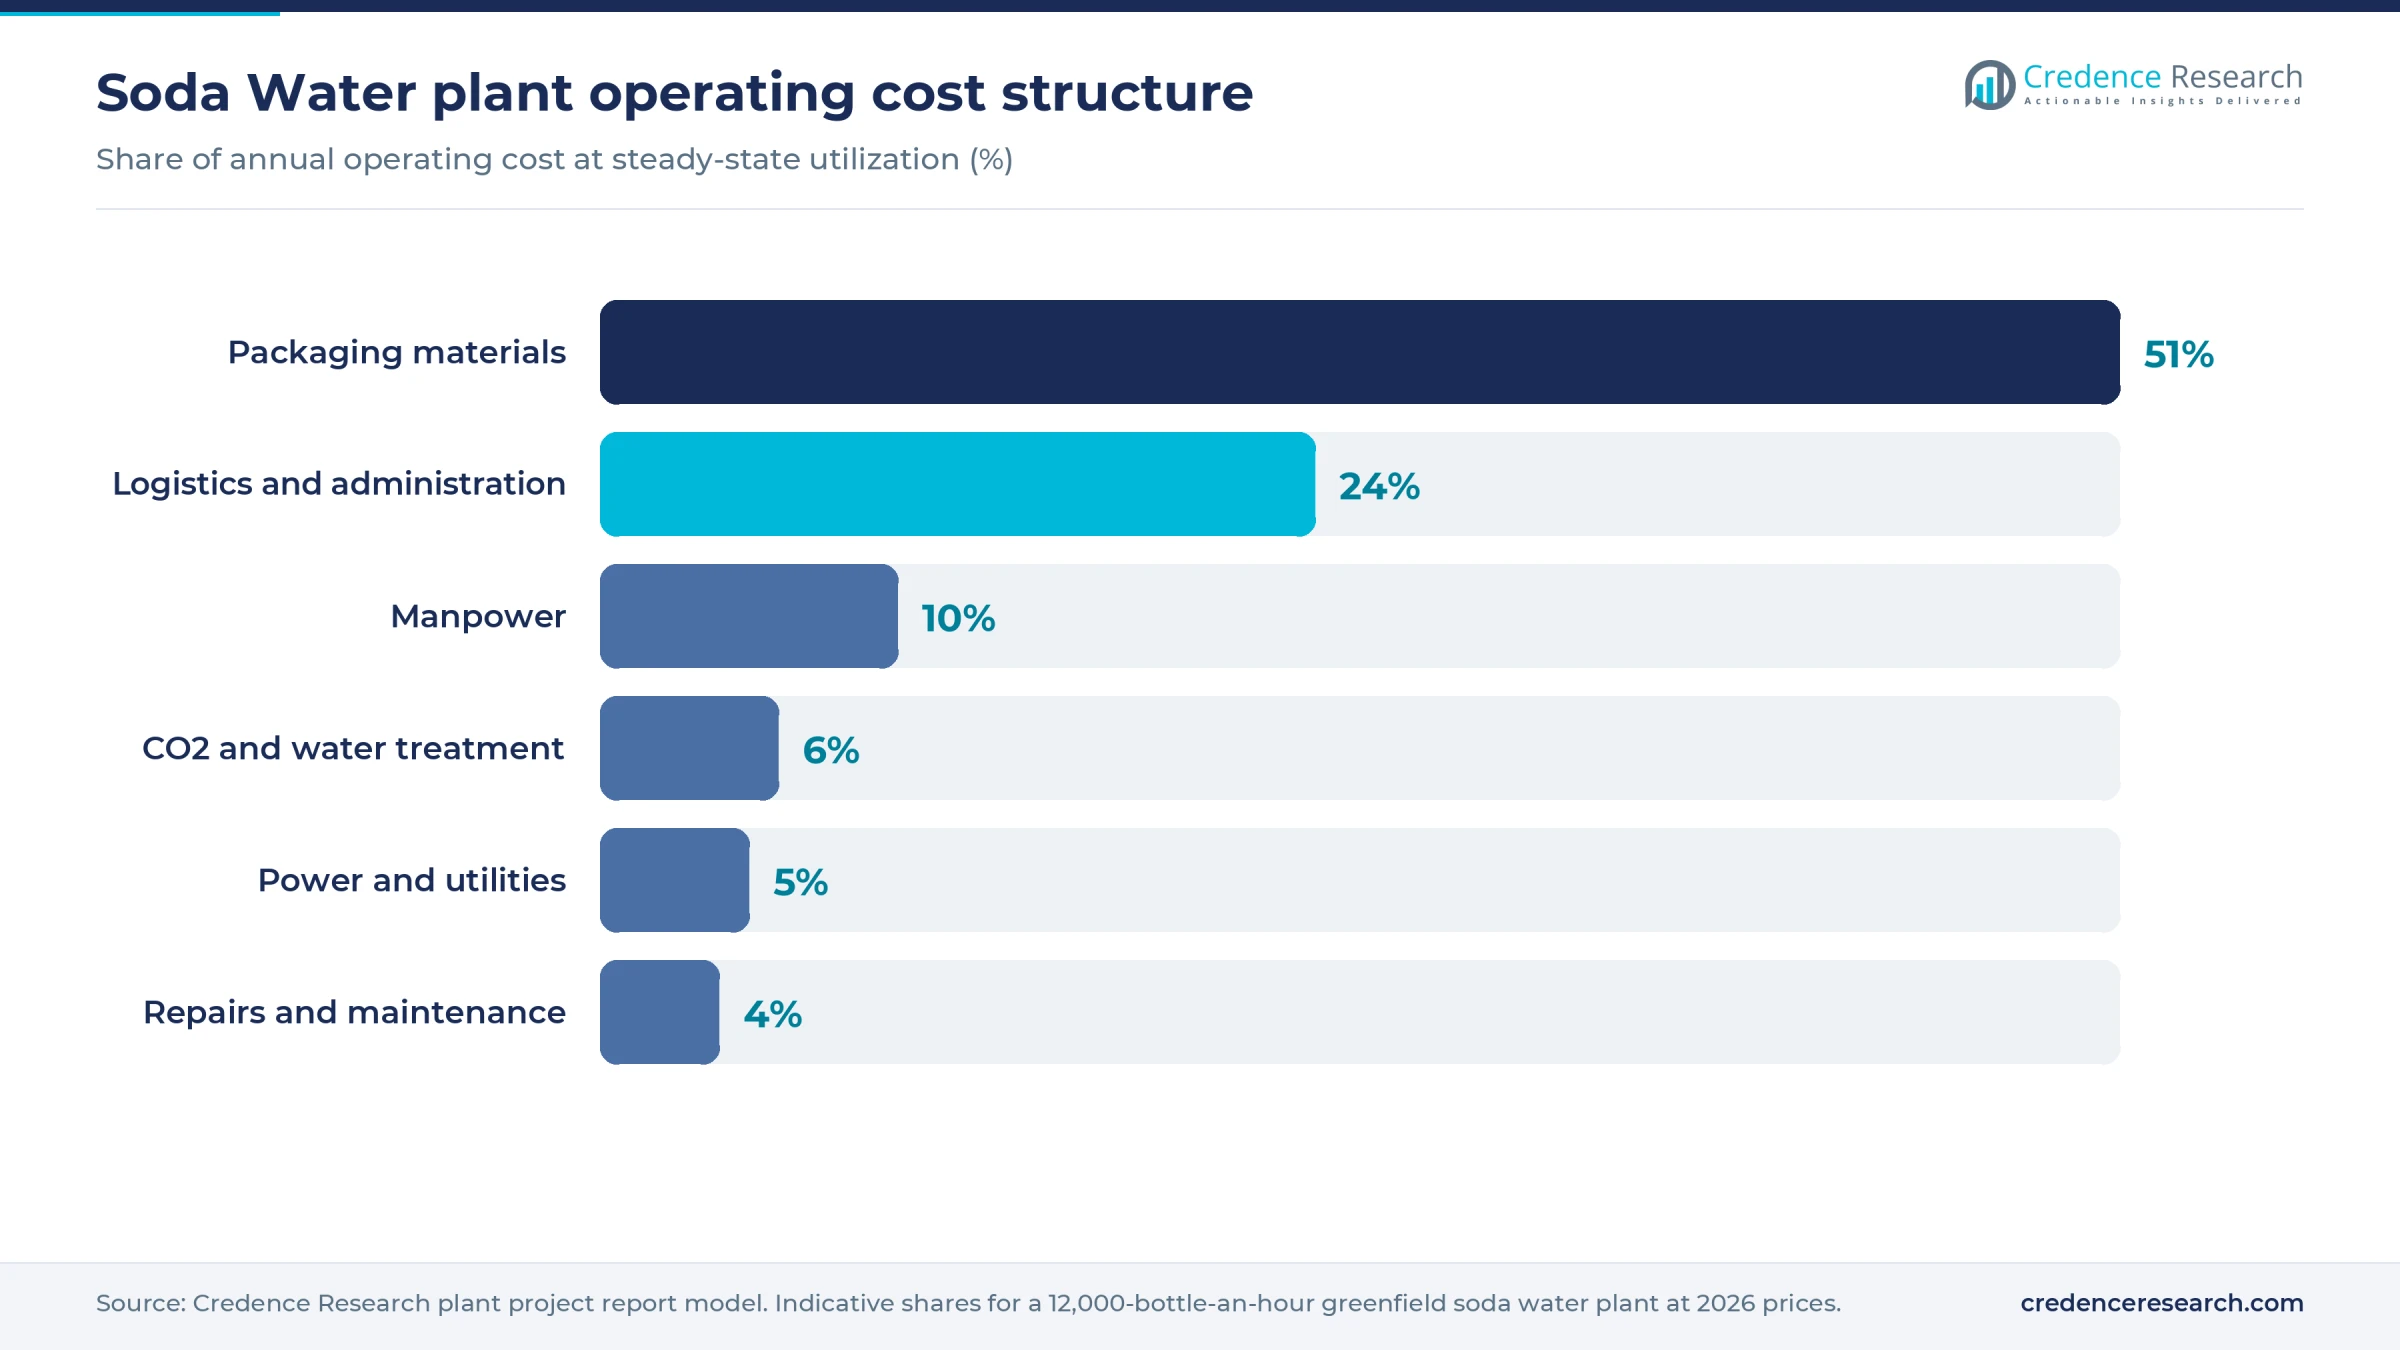
Packaging dominates running costs, ahead of logistics and administration. The full report can be customized to any country or region, and line-item budgets remain there.
Machinery and raw materials for a soda water plant
Core machinery includes raw water pumps and storage, multimedia and activated carbon filters, a softener or reverse osmosis unit, UV sterilizer, a mineral dosing skid, a deaerator, a plate chiller with glycol or ammonia refrigeration, and an in-line carbonator. The bottling side needs a preform hopper and stretch blow molder, an air conveyor, a rinser-filler-capper monobloc rated for carbonated products, fill-level and cap inspection, a labeler, inkjet or laser coder, shrink wrapper and palletizer. Utilities cover high- and low-pressure air compressors, a CO2 storage tank with vaporizer, a cleaning-in-place skid and a small effluent system for backwash and rinse water.
Water is the cheapest input, so raw material strategy is really about packaging and gas. PET resin comes mainly from large producers in China, the United States, Saudi Arabia, India, Thailand and South Korea, and most small plants buy finished preforms from regional converters rather than molding their own. Aluminum cans come from can makers in North America, Europe, Brazil, the Middle East and Asia. Food-grade CO2 is mostly recovered from ammonia plants, ethanol and brewery fermentation, and natural gas processing, so supply concentrates around fertilizer and biofuel hubs in the U.S. Midwest, Europe, Brazil and India, as the industrial carbon dioxide market analysis shows. European shortages in 2022, when fertilizer plants shut on gas prices, showed that bottlers need two CO2 suppliers or on-site storage for several days of use.
Soda water business profit margin and ROI
Estimated gross margin is 35–55% after packaging, CO2, water treatment, utilities and direct labor. The model assumes an ex-factory price of USD 0.10–0.13 per 500 mL bottle, or USD 0.20–0.26 a liter, toward the low end of 2024 Comtrade export unit values for high-volume exporters such as China, Germany and France. Direct costs are assumed at USD 0.050–0.069 a bottle, with preforms, closures, labels and film making up about two-thirds.
That margin looks generous next to many food products, but it sits before freight and selling costs, which are heavy for a low-value, high-weight drink. Overheads, sales support and outbound logistics take an assumed USD 0.6–1 million a year.
Payback is an estimated 4–8 years, including about a year of ramp-up, for a plant costing USD 4.5–9 million in a lower-cost region, on post-tax cash profit of about USD 1.3–1.95 million a year. A U.S. or EU plant at USD 13–17 million needs branded or premium mixer pricing near USD 0.20 a bottle to earn a similar 6–7 year payback. At commodity prices it would take well over 10 years.
Each USD 150 per tonne rise in PET resin cuts gross margin by about 2 percentage points unless contracts pass it through.
| Metric | Value |
|---|---|
| IRR | Available in report |
| NPV | Available in report |
| ROI | Available in report |
| DSCR | Available in report |
How to start a soda water business, licenses and approvals
A soda water plant needs approvals in six areas wherever it is built. These are business and tax registration; land use, zoning and building permits; an environmental permit covering wastewater from filter backwash and rinsing, plus water abstraction rights if the plant uses wells; occupational safety, including pressure vessel, compressed gas and confined-space rules for CO2; food facility registration or licensing with product standards and labeling; and customs registration for traded inputs and exports. Carbonated water is generally treated as a soft drink, not natural mineral water, which simplifies approvals.
| Market | Food product | Environment, safety and trade |
|---|---|---|
| United States | FDA food facility registration; preventive controls and current good manufacturing practice under 21 CFR Part 117; the bottled water standard in 21 CFR 165.110 treats soda water and seltzer separately from bottled water; labeling under 21 CFR Part 101 | Local wastewater discharge or pretreatment permit; state stormwater and well permits where needed; OSHA standards, including compressed gas safety |
| European Union | Food business registration under Regulation (EC) No 852/2004; process water meeting Directive (EU) 2020/2184; carbon dioxide (E 290) meeting Regulation (EU) No 231/2012 purity rules; labeling under Regulation (EU) No 1169/2011 | National environmental and water abstraction permits; plastics in contact with food under Regulation (EU) No 10/2011; packaging rules under Regulation (EU) 2025/40 |
| India | FSSAI license, state or central by scale; carbonated water standard under regulation 2.10.6 of the 2011 food product standards; Legal Metrology packer registration | State pollution control board consents to establish and operate; Central Ground Water Authority clearance for borewells; factory license; Import Export Code for trade |
Retail buyers commonly also ask for FSSC 22000 or BRCGS certification. Requirements vary locally, and the full report lists the steps for a chosen country.
Key soda water manufacturers and recent developments
Nestle's Perrier and S.Pellegrino, Danone's Badoit, Gerolsteiner and Mattoni 1873 lead European sparkling water. In North America, the main names are The Coca-Cola Company with Topo Chico, PepsiCo with bubly and SodaStream, Keurig Dr Pepper with Canada Dry and Schweppes club soda, National Beverage with LaCroix, Polar Beverages and Talking Rain. Fever-Tree is a leading premium mixer brand, while IDS Borjomi in Georgia and Kizilay in Turkey export naturally sparkling waters. Investors comparing premium formats can review the premium bottled water study.
- July 2026. Nestle agreed to move its waters business, including Perrier and S.Pellegrino, into a 50-50 joint venture with Platinum Equity, called Peranel and based in Paris, with closing expected in the first half of 2027.
- January 2026. UK brand Re:Water said it would invest GBP 2 million in a Herefordshire site five times larger than its old base, scaling spring and sparkling water in aluminum bottles.
These moves show brand ownership shifting, while smaller sparkling brands invest in their own filling capacity.
What's inside the Soda Water project report PDF
The report runs to 21 chapters. Open a chapter to see its sections.
1. Preface
2. Scope and Methodology
- 2.1 Objectives of the Study
- 2.2 Stakeholders
- 2.3 Research Methodology
- 2.4 Data Sources and Key Assumptions
3. Executive Summary
- 3.1 Market Snapshot
- 3.2 Project at a Glance (Capacity, CapEx, OpEx)
- 3.3 Key Financial Indicators (IRR, NPV, Payback, Break-even)
- 3.4 Feasibility Verdict
4. Product Overview
- 4.1 Soda Water Definition and Properties
- 4.2 Grades and Specifications (BIS / ISO / ASTM)
- 4.3 HS Code and Classification
- 4.4 Key Applications
- 4.5 Substitutes
5. Global Soda Water Market
- 5.1 Market Overview
- 5.2 Historical and Current Market Performance (Volume and Value)
- 5.3 Market Breakup by Grade / Type
- 5.4 Market Breakup by End-Use Industry
- 5.5 Market Breakup by Region
- 5.6 Market Drivers, Restraints and Trends
- 5.7 Value Chain Analysis
- 5.8 Market Forecast
6. Target Country Soda Water Market Analysis
- 6.1 Demand and Supply Analysis
- 6.2 Installed Capacity vs Demand Gap
- 6.3 Import Dependence
- 6.4 Demand Forecast by End-Use
7. Trade Analysis
- 7.1 Imports by Volume, Value and Country
- 7.2 Exports by Volume, Value and Country
- 7.3 Trade Balance and Opportunities
8. Price Analysis
- 8.1 Historical Soda Water Price Trends by Region
- 8.2 Raw Material / Feedstock Price Trends and Linkage
- 8.3 Price Forecast
- 8.4 Margins Across the Value Chain
9. Competitive Landscape
- 9.1 Market Structure
- 9.2 Key Players and Installed Capacities
- 9.3 Profiles of Key Players
- 9.4 Recent Developments (Expansions, M&A, New Plants)
10. Manufacturing Process and Technology
- 10.1 Comparison of Technology Routes
- 10.2 Selected Route and Process Flow Diagram
- 10.3 Unit Operations Involved
- 10.4 Chemical Reactions Involved
- 10.5 Mass Balance and Raw Material Requirements
- 10.6 Energy Balance
- 10.7 Quality Assurance Criteria and Technical Tests
- 10.8 By-products and Waste Handling
- 10.9 Technology Licensors / Providers
11. Project Details, Requirements and Costs
- 11.1 Land, Location and Site Development
- 11.1.1 Site Selection Criteria
- 11.1.2 Location Analysis
- 11.1.3 Land Requirement and Costs
- 11.1.4 Site Development Costs
- 11.2 Plant Layout
- 11.2.1 Layout Principles
- 11.2.2 Proposed Layout
- 11.2.3 Factors Influencing Layout
- 11.3 Civil Works and Buildings
- 11.4 Plant Machinery
- 11.4.1 Machinery Requirements and Specifications
- 11.4.2 Machinery Costs
- 11.4.3 Machinery Suppliers
- 11.5 Raw Materials
- 11.5.1 Requirements per Tonne of Output
- 11.5.2 Procurement and Sourcing
- 11.5.3 Costs
- 11.5.4 Suppliers
- 11.6 Packaging
- 11.6.1 Packaging Requirements
- 11.6.2 Packaging Costs
- 11.6.3 Packaging Suppliers
- 11.7 Storage and Material Handling
- 11.8 Transportation Requirements and Costs
- 11.9 Utilities
- 11.9.1 Power Requirements and Costs
- 11.9.2 Water Requirements and Costs
- 11.9.3 Steam, Fuel and Other Utilities
- 11.10 Manpower Requirements and Wages
12. Environment, Health, Safety and Sustainability
- 12.1 Effluent and Emissions Management
- 12.2 Hazard Classification and Safety Measures
- 12.3 Carbon Footprint
- 12.4 Green / Low-Carbon Process Options
13. Regulatory Procedures, Approvals and Certifications
- 13.1 Licences and Registrations
- 13.2 Environmental Clearances
- 13.3 Product Certifications (BIS, REACH, etc.)
- 13.4 Approval Timeline
14. Project Implementation Schedule
15. Project Economics
- 15.1 Capital Cost of the Project
- 15.2 Techno-Economic Parameters
- 15.3 Capacity Utilization and Ramp-up
- 15.4 Product Pricing and Margins
- 15.5 Income Projections
- 15.6 Expenditure Projections
- 15.7 Working Capital Requirement
- 15.8 Taxation
- 15.9 Depreciation
16. Financial Analysis
- 16.1 Projected Profit and Loss Account
- 16.2 Projected Cash Flow Statement
- 16.3 Projected Balance Sheet
- 16.4 Liquidity Analysis
- 16.5 Profitability Analysis (Payback, NPV, IRR, ROI)
- 16.6 Break-even Analysis
- 16.7 Debt Service Coverage Ratio (DSCR)
- 16.8 Sensitivity Analysis
- 16.9 Scenario and Uncertainty Analysis
17. Funding and Incentives
- 17.1 Means of Finance and Debt-Equity Structure
- 17.2 Loans and Financial Assistance
- 17.3 Government Schemes and Subsidies (PLI, State Policies)
18. Risk Assessment
- 18.1 Key Success Factors
- 18.2 Key Risk Factors
- 18.3 Risk Mitigation
19. Strategic Recommendations
20. Case Study of a Successful Venture
21. Appendix
- 21.1 Detailed Assumptions
- 21.2 Abbreviations
- 21.3 List of Tables and Figures
- 21.4 Sources
This page vs. the full report
| Data point | On this page (free) | In the full report |
|---|---|---|
| Total CapEx | One rounded range at one capacity | Exact figure at three capacities with a line-item breakup |
| CapEx breakup | Category shares (%) only | Cost, quantity and supplier for every machine |
| Operating cost | Share of raw materials, utilities and labor | Per-unit cost sheet with each input price and consumption |
| Profitability | Gross margin range and payback band | Exact IRR, NPV, ROI, break-even and DSCR |
| Financial statements | List of what is included | 10-year P&L, cash flow, balance sheet and Excel model |
| Sensitivity | One directional line | Full sensitivity and scenario tables |
| Process | Simplified flow diagram | Detailed process flow, mass and energy balance, operating conditions |
| Machinery | Names of the main machines | Specifications, capacity, cost and supplier list |
| Market | Headline size, growth and global demand | Segment, region, trade and price forecast tables |
| Suppliers and buyers | Supplier types and sourcing hubs | Named suppliers and buyers |
Soda Water project report: FAQs
How much does a soda water plant cost?
What is the profit margin in soda water manufacturing?
How long is the payback on a soda water plant?
What is the HS code for soda water?
What is the difference between soda water, seltzer and sparkling mineral water?
Why does CO2 supply matter for a soda water plant?
Does a soda water plant need bottled water approval in the United States?

About the analyst
Priyanka Mor, Senior Consultant
Senior Consultant at Credence Research Inc directing strategic market advisory, cross-border commercial due diligence and enterprise intelligence frameworks for global B2B clients. Combines quantitative modeling with executive advisory, translating macroeconomic variables and supply chain data into go-to-market blueprints, M&A screenings and competitive war-gaming strategies.
Related market research
- Carbonated Bottled Water Market Size, Share and Forecast 2032
- Carbonated Beverage Market Size, Trends, Share and Forecast 2032
- Premium Bottled Water Market Size, Share, Growth and Forecast 2032
- Industrial Carbon Dioxide Market Size, Growth and Forecast 2032
- Bottled Water Packaging Market Size, Share & Growth Report 2032
- PET Preform Machine Market Size, Growth and Forecast 2032
More plant project reports
- Ice Cream Cone Manufacturing Plant Project Report (DPR) 2026
- Garlic Powder Manufacturing Plant Project Report (DPR) 2026
- Extruded Snacks Manufacturing Plant Project Report (DPR) 2026
- Bread Manufacturing Plant Project Report (DPR) 2026
- Chocolate Manufacturing Plant Project Report (DPR) 2026
- Cheese Manufacturing Plant Project Report (DPR) 2026