
Quick answer
An ice cream cone plant mixes a thin wheat batter, bakes it in heated molds or between hot plates, then trims, coats and packs the cones. This overview models a greenfield plant making 200 million cones a year, with estimated CapEx of USD 3–11 million by region and equipment origin. Gross margin is estimated at 30–42%, before freight and overheads, with payback at 3–10 years. Packaging cost and seasonal demand decide the outcome.
Viable for operators with contracted dairy or foodservice volume and a regional freight advantage; a stand-alone entrant facing dominant incumbents and summer-only demand needs a low-cost build to pay back in time.
Ice Cream Cone plant: key highlights
| Parameter | Indicative value | Note |
|---|---|---|
| Plant capacity | 200 million cones a year | About 1,200 tonnes at an assumed 6 g average, from five automatic lines over 300 days of 20 hours |
| Total CapEx | USD 3–11 million | Greenfield, scaled from a disclosed Turkish cone plant and assumed equipment prices; excludes working capital |
| Raw material share of operating cost | 40–55% | Ingredients plus sleeves, trays and cartons; packaging costs nearly as much as the batter |
| Gross margin | 30–42% | At an assumed average ex-factory price of USD 0.025–0.040 per cone, before freight and overheads |
| Payback period | 3–10 years | At 80% utilization, including an assumed one-year ramp-up; a high-cost build with weak margins falls outside |
| IRR | Available in report | Post-tax, 10-year model |
| Break-even | Available in report | Capacity utilization basis |
Ranges assume a greenfield plant making 200 million cones a year at an assumed 6 g average, 300 operating days, 80% utilization and 2026 prices. Ex-factory prices of USD 0.025–0.040 per cone, ingredient and packaging costs, equipment prices for the low and high cases, and land rates are assumed. Euro figures use an assumed USD 1.15 per euro. CapEx excludes working capital. The full report can be customized to any country or region.
What is an ice cream cone?
An ice cream cone is a crisp, low-moisture baked shell that holds a serving of ice cream or frozen dessert and is eaten with it. Its dryness keeps it crunchy but makes it pull moisture from air and ice cream, so packaging and coatings matter almost as much as baking.
Three formats dominate the trade in cones. Molded cake or wafer cones are baked from a thin, low-sugar batter in closed molds, giving light, often flat-bottomed cones and cups. Rolled sugar cones and waffle cones use a sweeter batter baked flat on hot plates and rolled while still soft, which yields a darker, harder and heavier shell. Specialty lines add chocolate-sprayed interiors, gluten-free recipes and mini cones.
Plain wafer cones fall under Harmonized System subheading 1905.32, waffles and wafers, and U.S. Customs and Border Protection applied that subheading to imported wafer mini cones in a December 2025 ruling, while cones sold already filled with ice cream are classified with ice cream under heading 21.05. Buyers include ice cream parlors, foodservice distributors, supermarkets selling boxed cones for home use and dairies that fill sleeved cones.
Ice cream cone market overview and global demand
Cone demand rides on ice cream consumption. Credence Research values the global ice cream market at about USD 122 billion in 2025, based on its USD 117.2 billion for 2024 and a 4.1% CAGR through 2032. The wafer biscuits market, which shares batter, baking and packaging technology with cones, was valued at USD 40.37 billion in 2024, with a 3.39% CAGR forecast to 2032.
Trade data count cones within the wider wafer class. UN Comtrade-based figures for subheading 1905.32 show world exports of more than USD 6.5 billion in 2023, led by Poland at 15.8% and Italy at 12.6%, followed by Germany, Canada and Turkey. The U.S. took 16% of imports, ahead of the U.K., Germany, France and Saudi Arabia. Cones are bulky and fragile for their value, so most shipments stay within a region.
Supply is highly concentrated among a few bakers. Joy Baking Group makes more than 2 billion cones a year at four plants in the U.S. and Mexico, and Germany's Waffel Meyer reported group capacity of 3 billion units in 2021. Demand is strongly seasonal, peaking in spring and summer in temperate markets, so a new plant must either finance winter inventory or find year-round buyers in warm climates.
New entrants usually do better where packaged ice cream use is still expanding and imported cones carry long freight than in mature markets where incumbents hold dairy contracts.
Ice cream cone manufacturing process
A cone plant is a batter bakery built around hot molds or plates. Output depends on baking time per piece and the number of molds in the oven, while quality depends on batter consistency, oven temperature and how quickly finished cones are protected from humidity.
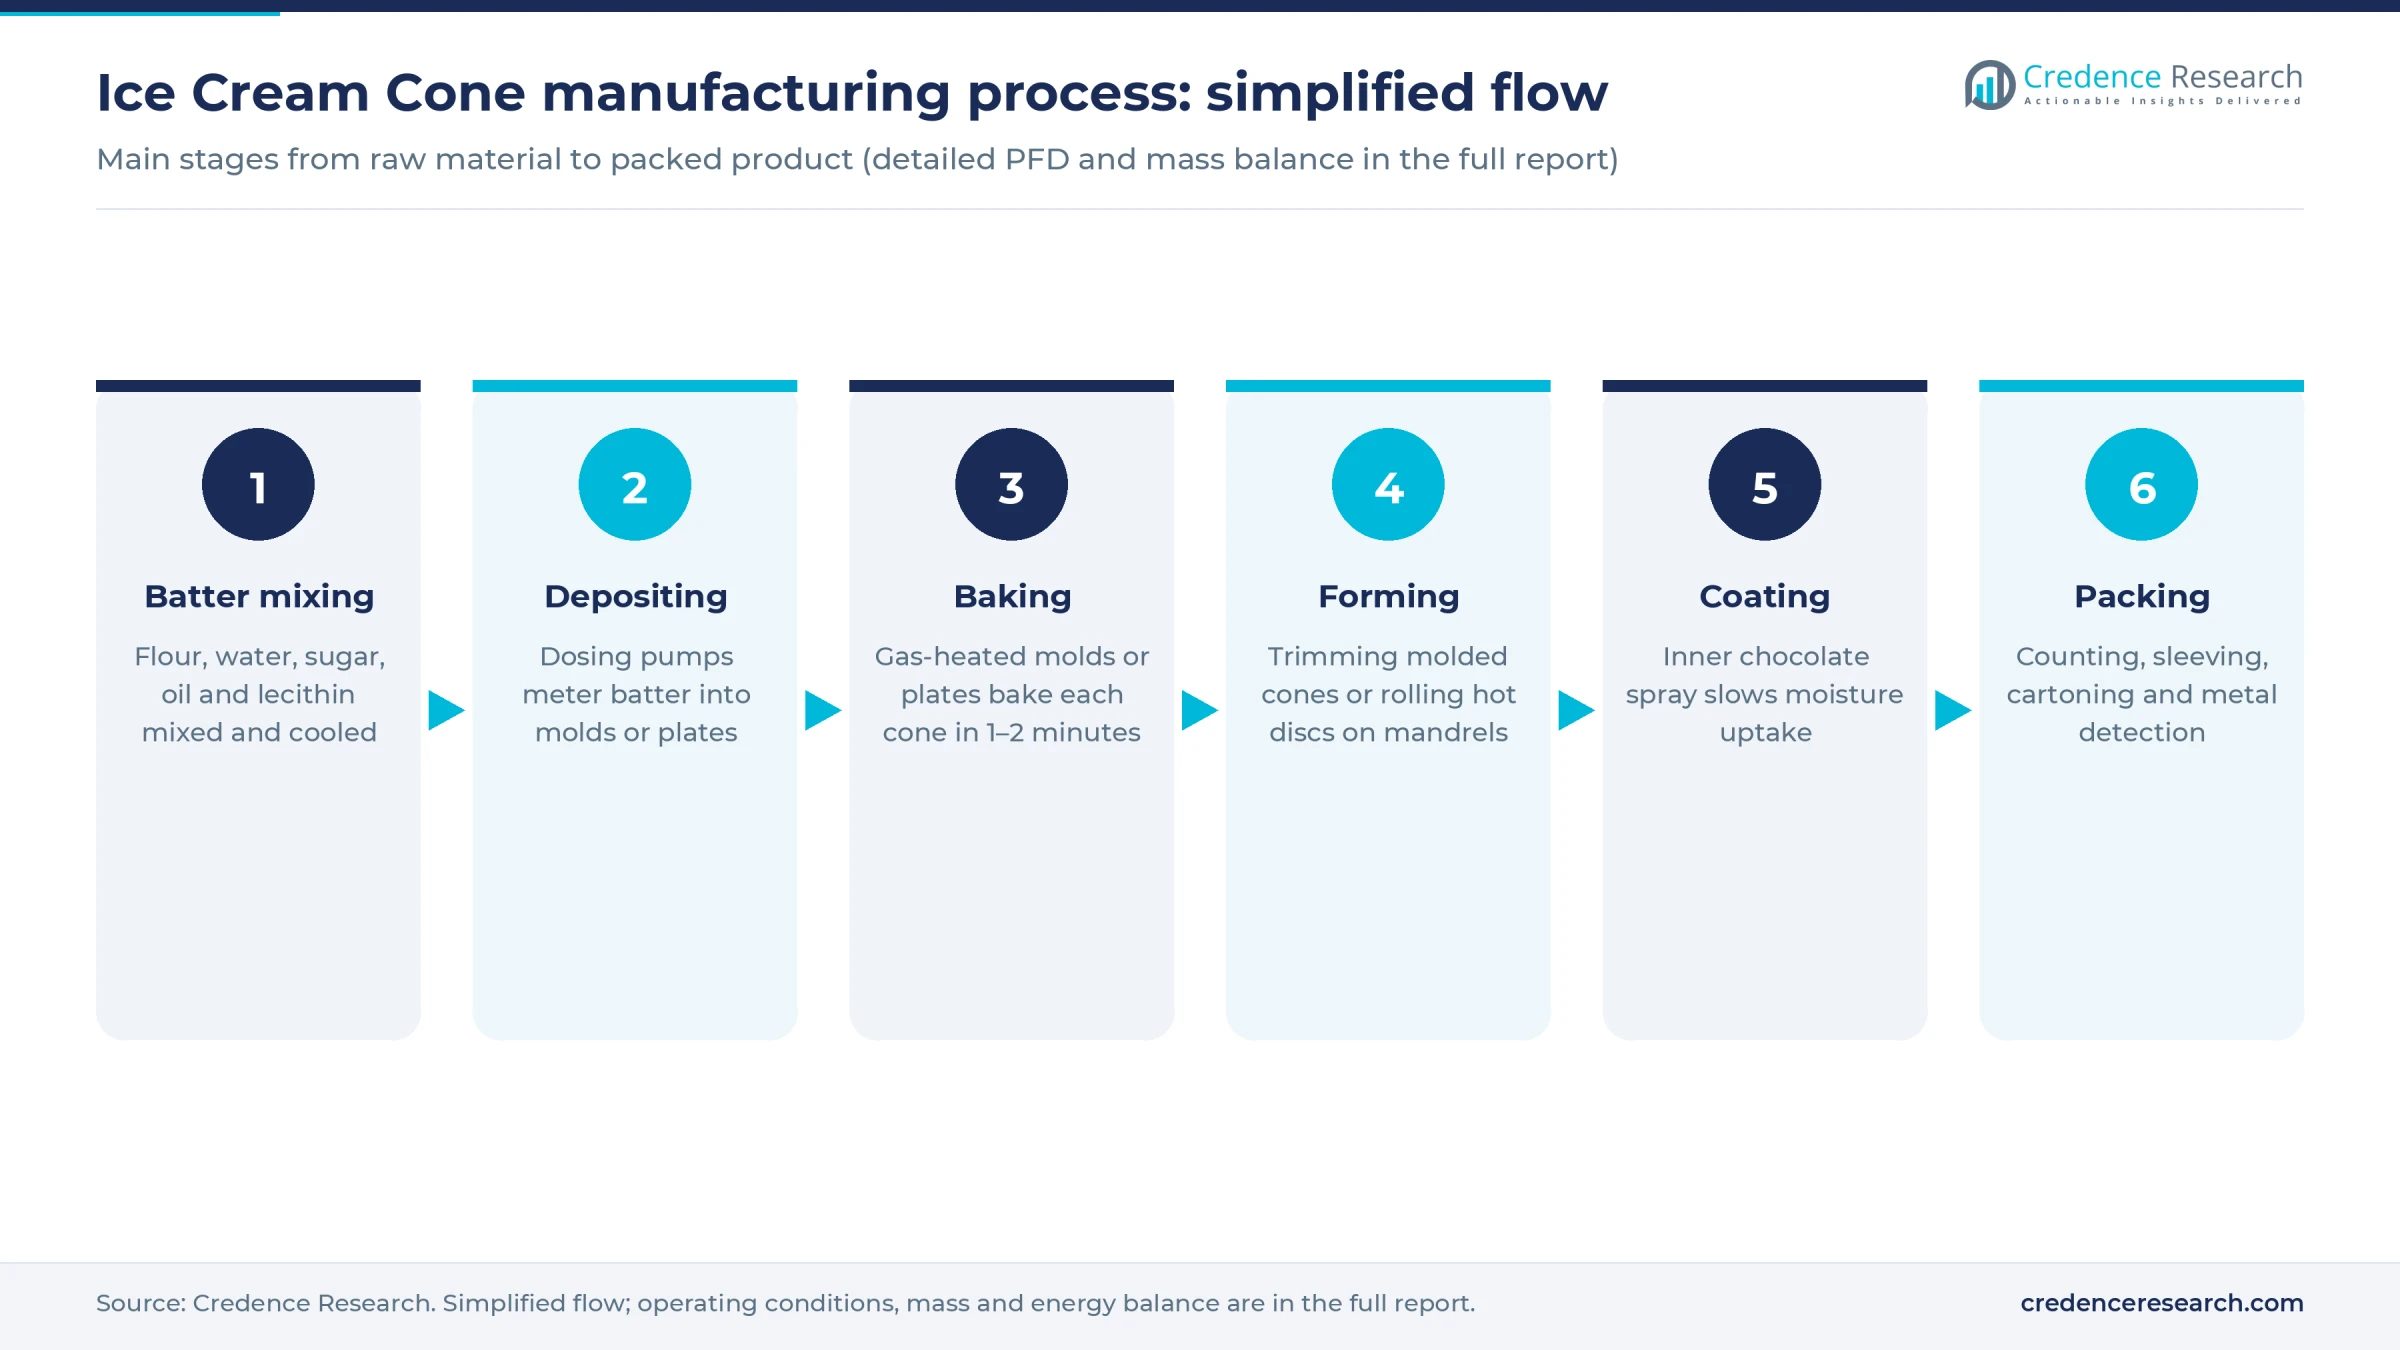
- Batter preparation. Soft wheat flour, water, sugar, vegetable oil, starch, lecithin and salt are mixed into a thin batter, often with flavor or color. Cake cone batter is low in sugar, while sugar and waffle cone batter carries far more. The batter is cooled and held in agitated tanks, and operators check its viscosity with a flow cup, since small changes alter cone weight.
- Depositing. Dosing pumps fill each mold or baking plate with a measured shot of batter.
- Baking. For molded cones, a gas-fired carousel closes a core into each mold, and the cone bakes in a minute or two while steam vents. For rolled cones, batter is pressed between gridded plates into a flat disc; one large U.S. line bakes each disc for 65 seconds.
- Forming and trimming. Molded cones are released, trimmed of excess edges and checked. Rolled discs are wrapped around a mandrel while still pliable and harden as they cool, within about two minutes.
- Coating. Cones destined for filled products are sprayed inside with a thin chocolate or fat layer that slows moisture migration from the ice cream.
- Counting and packing. Cones are counted, stacked, sleeved in printed paper for dairy fillers or bagged for retail, then cartoned and passed through metal detection.
Scrap is a constant cost for every line. Broken or misshapen cones run a few percent of output, and the same U.S. maker sells its 1% to 2% rejects as animal feed. A cone that absorbs moisture turns leathery, so packing rooms are kept dry. Seasonal demand means many plants build stock through winter, which needs dry warehousing and barrier packaging.
Ice cream cone plant setup cost
This overview models a greenfield plant making 200 million cones a year, a mix of molded cake cones and rolled sugar cones averaging an assumed 6 grams, or about 1,200 tonnes of product. That implies five automatic lines of roughly 6,000–7,000 cones an hour each, running 20 hours a day for 300 days. Estimated total CapEx is USD 3–11 million, depending on region and where the equipment is built.
The central estimate comes from Turkey, where Waffel Meyer invested about EUR 7 million in 2019 in a Bursa plant making about 300 million cones a year, along with crunch and wafer decorations. Scaled to 200 million cones with an assumed 0.7 power rule, escalated by an assumed 30% to 2026 and converted at an assumed USD 1.15 per euro, that comes to about USD 8 million. The low end reflects an Asian industrial park using Chinese-built automatic lines, with small units listed from about USD 20,000; five larger lines, mixing, coating, packing, a modest building and utilities are assumed to total about USD 3 million. The top reflects a U.S. or EU site with European-built lines, assumed at USD 1–1.4 million each.
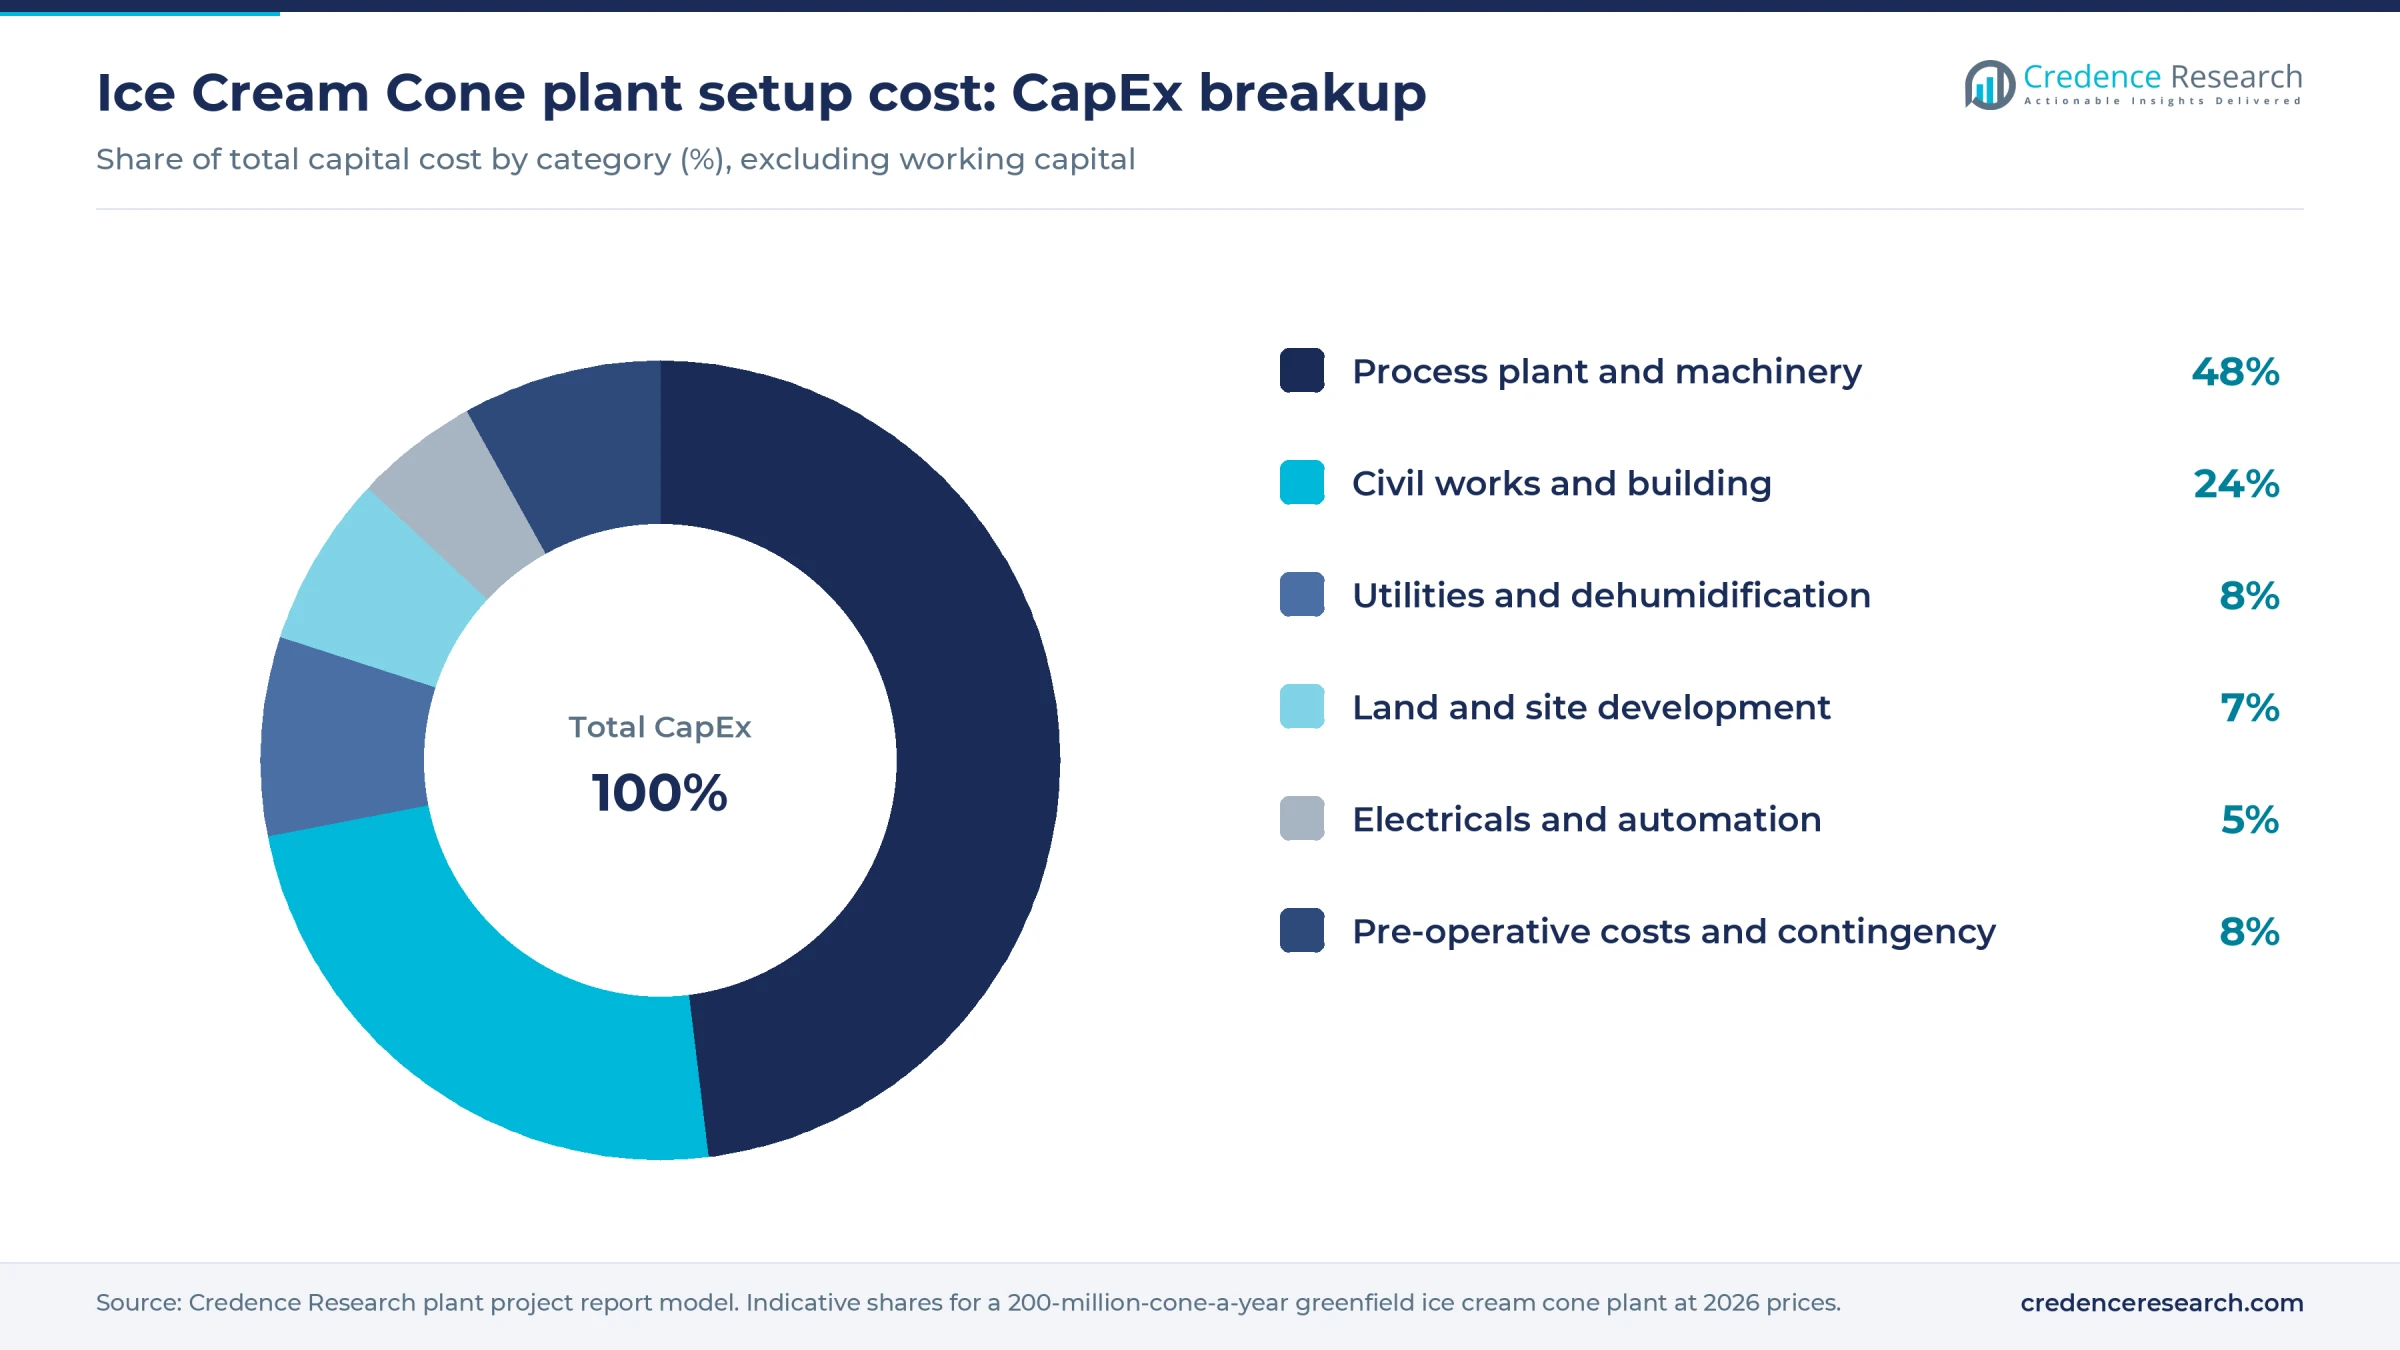
Worked example, land and site development. The plant needs an assumed 8,000–12,000 square meters, including a 4,000–6,000-square-meter building with dry storage. At an assumed USD 20–50 per square meter in an Asian industrial park, the plot costs about USD 160,000–600,000. At an assumed USD 30–80 at a U.S. or EU site, it costs about USD 240,000–960,000. Site works add an assumed USD 150,000–350,000, so this row usually runs 4–12% of CapEx.
Working capital adds an estimated USD 500,000–1 million. Stock built ahead of summer and 45-day terms with distributors and dairies drive most of it.
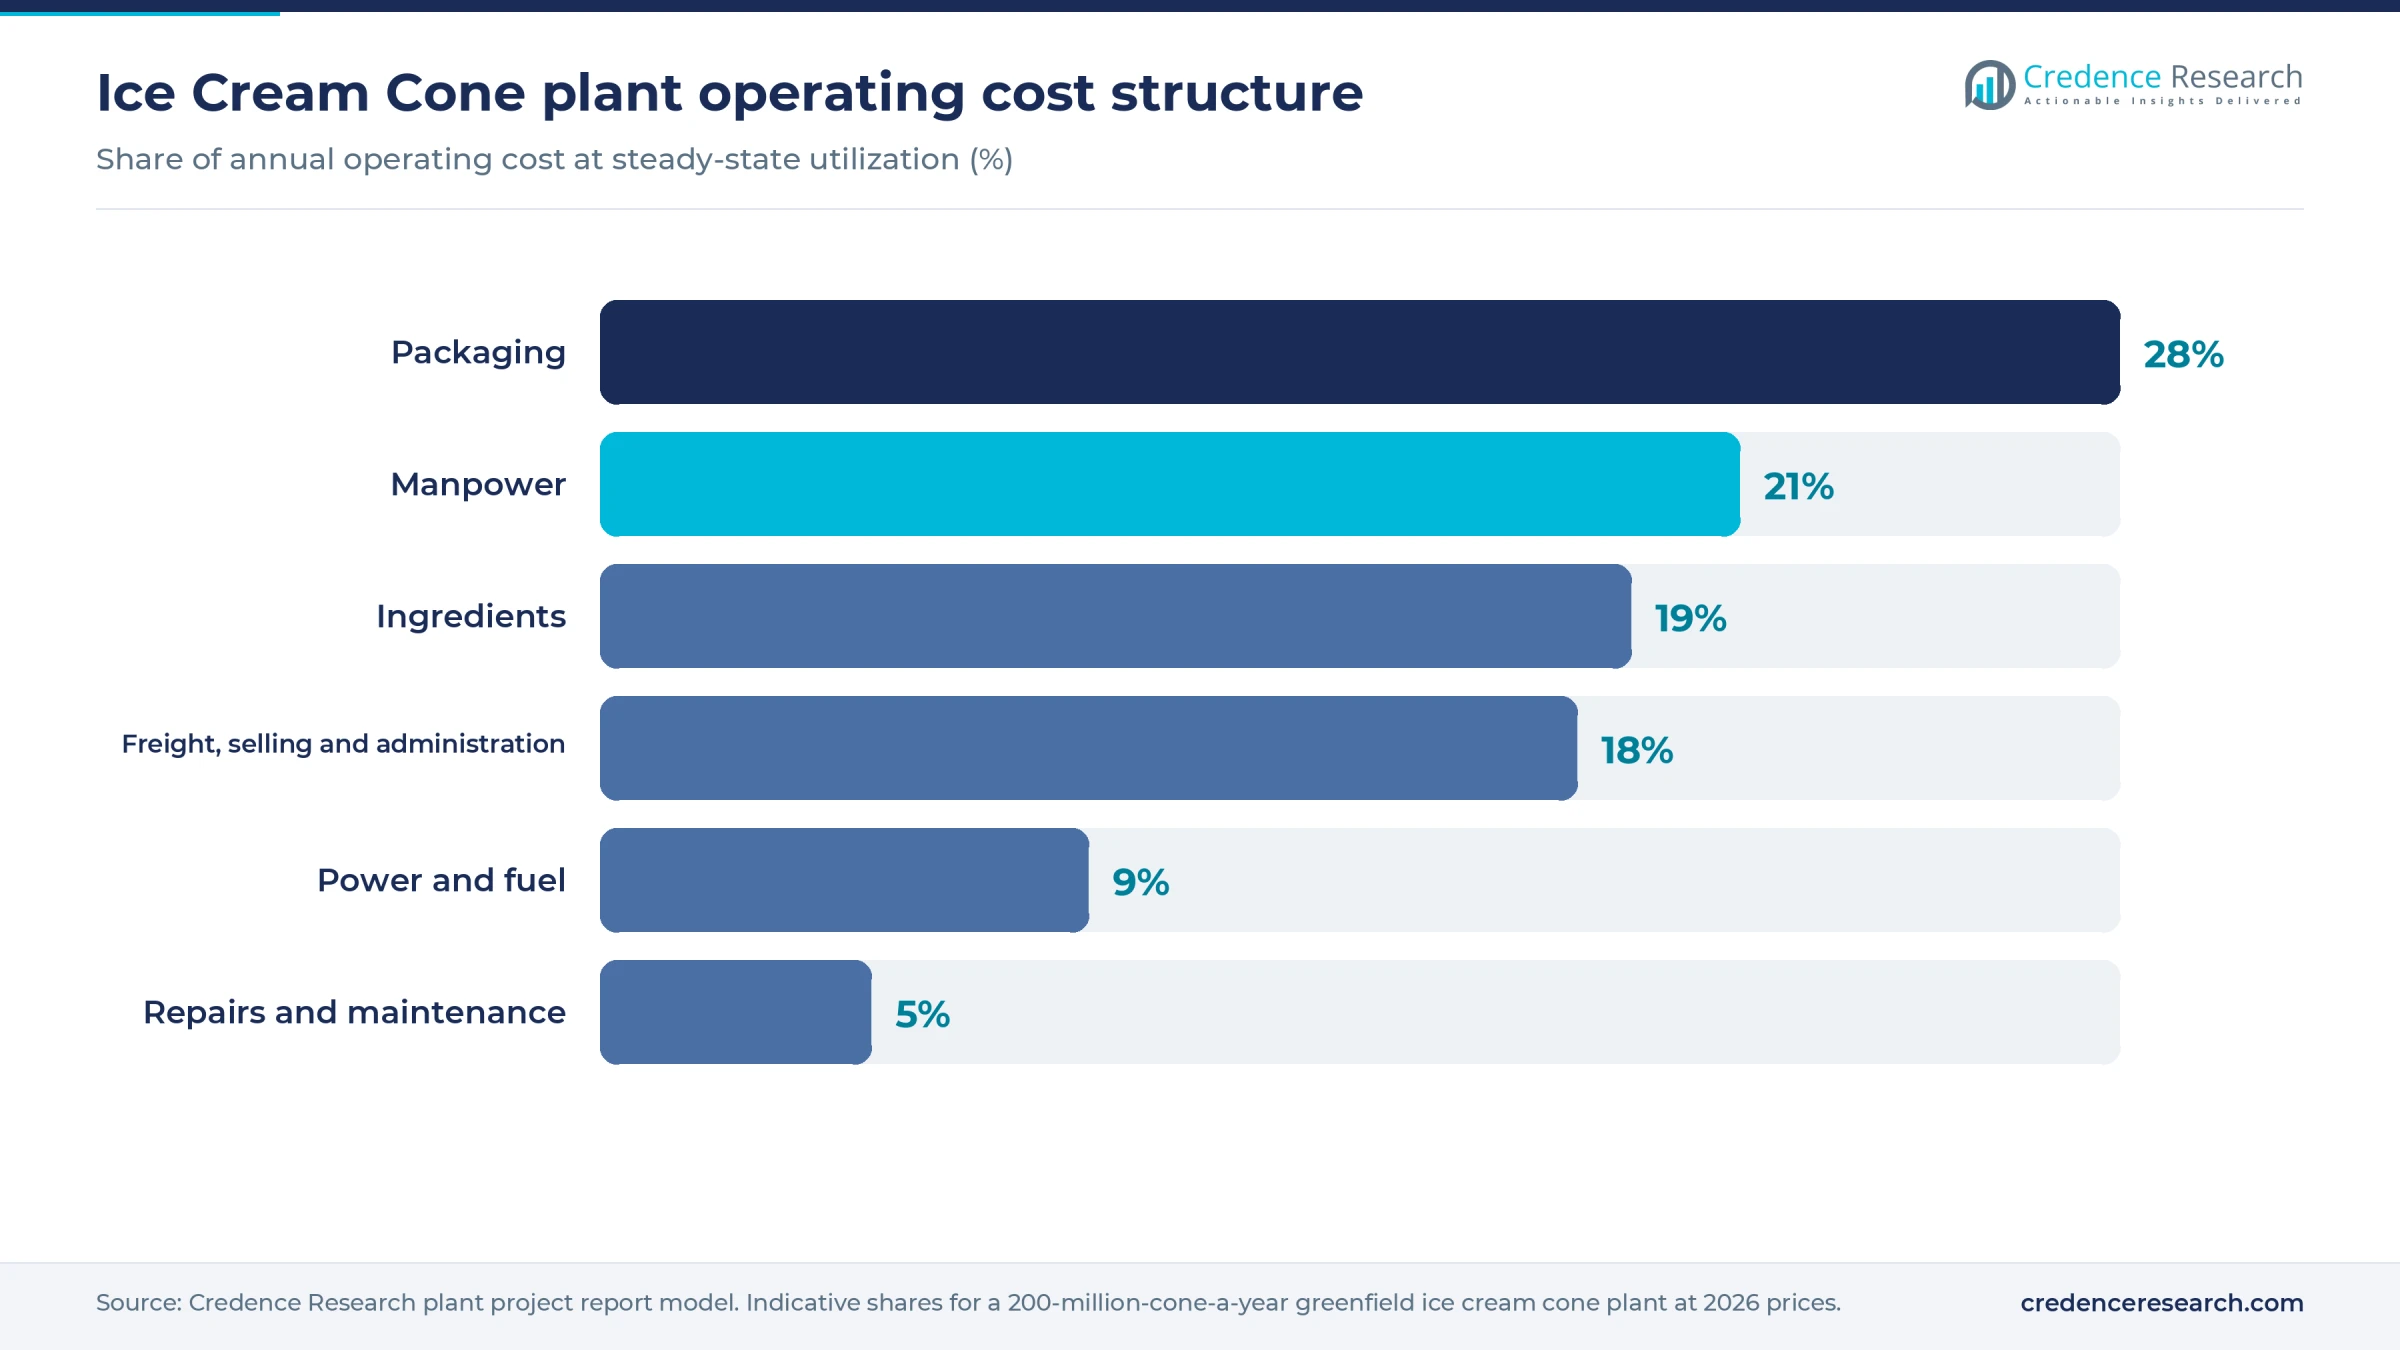
Unlike most bakery goods, packaging rivals ingredients in cost, because each cone weighs only a few grams but needs its own sleeve or a slot in a protective tray. The full report can be customized to any country's land, labor and energy costs.
Machinery and raw materials for an ice cream cone plant
The main machinery groups are listed below; capacities, specifications and quotations are available in the report. Credence Research covers adjacent equipment in its ice cream processing equipment study.
- Ingredient handling: flour and sugar silos or bag tipping stations, sifters, oil tanks and minor-ingredient dosing
- Batter making: high-shear mixers, cooled holding tanks with agitators and dosing pumps
- Baking: automatic molded cone and cup machines with gas-fired mold carousels, and rolled sugar cone lines with baking plates and rolling heads
- Finishing: trimming units, chocolate sprayers, cooling conveyors, counters and stackers
- Packing: sleeving machines, flow wrappers, tray loaders, case packers, metal detectors and checkweighers
- Utilities: natural gas or LPG supply, compressed air, dehumidified air for packing rooms and dust extraction
Soft wheat flour is the main ingredient. The wheat is grown widely, including in the EU, Russia, Ukraine, the U.S., Canada, Australia, Turkey and China, and most plants buy flour from a regional mill. Sugar comes mainly from Brazil, India, Thailand and the EU, and palm oil, the usual fat, from Indonesia and Malaysia. Soy lecithin is sourced from the U.S., Brazil and Argentina, and tapioca starch from Thailand and Vietnam. Cocoa coatings depend on beans from Côte d'Ivoire and Ghana, which makes chocolate the main source of price spikes for coated cones.
Ice cream cone business profit margin and ROI
Gross margin, after ingredients, packaging and direct conversion, is estimated at 30–42% at an assumed average ex-factory price of USD 0.025–0.040 per cone across the product mix. Modeled direct cost is about USD 0.013–0.022 per cone. Freight, selling and overheads, assumed at USD 450,000–750,000 a year, come next, since cones are bulky to ship.
Selling 160 million cones at 80% utilization gives revenue of about USD 4–6.4 million. After an assumed 20% tax, cash profit runs about USD 0.4–1.8 million, with a typical USD 1–1.4 million. Including a one-year ramp-up, a USD 3 million plant earning USD 1 million pays back in about 4 years, and a USD 8 million plant at that profit takes about 9. A USD 11 million build at USD 1 million would need about 12 years.
Distributor prices give a ceiling for ex-factory pricing. A U.S. foodservice catalog lists a 720-count case of flat-bottom cake cones at USD 62.49, about USD 0.09 per cone, and a 400-count case of sugar cones at USD 45.99, about USD 0.11, prices that include distributor margin and delivery.
A 10% rise in sleeve and carton costs that cannot be passed on cuts gross margin by about 2 percentage points, roughly twice the effect of a USD 100 per tonne rise in flour.
| Metric | Value |
|---|---|
| Project IRR (post-tax) | Available in report |
| NPV | Available in report |
| Return on investment | Available in report |
| DSCR | Available in report |
| Break-even utilization | Available in report |
How to start an ice cream cone business, licenses and approvals
A cone plant needs approvals in six areas wherever it is built. These are business and tax registration; land use, zoning and building permits; an environmental permit or exemption covering gas-fired ovens and wash water; occupational safety approvals, including flour dust and hot-surface controls; food business registration or licensing backed by a documented food safety plan; and customs registration for exports. Ice cream makers and retailers commonly also ask for FSSC 22000 or BRCGS certification, along with allergen controls and halal or kosher certificates for export markets.
| Market | Food and product | Environment and safety |
|---|---|---|
| United States | FDA food facility registration; current good manufacturing practice and preventive controls under 21 CFR 117; labeling and allergen declaration under 21 CFR 101; state food manufacturer license | State air permit or exemption for gas-fired ovens; local wastewater discharge approval; OSHA workplace rules, including combustible dust hazards |
| European Union | Food business registration and HACCP under Regulation (EC) No 852/2004; labeling under Regulation (EU) No 1169/2011; acrylamide mitigation under Regulation (EU) 2017/2158, with a 350 µg/kg benchmark for biscuits and wafers | National environmental and building permits; ATEX Directive 1999/92/EC duties for explosive dust atmospheres |
| India | FSSAI license under the Food Safety and Standards Act, 2006, with a central license generally required above 500 million rupees of annual turnover since April 2026 | State pollution control board consents to establish and operate; factory license under state factory rules |
Key ice cream cone manufacturers and recent developments
Joy Baking Group of Hermitage, Pennsylvania, is the dominant cone maker in North America and also owns BoDeans Baking Group in Iowa. Germany's Waffel Meyer is among the largest producers worldwide, with a plant in Bursa, Turkey, serving the Middle East and Africa. Keebler, part of Ferrero, sells branded cones in the U.S., and Cone Guys, bought by Philly Pretzel Factory in September 2025, makes pretzel cones. Integrated ice cream groups are major buyers or in-house producers of cones for filled products.
- December 2025. The Magnum Ice Cream Company began trading in Amsterdam, London and New York on Dec. 8 after its separation from Unilever. Its brands include Cornetto, one of the best-known filled cones.
- May 2026. Joy Baking Group's plan to enlarge its Lamor Road cone plant in Hermitage, Pennsylvania, by about 100,000 square feet went before the Mercer County Regional Planning Commission, with city officials citing rising demand for its products.
- July 2026. Trade press reported that The Magnum Ice Cream Company was investing HUF 4 billion, about EUR 10 million, in its Veszprém plant in Hungary, which makes Magnum, Cornetto and Carte d'Or products.
What's inside the Ice Cream Cone project report PDF
The report runs to 21 chapters. Open a chapter to see its sections.
1. Preface
2. Scope and Methodology
- 2.1 Objectives of the Study
- 2.2 Stakeholders
- 2.3 Research Methodology
- 2.4 Data Sources and Key Assumptions
3. Executive Summary
- 3.1 Market Snapshot
- 3.2 Project at a Glance (Capacity, CapEx, OpEx)
- 3.3 Key Financial Indicators (IRR, NPV, Payback, Break-even)
- 3.4 Feasibility Verdict
4. Product Overview
- 4.1 Ice Cream Cone Definition and Properties
- 4.2 Grades and Specifications (BIS / ISO / ASTM)
- 4.3 HS Code and Classification
- 4.4 Key Applications
- 4.5 Substitutes
5. Global Ice Cream Cone Market
- 5.1 Market Overview
- 5.2 Historical and Current Market Performance (Volume and Value)
- 5.3 Market Breakup by Grade / Type
- 5.4 Market Breakup by End-Use Industry
- 5.5 Market Breakup by Region
- 5.6 Market Drivers, Restraints and Trends
- 5.7 Value Chain Analysis
- 5.8 Market Forecast
6. Target Country Ice Cream Cone Market Analysis
- 6.1 Demand and Supply Analysis
- 6.2 Installed Capacity vs Demand Gap
- 6.3 Import Dependence
- 6.4 Demand Forecast by End-Use
7. Trade Analysis
- 7.1 Imports by Volume, Value and Country
- 7.2 Exports by Volume, Value and Country
- 7.3 Trade Balance and Opportunities
8. Price Analysis
- 8.1 Historical Ice Cream Cone Price Trends by Region
- 8.2 Raw Material / Feedstock Price Trends and Linkage
- 8.3 Price Forecast
- 8.4 Margins Across the Value Chain
9. Competitive Landscape
- 9.1 Market Structure
- 9.2 Key Players and Installed Capacities
- 9.3 Profiles of Key Players
- 9.4 Recent Developments (Expansions, M&A, New Plants)
10. Manufacturing Process and Technology
- 10.1 Comparison of Technology Routes
- 10.2 Selected Route and Process Flow Diagram
- 10.3 Unit Operations Involved
- 10.4 Chemical Reactions Involved
- 10.5 Mass Balance and Raw Material Requirements
- 10.6 Energy Balance
- 10.7 Quality Assurance Criteria and Technical Tests
- 10.8 By-products and Waste Handling
- 10.9 Technology Licensors / Providers
11. Project Details, Requirements and Costs
- 11.1 Land, Location and Site Development
- 11.1.1 Site Selection Criteria
- 11.1.2 Location Analysis
- 11.1.3 Land Requirement and Costs
- 11.1.4 Site Development Costs
- 11.2 Plant Layout
- 11.2.1 Layout Principles
- 11.2.2 Proposed Layout
- 11.2.3 Factors Influencing Layout
- 11.3 Civil Works and Buildings
- 11.4 Plant Machinery
- 11.4.1 Machinery Requirements and Specifications
- 11.4.2 Machinery Costs
- 11.4.3 Machinery Suppliers
- 11.5 Raw Materials
- 11.5.1 Requirements per Tonne of Output
- 11.5.2 Procurement and Sourcing
- 11.5.3 Costs
- 11.5.4 Suppliers
- 11.6 Packaging
- 11.6.1 Packaging Requirements
- 11.6.2 Packaging Costs
- 11.6.3 Packaging Suppliers
- 11.7 Storage and Material Handling
- 11.8 Transportation Requirements and Costs
- 11.9 Utilities
- 11.9.1 Power Requirements and Costs
- 11.9.2 Water Requirements and Costs
- 11.9.3 Steam, Fuel and Other Utilities
- 11.10 Manpower Requirements and Wages
12. Environment, Health, Safety and Sustainability
- 12.1 Effluent and Emissions Management
- 12.2 Hazard Classification and Safety Measures
- 12.3 Carbon Footprint
- 12.4 Green / Low-Carbon Process Options
13. Regulatory Procedures, Approvals and Certifications
- 13.1 Licences and Registrations
- 13.2 Environmental Clearances
- 13.3 Product Certifications (BIS, REACH, etc.)
- 13.4 Approval Timeline
14. Project Implementation Schedule
15. Project Economics
- 15.1 Capital Cost of the Project
- 15.2 Techno-Economic Parameters
- 15.3 Capacity Utilization and Ramp-up
- 15.4 Product Pricing and Margins
- 15.5 Income Projections
- 15.6 Expenditure Projections
- 15.7 Working Capital Requirement
- 15.8 Taxation
- 15.9 Depreciation
16. Financial Analysis
- 16.1 Projected Profit and Loss Account
- 16.2 Projected Cash Flow Statement
- 16.3 Projected Balance Sheet
- 16.4 Liquidity Analysis
- 16.5 Profitability Analysis (Payback, NPV, IRR, ROI)
- 16.6 Break-even Analysis
- 16.7 Debt Service Coverage Ratio (DSCR)
- 16.8 Sensitivity Analysis
- 16.9 Scenario and Uncertainty Analysis
17. Funding and Incentives
- 17.1 Means of Finance and Debt-Equity Structure
- 17.2 Loans and Financial Assistance
- 17.3 Government Schemes and Subsidies (PLI, State Policies)
18. Risk Assessment
- 18.1 Key Success Factors
- 18.2 Key Risk Factors
- 18.3 Risk Mitigation
19. Strategic Recommendations
20. Case Study of a Successful Venture
21. Appendix
- 21.1 Detailed Assumptions
- 21.2 Abbreviations
- 21.3 List of Tables and Figures
- 21.4 Sources
This page vs. the full report
| Data point | On this page (free) | In the full report |
|---|---|---|
| Total CapEx | One rounded range at one capacity | Exact figure at three capacities with a line-item breakup |
| CapEx breakup | Category shares (%) only | Cost, quantity and supplier for every machine |
| Operating cost | Share of raw materials, utilities and labor | Per-unit cost sheet with each input price and consumption |
| Profitability | Gross margin range and payback band | Exact IRR, NPV, ROI, break-even and DSCR |
| Financial statements | List of what is included | 10-year P&L, cash flow, balance sheet and Excel model |
| Sensitivity | One directional line | Full sensitivity and scenario tables |
| Process | Simplified flow diagram | Detailed process flow, mass and energy balance, operating conditions |
| Machinery | Names of the main machines | Specifications, capacity, cost and supplier list |
| Market | Headline size, growth and global demand | Segment, region, trade and price forecast tables |
| Suppliers and buyers | Supplier types and sourcing hubs | Named suppliers and buyers |
Ice Cream Cone project report: FAQs
How much does it cost to set up an ice cream cone plant?
What profit margin can an ice cream cone plant earn?
What is the difference between cake cones and sugar cones?
Why does packaging matter so much in cone making?
Which licenses does an ice cream cone plant need?
How does seasonality affect an ice cream cone business?
Who buys cones from a new plant?

About the analyst
Priyanka Mor, Senior Consultant
Senior Consultant at Credence Research Inc directing strategic market advisory, cross-border commercial due diligence and enterprise intelligence frameworks for global B2B clients. Combines quantitative modeling with executive advisory, translating macroeconomic variables and supply chain data into go-to-market blueprints, M&A screenings and competitive war-gaming strategies.
Related market research
- Ice Cream Market Size, Share, Growth, Trends and Forecast 2032
- Wafer Biscuits Market Size, Trends, Share and Forecast 2032
- Ice Cream Processing Equipment Market Size, Share and Forecast 2032
- Ice Cream Service Supplies Market Size, Growth & Forecast 2032
- Cookie and Wafer Market Size, Share and Growth Report 2032
- Impulse Ice Cream Market Size, Share & Forecast Report 2032
More plant project reports
- Soda Water Manufacturing Plant Project Report (DPR) 2026
- Garlic Powder Manufacturing Plant Project Report (DPR) 2026
- Extruded Snacks Manufacturing Plant Project Report (DPR) 2026
- Bread Manufacturing Plant Project Report (DPR) 2026
- Chocolate Manufacturing Plant Project Report (DPR) 2026
- Cheese Manufacturing Plant Project Report (DPR) 2026