| REPORT ATTRIBUTE |
DETAILS |
| Historical Period |
2020-2023 |
| Base Year |
2024 |
| Forecast Period |
2025-2032 |
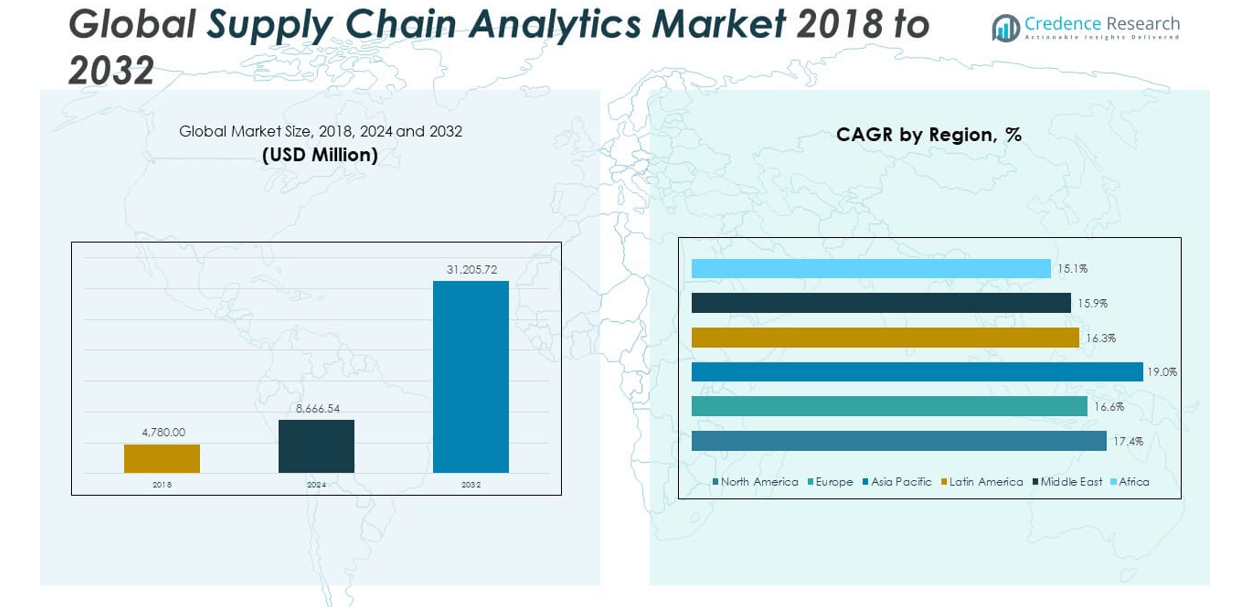
| Supply Chain Analytics Market Size 2024 |
USD 8,666.54 million |
| Supply Chain Analytics Market, CAGR |
17.44% |
| Supply Chain Analytics Market Size 2032 |
USD 31,205.72 million |
Market Overview:
The Global Supply Chain Analytics Market size was valued at USD 4,780.00million in 2018 to USD 8,666.54 million in 2024 and is anticipated to reach USD 31,205.72 million by 2032, at a CAGR of 17.44% during the forecast period.
Key drivers supporting the market’s momentum include the need for enhanced operational efficiency, growing complexity in global trade networks, and the increasing frequency of supply chain disruptions caused by geopolitical tensions, pandemics, and environmental events. Enterprises are deploying analytics platforms to forecast demand accurately, reduce inventory costs, and improve supplier collaboration. The rise of e-commerce has further intensified the need for agile and responsive supply chains, pushing retailers and logistics providers to adopt analytics for last-mile delivery optimization and warehouse automation. Additionally, the shift toward sustainability and regulatory compliance is encouraging businesses to use supply chain analytics to track emissions, optimize resource usage, and meet ESG goals.
Regionally, North America holds the largest share of the global supply chain analytics market, supported by strong technology infrastructure, a high level of digital maturity, and the presence of leading solution providers. The U.S. continues to be the key revenue generator due to its widespread use of analytics in manufacturing, retail, and logistics. Europe follows, driven by strict regulations, cross-border trade complexity, and strong emphasis on sustainability in supply chain operations. Asia-Pacific is the fastest-growing region, with countries like China, India, and Japan adopting supply chain analytics to manage rapid industrialization, rising consumer demand, and digital commerce expansion. Meanwhile, Latin America and the Middle East & Africa are emerging markets, witnessing increasing investments in digital logistics infrastructure and technology adoption across sectors such as healthcare, retail, and transportation.
Market Insights:
- The Global Supply Chain Analytics Market grew from USD 4,780 million in 2018 to USD 8,666.54 million in 2024 and is projected to reach USD 31,205.72 million by 2032, at a CAGR of 17.44%.
- Enterprises are deploying analytics to forecast demand, optimize inventory levels, and reduce supplier-related risks across the supply chain.
- Increasing disruptions from geopolitical tensions, pandemics, and environmental events are pushing companies to adopt analytics for scenario modelling and decision-making.
- The rapid adoption of cloud-based and SaaS platforms is making analytics more accessible, especially for mid-sized businesses aiming for agile operations.
- Regulatory pressures and ESG commitments are driving the use of analytics to track emissions, reduce resource consumption, and ensure supplier compliance.
- Legacy systems and fragmented data environments continue to create challenges in integration, slowing enterprise-wide analytics deployment.
- North America dominates the market, while Asia-Pacific is witnessing the fastest growth due to industrialization, digital commerce, and rising consumer demand.
Access crucial information at unmatched prices!
Request your sample report today & start making informed decisions powered by Credence Research Inc.!
Download Sample
Market Drivers:
Surging Demand for Real-Time Insights and Predictive Capabilities:
The Global Supply Chain Analytics Market is driven by the growing need for real-time visibility and predictive insights across end-to-end supply chains. Enterprises are under pressure to respond faster to demand fluctuations, disruptions, and supplier risks. It enables proactive decision-making through demand forecasting, inventory optimization, and risk mitigation. Businesses are investing in AI-powered platforms to enhance operational agility and responsiveness. The ability to monitor performance across sourcing, logistics, and distribution helps reduce lead times and enhance customer satisfaction. This is accelerating analytics adoption across manufacturing, retail, automotive, and healthcare sectors.
- For instance, Maersk’s Visibility Studio enables real-time tracking of multi-modal shipments and predictive analytics, providing actionable insights into disruptions and reducing operational costs. Maersk’s 2024 survey showed that supply chain visibility was ranked as the industry’s top trend, with 77% of companies prioritizing visibility investments.
Growing Complexity in Global Trade and Logistics Networks:
The Global Supply Chain Analytics Market is benefiting from the increasing complexity of global trade routes, multi-tier supplier ecosystems, and logistics structures. Companies are managing fragmented networks involving numerous vendors, transport modes, and compliance frameworks. Analytics tools are becoming essential to streamline cross-border transactions, track shipments, and reduce customs delays. It supports scenario modeling and risk scoring to navigate geopolitical tensions, port congestion, and environmental disruptions. Strategic decisions such as supplier diversification or nearshoring depend on advanced analytics for accurate cost-benefit evaluation. This complexity continues to fuel demand for scalable, intelligent solutions.
- For instance, DHL uses Greenplan’s optimization algorithms for route and stop sequencing in parcel delivery, optimizing over 1.5 billion parcels annually and reducing costs and CO2 emissions. Their AI-powered software processes hundreds of delivery addresses per route, optimizing sequences and improving both efficiency and sustainability.
Rising Adoption of Cloud-Based and SaaS Platforms:
Cloud deployment is a major growth catalyst in the Global Supply Chain Analytics Market. Cloud-based platforms offer scalability, faster implementation, and centralized data access, reducing the burden on internal IT resources. SaaS models allow enterprises to integrate multiple data sources, including IoT devices and ERP systems, in a cost-efficient manner. It supports advanced functions like real-time alerts, anomaly detection, and automated reporting. Mid-sized firms are particularly driving demand due to the affordability and ease of use offered by these platforms. Vendors are enhancing cloud capabilities to meet evolving enterprise data and analytics needs.
Push for Sustainability and Regulatory Compliance:
The Global Supply Chain Analytics Market is expanding due to stricter environmental regulations and growing pressure to achieve ESG targets. Organizations are leveraging analytics to track carbon emissions, energy consumption, and sourcing sustainability. It helps improve transparency in supplier practices, identify inefficiencies, and design greener logistics strategies. Sustainability-driven reporting requires robust data integration and analytics to align with government and stakeholder expectations. Regulations such as the EU Green Deal and U.S. SEC climate disclosure rules are driving analytics investments. Companies use these tools to demonstrate compliance and achieve long-term sustainability goals.
Market Trends:
Integration of Artificial Intelligence and Machine Learning Models:
AI and ML are transforming the Global Supply Chain Analytics Market by enabling automation and self-learning capabilities. Companies use these technologies to detect patterns, predict anomalies, and improve accuracy in forecasting models. It enhances visibility into demand signals, supplier performance, and logistics bottlenecks. ML algorithms continuously refine predictive outcomes based on new inputs, driving operational efficiency. Cognitive computing supports strategic planning in uncertain environments. These technologies are evolving from supportive tools into core components of digital supply chains.
- For instance, Unilever’s AI integration with Walmart Mexico resulted in a 98% on-shelf product availability and a 12% sales growth, while inventory was reduced. Their AI system can perform over 13 billion computations daily for forecasting and inventory management, dramatically improving supply efficiency and sustainability.
Expansion of Digital Twin Technology in Supply Chain Modeling:
Digital twins are gaining momentum in the Global Supply Chain Analytics Market. These virtual replicas simulate supply chain dynamics and enable scenario testing in real-time. It allows businesses to evaluate the impact of decisions before execution, minimizing disruption risks. Digital twins support end-to-end optimization by visualizing interdependencies between sourcing, warehousing, transportation, and customer service. They help address supply shortages, assess capacity constraints, and plan responses to natural disasters or supplier failures. The technology is being rapidly adopted across industries like aerospace, manufacturing, and logistics.
- For instance, Siemens used digital twins to model interdependencies across its global supply chain, resulting in a 20% improvement in capacity utilization and a 30% faster response to supply chain disruptions in its electronics manufacturing division.
Rise of Control Towers for Centralized Command and Visibility:
Control towers are becoming a key component in the Global Supply Chain Analytics Market. These platforms offer centralized command, coordination, and visibility across multi-enterprise supply networks. It allows users to track shipments, monitor exceptions, and manage inventory across regions in real time. Control towers integrate data from third-party logistics, freight partners, and production systems. Their growing importance stems from the need to maintain continuity in volatile markets. Companies use them to improve customer service levels and reduce cost-to-serve ratios.
Focus on Prescriptive Analytics and Decision Automation:
Prescriptive analytics is reshaping the Global Supply Chain Analytics Market by offering actionable recommendations rather than just insights. Companies rely on optimization algorithms and simulation models to guide decisions on procurement, production scheduling, and routing. It combines structured data with unstructured sources like weather feeds and social signals to provide deeper insights. The approach enhances decision speed and consistency across supply chain functions. Automation of routine decision-making frees up resources for strategic planning. This trend aligns with broader enterprise goals of improving efficiency and resilience.
Market Challenges Analysis:
Data Fragmentation and Integration Complexity Across Legacy Systems:
The Global Supply Chain Analytics Market faces a significant challenge in data standardization and system interoperability. Many companies operate with siloed legacy systems that lack real-time data exchange capabilities. It limits the effectiveness of analytics solutions, which rely on consistent, clean, and complete data inputs. Integrating structured and unstructured data from ERP, CRM, and IoT platforms requires high investment in middleware, APIs, and data governance frameworks. Inconsistent formats, missing fields, and duplicated records further degrade analytical accuracy. The lack of skilled data engineers and architects amplifies this barrier.
High Cost of Implementation and Change Management Resistance:
Cost and internal resistance are persistent obstacles in the Global Supply Chain Analytics Market. Implementing advanced analytics platforms involves substantial investment in tools, training, and change management. It requires reengineering of processes, cross-functional collaboration, and cultural shifts toward data-driven decision-making. Many organizations struggle to quantify ROI in the early stages, leading to reluctance in allocating budgets. Resistance from operational teams and middle management delays adoption timelines. Vendors must offer proof-of-value pilots and flexible pricing models to overcome financial and organizational barriers.
Market Opportunities:
Emerging Demand from Small and Medium Enterprises (SMEs):
he Global Supply Chain Analytics Market presents strong opportunities in the SME segment. These firms are increasingly turning to analytics to manage lean inventories, reduce procurement costs, and respond faster to demand shifts. It is becoming accessible to smaller businesses through cloud deployment and subscription-based pricing. Vendors can expand their customer base by offering plug-and-play, modular analytics platforms tailored for mid-sized operations.
Strategic Role in Resilient and Adaptive Supply Chain Architectures:
Supply chain resilience is becoming a boardroom priority across industries. The Global Supply Chain Analytics Market can support resilient architectures through simulation, risk scoring, and predictive disruption alerts. It enables companies to adapt quickly during global crises, raw material shortages, or labor strikes. Analytics empowers firms to build agile, redundant supply networks with minimal disruption.
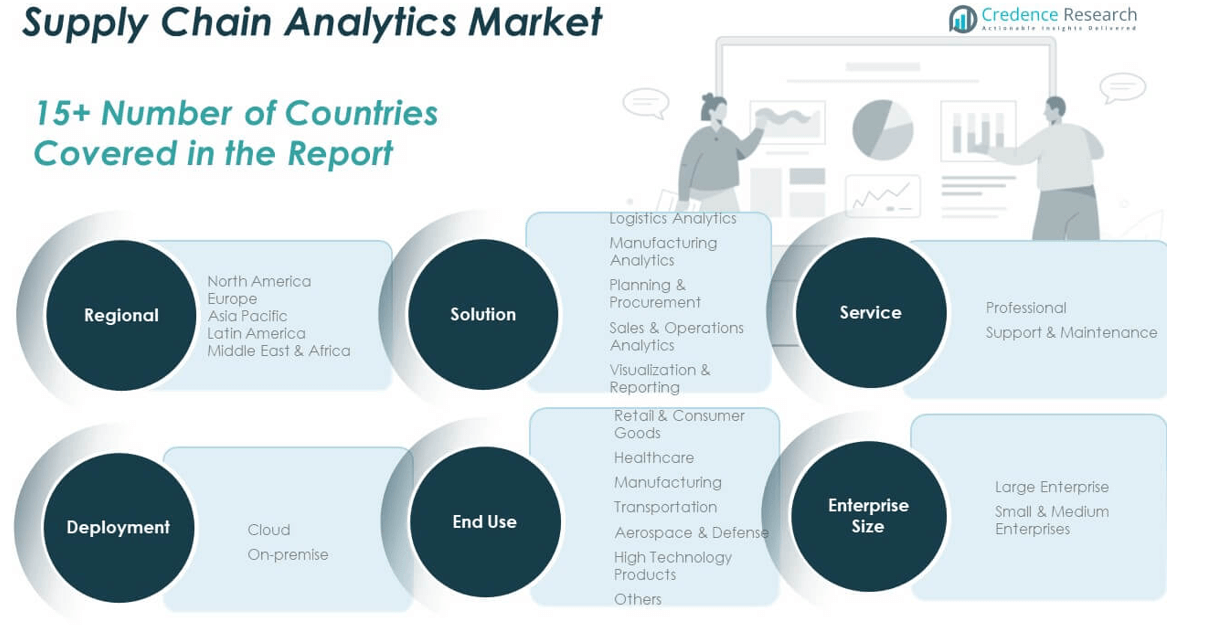
Market Segmentation Analysis:
By Solution
The Global Supply Chain Analytics Market is segmented into logistics analytics, manufacturing analytics, planning & procurement, sales & operations analytics, and visualization & reporting. Logistics analytics holds a dominant share due to its impact on shipment tracking, last-mile delivery, and route optimization. Manufacturing analytics enables process control, waste reduction, and efficiency gains. Planning & procurement supports strategic sourcing and cost reduction. Sales & operations analytics help balance demand and supply through integrated planning. Visualization & reporting drive actionable decision-making through interactive dashboards.
- For instance, Toyota adopted logistics analytics for shipment tracking and route optimization, achieving a 10% decrease in transportation costs and a 17% improvement in on-time deliveries across North America through advanced decision-support dashboards.
By Service
The market is divided into professional and support & maintenance services. Professional services lead the segment, fueled by demand for consulting, integration, and deployment expertise. Support & maintenance is growing steadily as companies seek to ensure system continuity and performance optimization post-deployment.
- For instance, Lenovo’s Supply Chain Intelligence (SCI) integrates data from over 2,000 suppliers, utilizing AI for more than 1,500 daily tasks, raising data integration above 80%. This consolidated view enables quick, effective responses to supply chain risks and drives real-time, data-driven decisions, ensuring a resilient global supply chain environment.
By End-use
Key end-use sectors include retail & consumer goods, healthcare, manufacturing, transportation, aerospace & defense, high deployment products, and others. Retail & consumer goods dominate due to e-commerce growth and inventory complexity. Manufacturing and transportation sectors use analytics to streamline operations and reduce delays. Healthcare and aerospace prioritize compliance and risk management. High deployment products and other industries expand the application base.
By Deployment
Deployment types include cloud and on-premise. Cloud deployment leads due to its scalability, faster implementation, and lower infrastructure costs. On-premise remains relevant for organizations with strict data security policies and legacy integration needs.
By Enterprise Size
The market covers large enterprises and small & medium enterprises. Large enterprises dominate due to bigger IT budgets and established infrastructure. Small & medium enterprises are adopting agile, cloud-based analytics to improve competitiveness with minimal capital investment.
Segmentation:
- By Solution
- Logistics Analytics
- Manufacturing Analytics
- Planning & Procurement
- Sales & Operations Analytics
- Visualization & Reporting
- By Service
- Professional
- Support & Maintenance
- By End-use
- Retail & Consumer Goods
- Healthcare
- Manufacturing
- Transportation
- Aerospace & Defense
- High Deployment Products
- Others
- By Deployment
- By Enterprise Size
- Large Enterprise
- Small & Medium Enterprises
- By Region
- North America
- Europe
- Germany
- France
- U.K.
- Italy
- Spain
- Rest of Europe
- Asia Pacific
- China
- Japan
- India
- South Korea
- South-east Asia
- Rest of Asia Pacific
- Latin America
- Brazil
- Argentina
- Rest of Latin America
- Middle East & Africa
- GCC Countries
- South Africa
- Rest of the Middle East and Africa
Regional Analysis:
North America
The North America Supply Chain Analytics Market size was valued at USD 1,859.42 million in 2018 to USD 3,333.10 million in 2024 and is anticipated to reach USD 11,986.17 million by 2032, at a CAGR of 17.4% during the forecast period. North America holds the largest share in the Global Supply Chain Analytics Market, driven by high digital maturity, robust IT infrastructure, and early adoption of AI and cloud platforms. The U.S. leads the region with widespread implementation across manufacturing, logistics, and retail sectors. Companies rely on analytics to enhance visibility, reduce operational risks, and optimize performance across vast supply networks. The presence of leading solution providers such as IBM, Oracle, and Manhattan Associates strengthens regional growth. Strong regulatory frameworks and customer-centric supply chain strategies continue to fuel demand for advanced analytics solutions.
Europe
The Europe Supply Chain Analytics Market size was valued at USD 1,264.31 million in 2018 to USD 2,203.66 million in 2024 and is anticipated to reach USD 7,497.26 million by 2032, at a CAGR of 16.6% during the forecast period. Europe accounts for a significant share of the Global Supply Chain Analytics Market, supported by strict compliance regulations, cross-border trade complexity, and a strong focus on sustainability. Countries like Germany, the UK, and France are investing in advanced analytics to improve logistics precision and reduce carbon footprints. Enterprises leverage analytics to align with EU Green Deal mandates and streamline procurement operations. The adoption of AI, machine learning, and digital twins is growing across retail, automotive, and aerospace sectors. Europe’s focus on resilience and transparency across supply chains continues to push market expansion.
Asia Pacific
The Asia Pacific Supply Chain Analytics Market size was valued at USD 1,073.59 million in 2018 to USD 2,040.50 million in 2024 and is anticipated to reach USD 8,172.80 million by 2032, at a CAGR of 19.0% during the forecast period. Asia Pacific is the fastest-growing region in the Global Supply Chain Analytics Market. Rapid industrialization, booming e-commerce, and rising demand for smart logistics drive analytics adoption across China, India, Japan, and Southeast Asia. Regional players are investing in cloud-based platforms and AI-driven solutions to handle large-scale operations and volatile market conditions. Governments in China and India are supporting digitization and supply chain transparency through policy frameworks. The region’s complex trade dynamics and manufacturing dominance make analytics critical for managing lead times, inventory, and vendor performance.
Latin America
The Latin America Supply Chain Analytics Market size was valued at USD 281.54 million in 2018 to USD 505.17 million in 2024 and is anticipated to reach USD 1,677.93 million by 2032, at a CAGR of 16.3% during the forecast period. Latin America holds a growing share in the Global Supply Chain Analytics Market, driven by the modernization of logistics and warehousing infrastructure. Brazil and Mexico lead regional adoption, supported by increased demand for data visibility, route optimization, and warehouse automation. Companies in retail, agriculture, and automotive sectors are leveraging analytics to navigate regional supply disruptions and meet consumer expectations. Rising foreign investment and trade agreements are further encouraging analytics deployment. Cloud solutions are gaining traction among small and medium enterprises looking to improve competitiveness.
Middle East
The Middle East Supply Chain Analytics Market size was valued at USD 180.68 million in 2018 to USD 306.74 million in 2024 and is anticipated to reach USD 995.63 million by 2032, at a CAGR of 15.9% during the forecast period. The Middle East is emerging as a promising region in the Global Supply Chain Analytics Market, with strong demand in oil & gas, logistics, and industrial sectors. Countries like the UAE and Saudi Arabia are adopting analytics to support Vision 2030 and other national digitization agendas. Analytics tools are enabling predictive maintenance, efficient inventory planning, and real-time tracking. The growth of e-commerce and regional trade hubs is creating demand for logistics optimization. Public and private sector collaboration in smart infrastructure is fueling further investment in data-driven supply chain strategies.
Africa
The Africa Supply Chain Analytics Market size was valued at USD 120.46 million in 2018 to USD 277.36 million in 2024 and is anticipated to reach USD 875.92 million by 2032, at a CAGR of 15.1% during the forecast period. Africa holds the smallest share in the Global Supply Chain Analytics Market but is witnessing steady growth due to infrastructure development and technology adoption. South Africa leads in deployment, followed by Nigeria and Egypt, where demand is rising in healthcare, retail, and logistics. Companies use analytics to address inefficiencies, reduce lead times, and manage supply chain disruptions caused by regulatory and geographic challenges. International development programs and digital transformation initiatives are creating opportunities for cloud-based analytics. Growing internet penetration and mobile-based platforms are further enabling regional adoption.
Shape Your Report to Specific Countries or Regions & Enjoy 30% Off!
Key Player Analysis:
- Accenture PLC
- Aera Technology
- Birst, Inc.
- Capgemini SA
- Genpact Limited
- International Business Machines Corporation
- JDA Software Group, Inc.
- Kinaxis
- Lockheed Martin Corporation
- Maersk Group
- Manhattan Associates, Inc.
- Thales Group
Competitive Analysis:
The Global Supply Chain Analytics Market features a competitive landscape dominated by multinational technology and consulting firms. Leading players such as IBM, SAP, Oracle, Accenture, and Kinaxis continue to invest in AI-driven platforms, predictive analytics, and real-time visibility solutions. It reflects a blend of enterprise software providers and niche analytics vendors offering modular solutions. Companies focus on expanding cloud capabilities, enhancing integration with ERP systems, and delivering industry-specific use cases. Strategic collaborations, mergers, and R&D investments remain central to gaining a competitive edge. The market rewards vendors with scalable platforms, strong technical support, and rapid deployment capabilities.
Recent Developments:
- In May 2025, Capgemini expanded its partnership with Mistral AI, focusing on secure generative AI for supply chain analytics in regulated industries.
- In March 2025, Kinaxis launched agentic and generative AI features in Maestro™, enhancing real-time supply chain analytics and digital twin interactions.
- In January 2025, Accenture partnered with KION Group and NVIDIA to launch AI-powered digital twin solutions for supply chain optimization, showcased at CES 2025.
Market Concentration & Characteristics:
The Global Supply Chain Analytics Market remains moderately concentrated, with a mix of global technology giants and specialized solution providers driving innovation. It exhibits high technological dynamism, with AI, ML, and IoT integration becoming essential differentiators. Enterprises demand tailored solutions that ensure real-time visibility, scalability, and actionable intelligence. It favors vendors offering flexible deployment models, including cloud-first and hybrid options. Long-term partnerships, product customization, and regional expansion define the competitive behavior in this evolving market.
Report Coverage:
The research report offers an in-depth analysis based on solution, service, end-use, deployment, and enterprise size. It details leading market players, providing an overview of their business, product offerings, investments, revenue streams, and key applications. Additionally, the report includes insights into the competitive environment, SWOT analysis, current market trends, as well as the primary drivers and constraints. Furthermore, it discusses various factors that have driven market expansion in recent years. The report also explores market dynamics, regulatory scenarios, and technological advancements that are shaping the industry. It assesses the impact of external factors and global economic changes on market growth. Lastly, it provides strategic recommendations for new entrants and established companies to navigate the complexities of the market.
Future Outlook:
- AI-driven platforms will dominate new deployments across large and mid-sized enterprises
- Real-time visibility will become the standard in logistics and warehouse analytics
- Cloud-based solutions will account for the majority of new implementations
- Adoption will accelerate in emerging markets through regional digitalization efforts
- ESG compliance and emission tracking will drive sustainability analytics integration
- Industry-specific customization will gain traction, especially in healthcare and retail
- Predictive analytics will enhance supplier risk management and demand planning
- SMB adoption will increase due to SaaS pricing models and low upfront costs
- Control tower solutions will scale across global supply networks
- Partnerships between tech providers and logistics firms will boost end-to-end integration


