
Interoperable payments and marketplace logistics lift sales
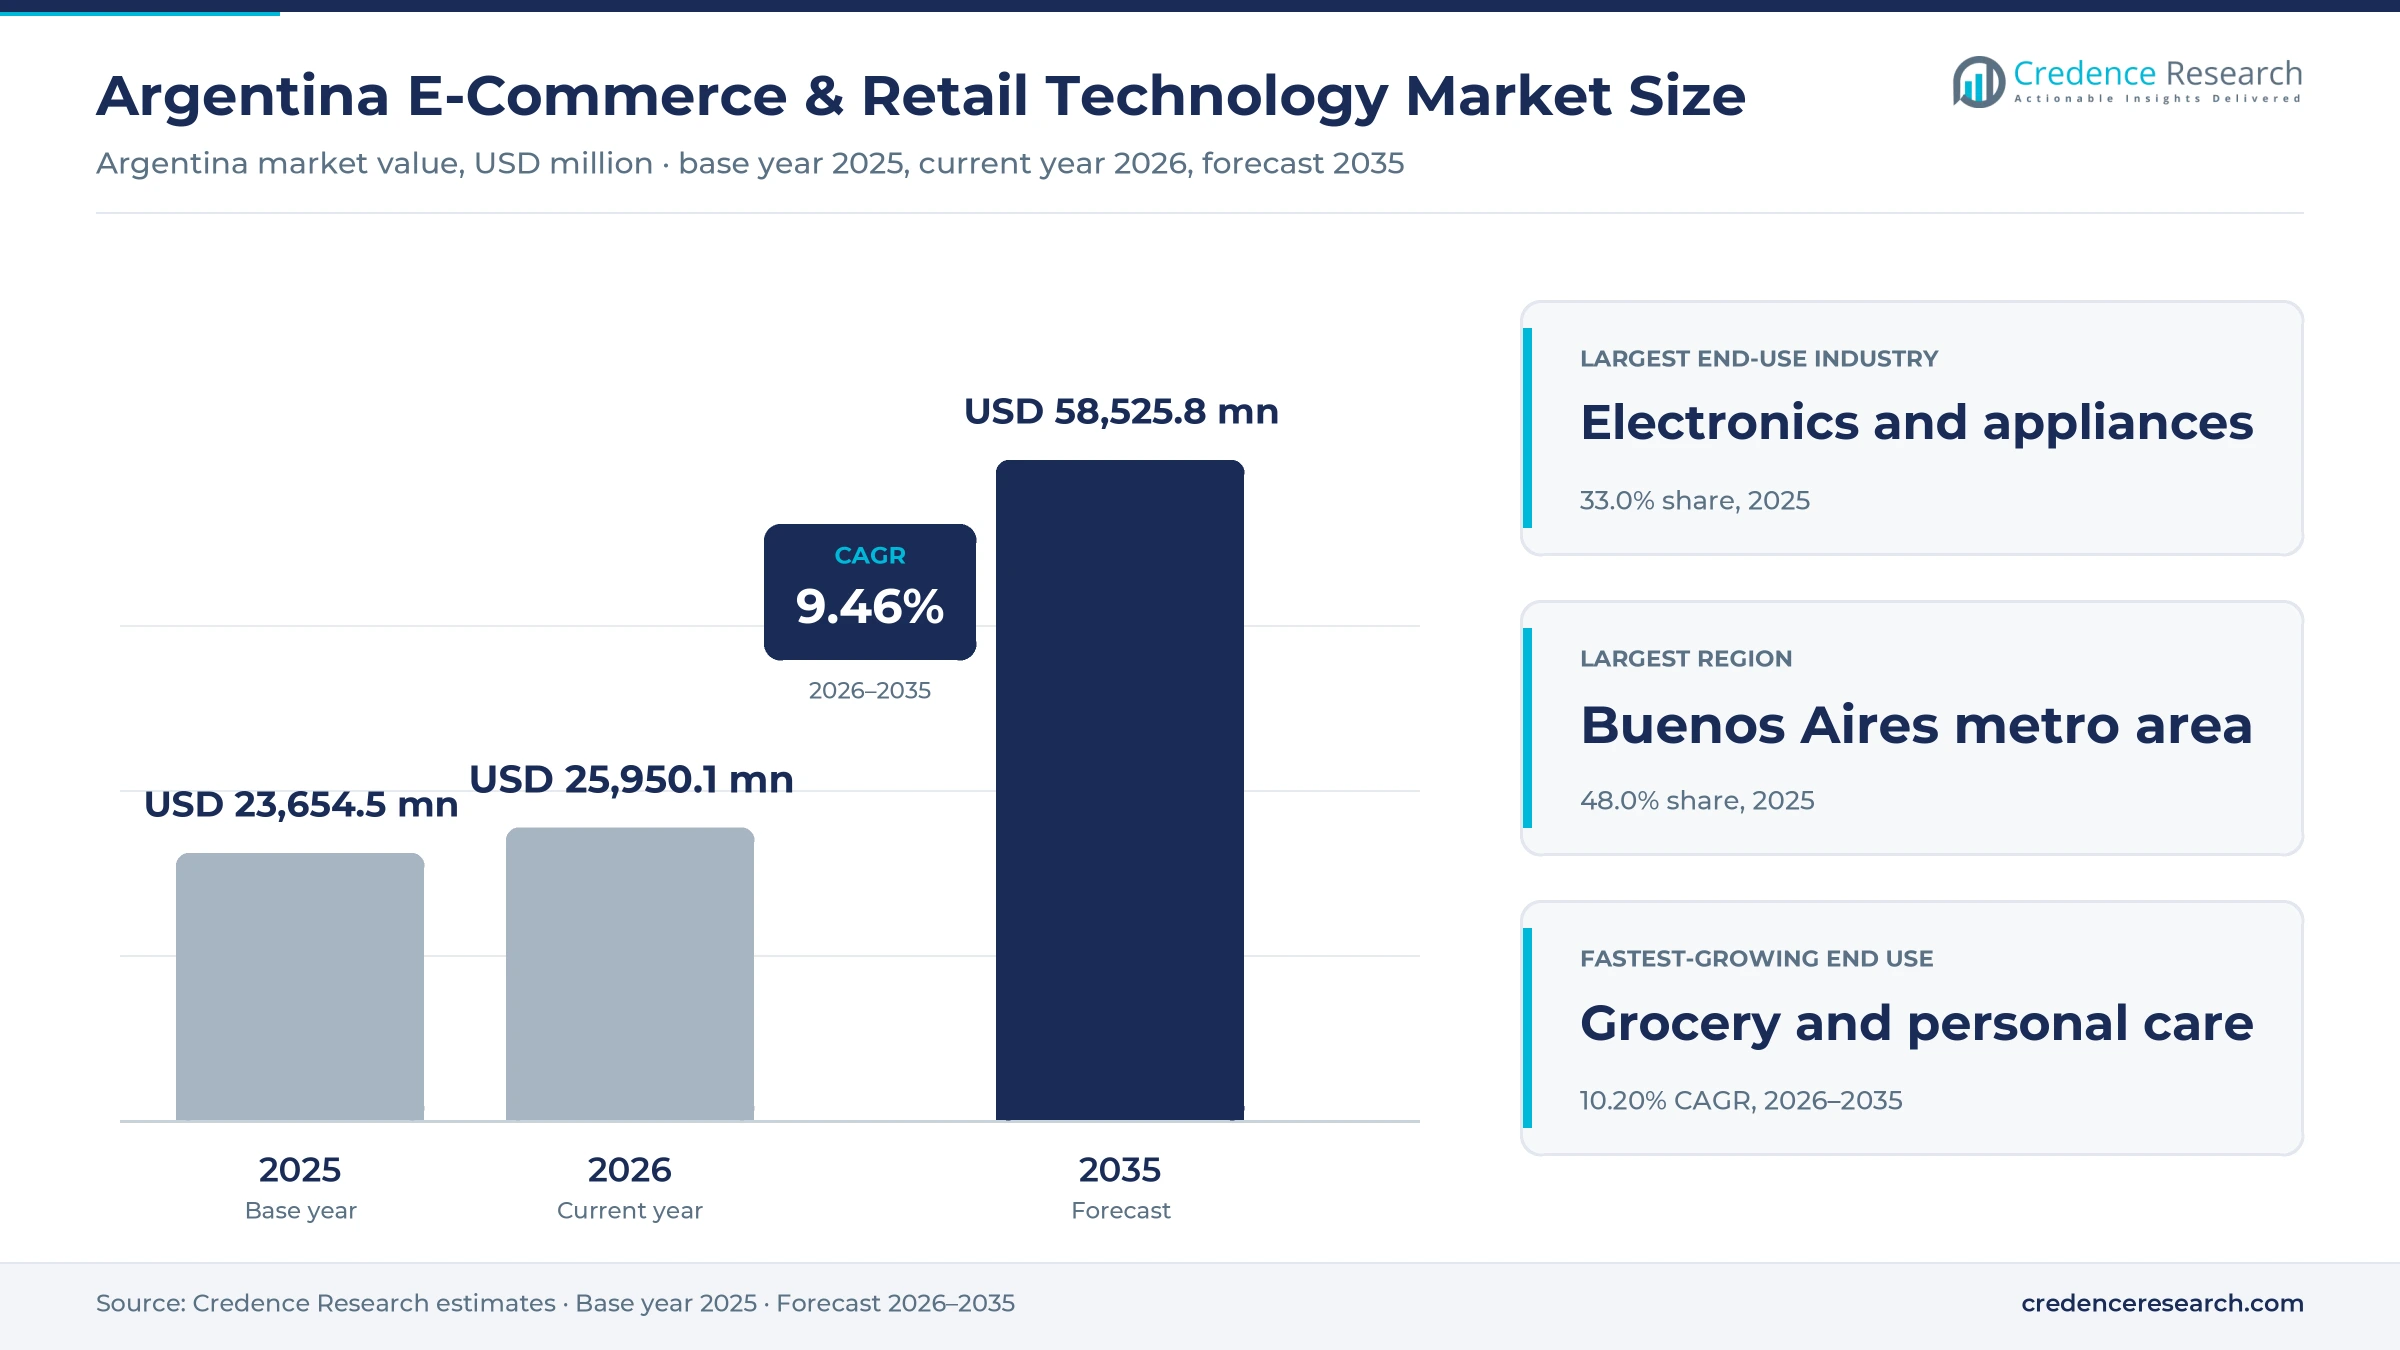
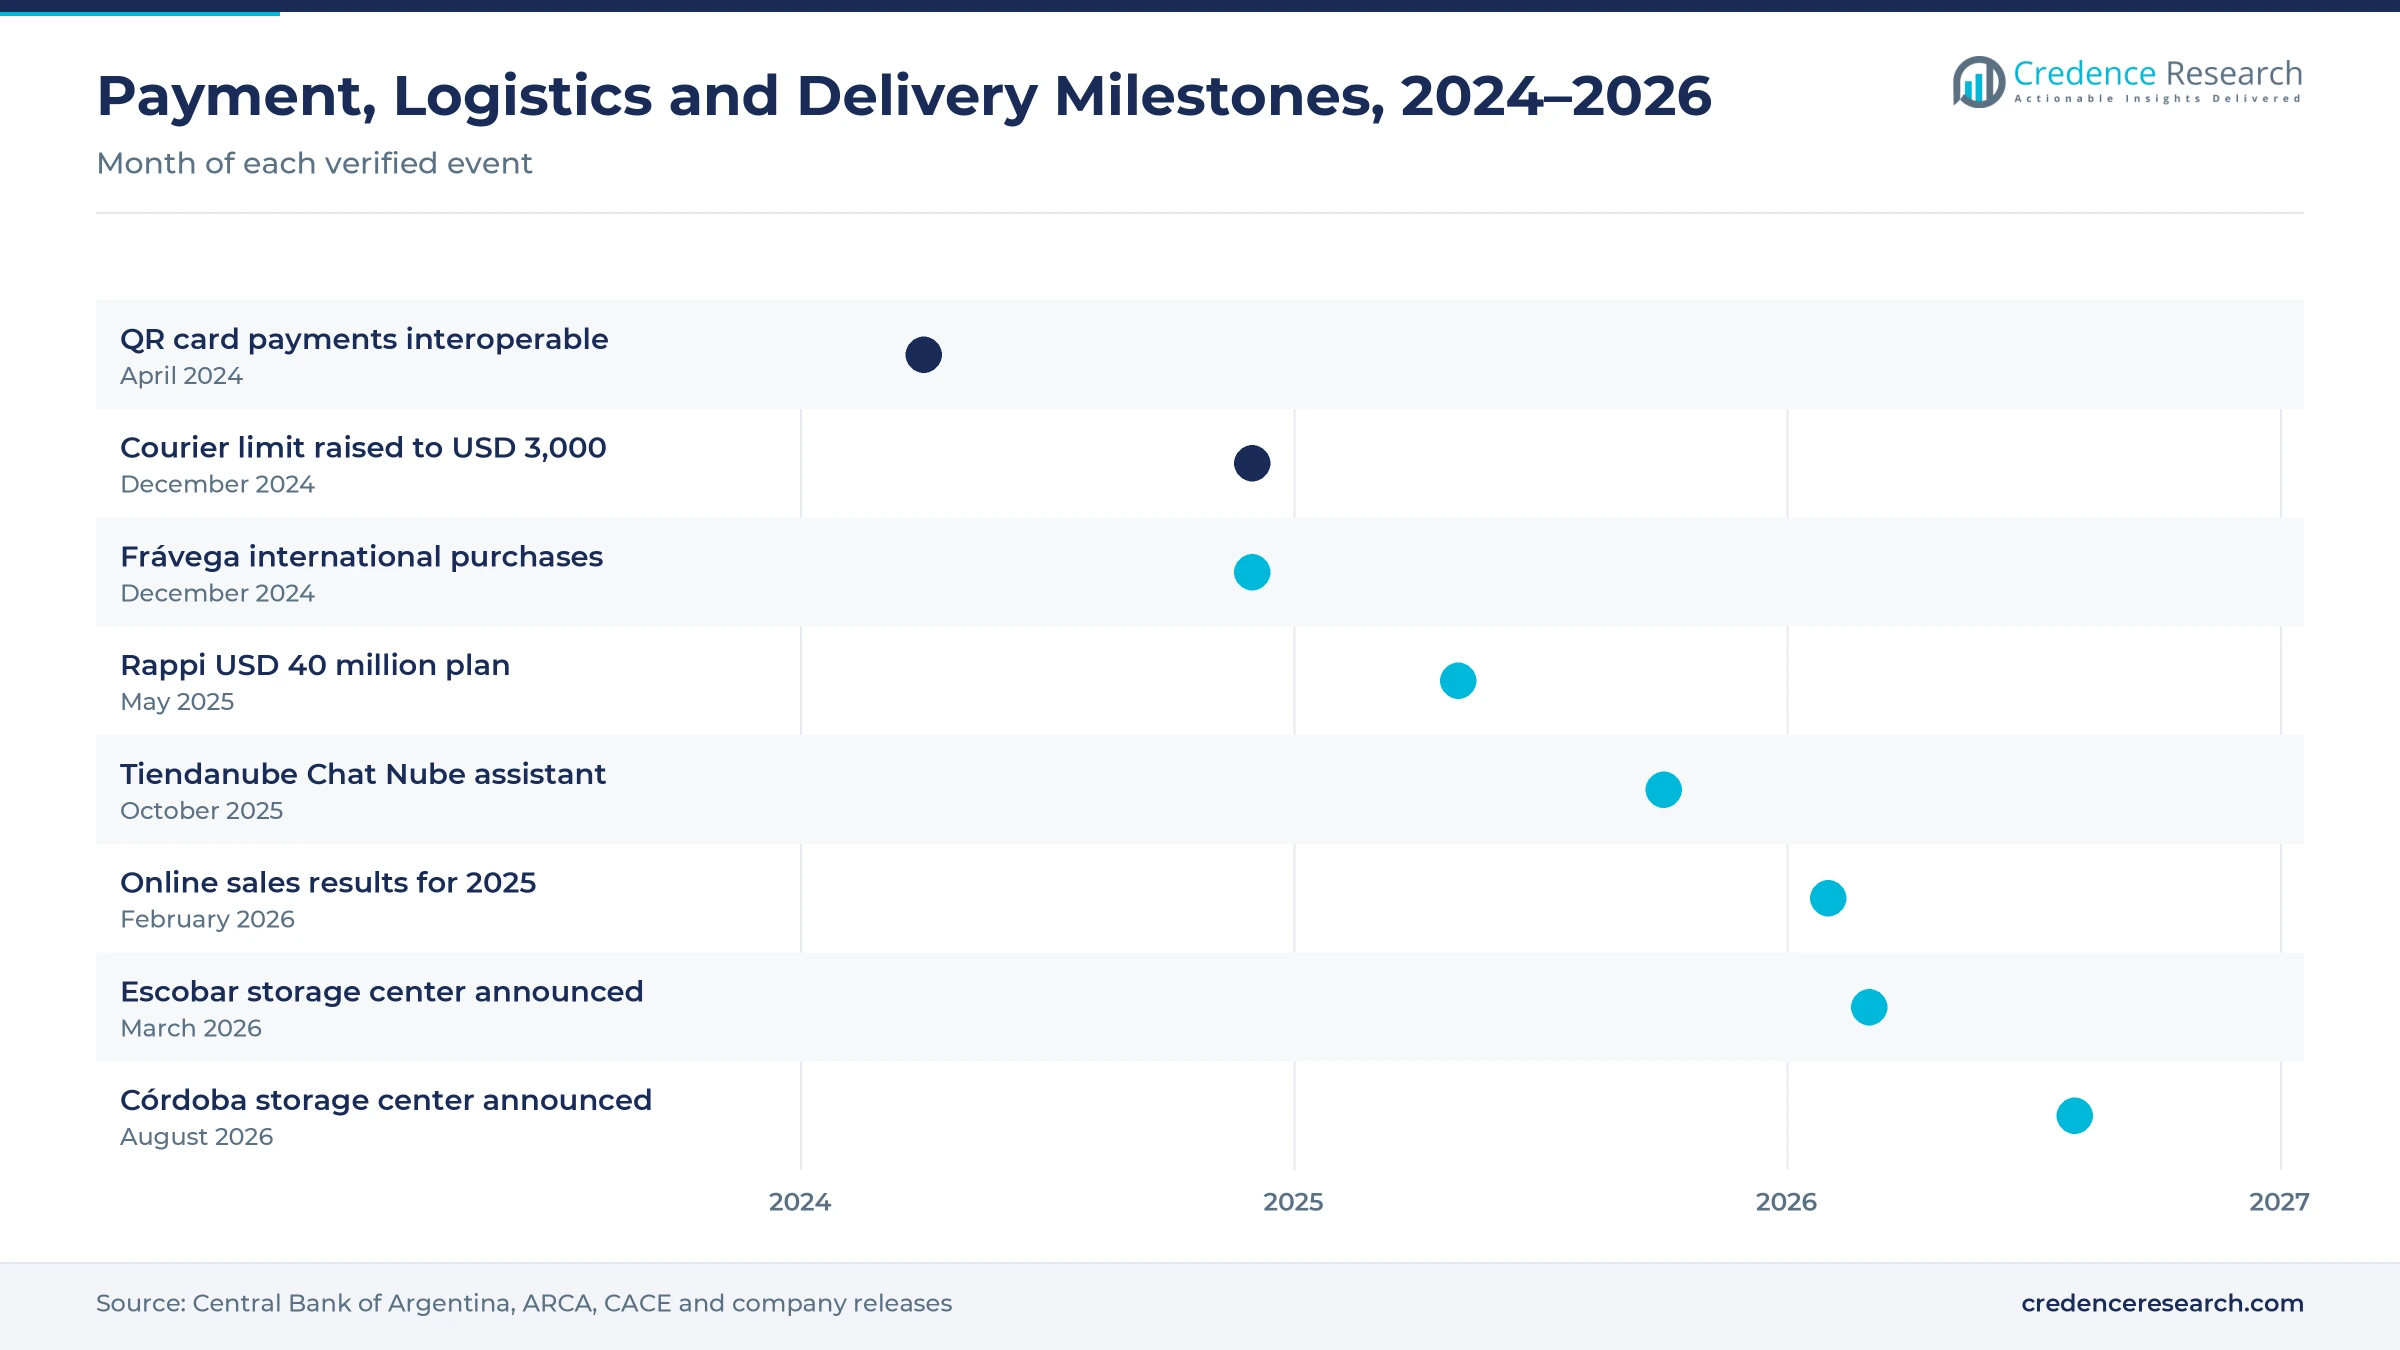
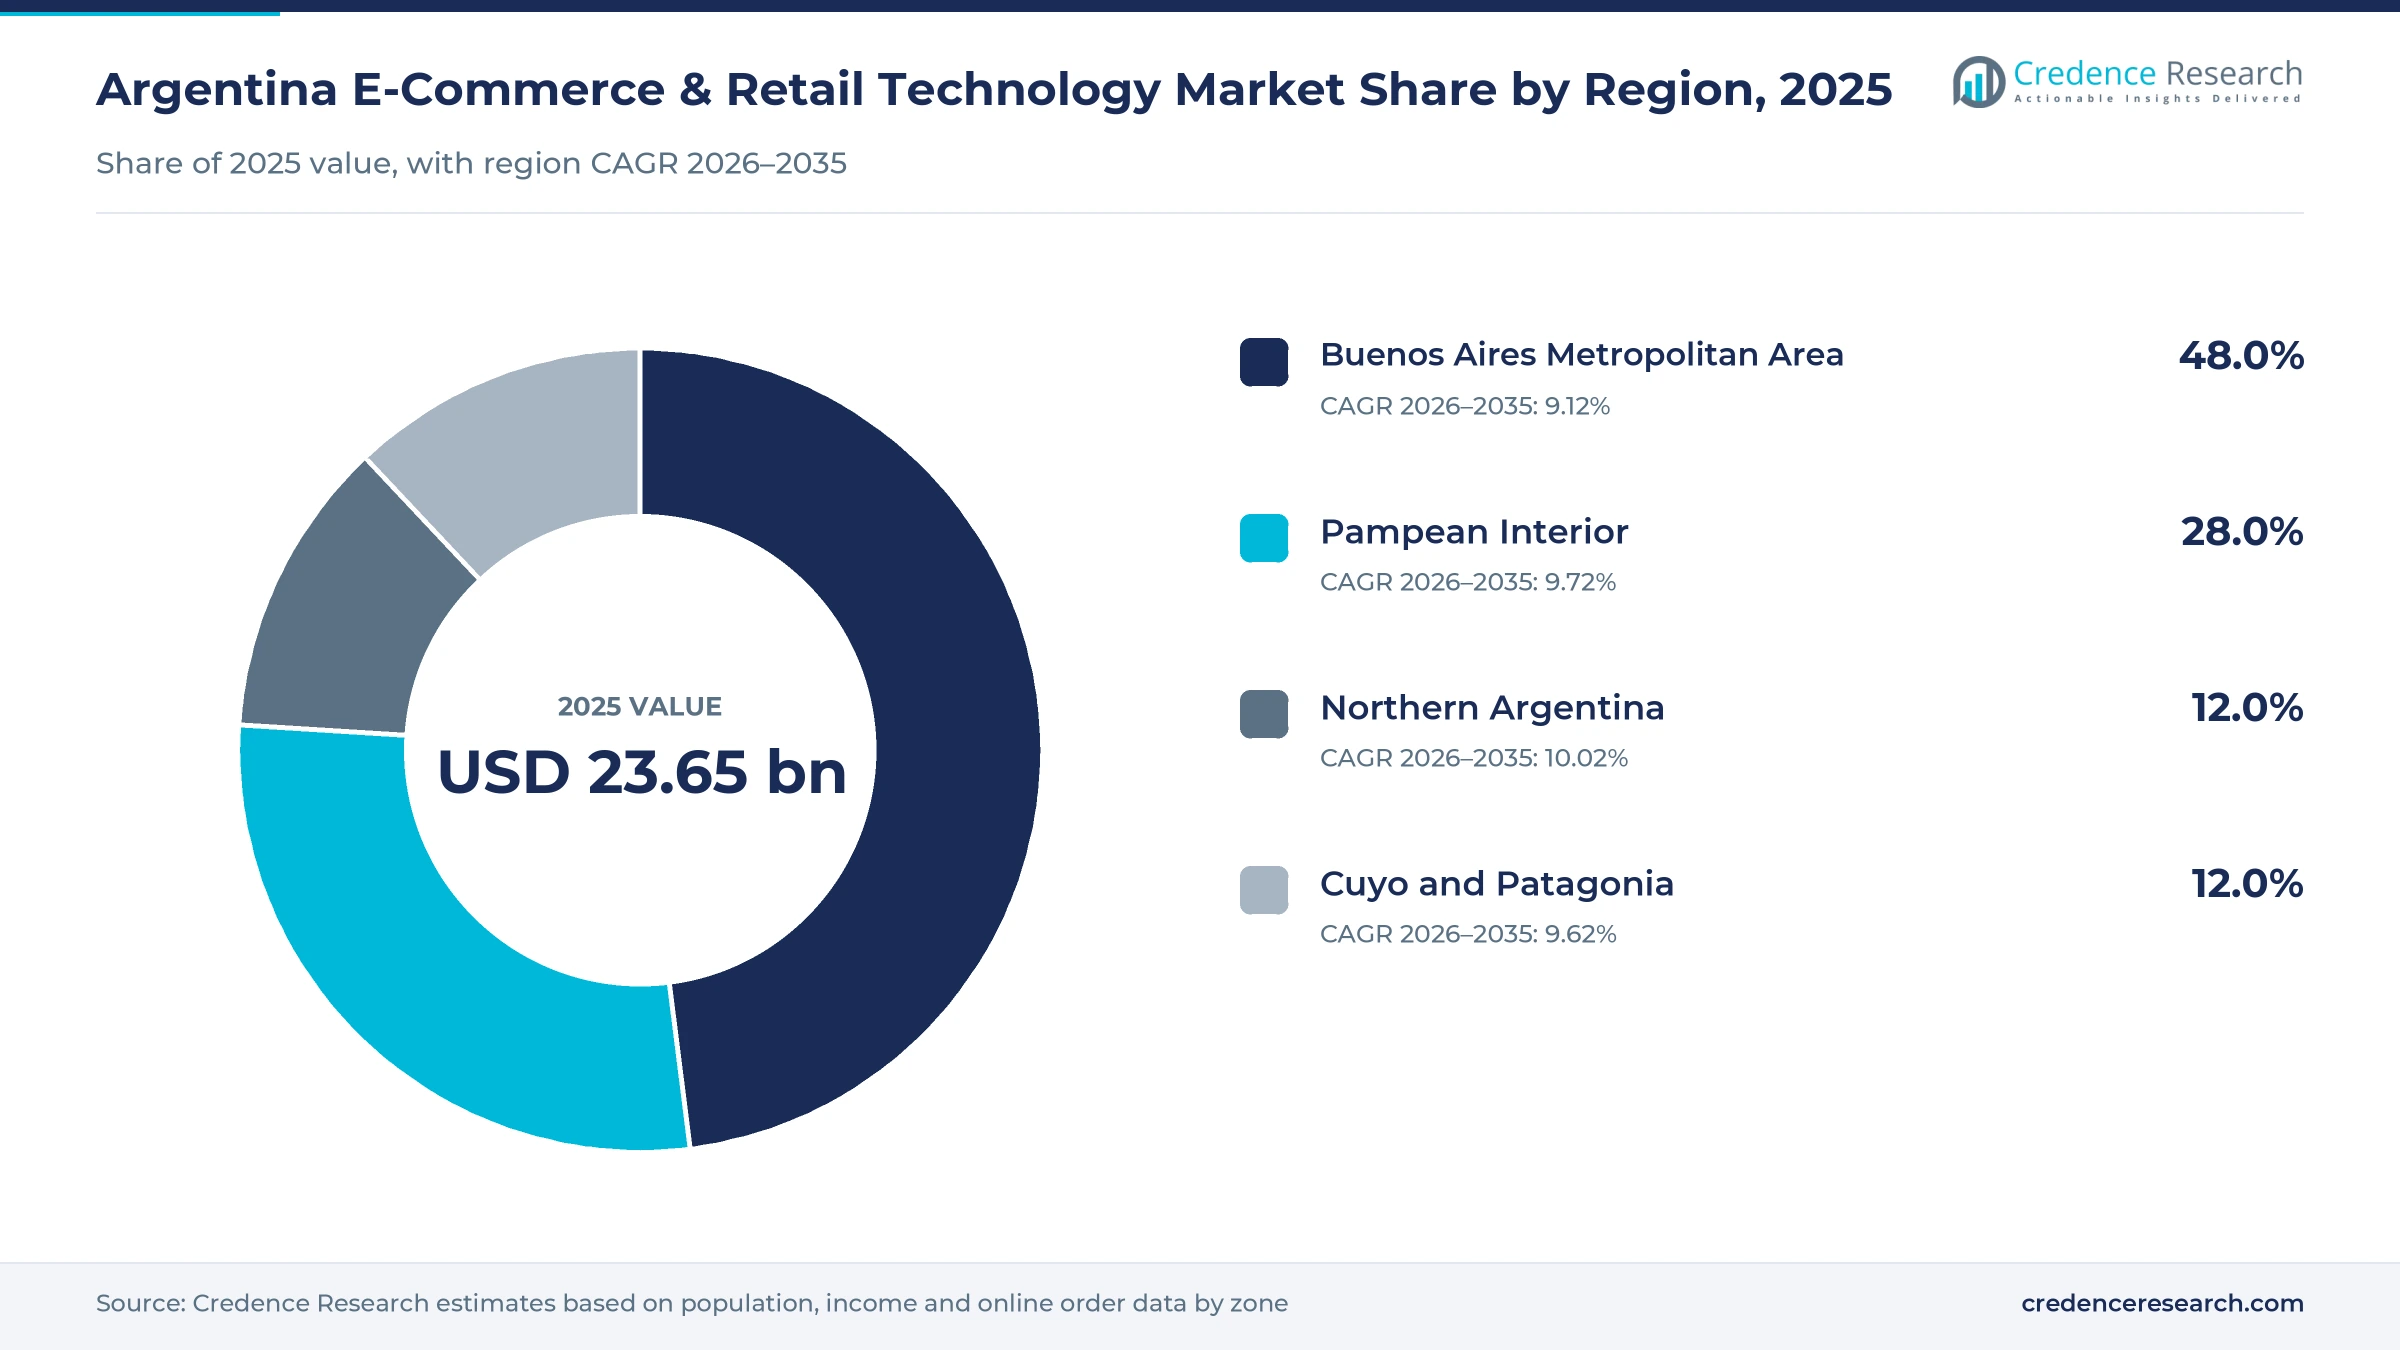
The Argentina e-commerce and retail technology market was valued at USD 23.65 billion in 2025 and is projected to increase from USD 25.95 billion in 2026 to USD 58.53 billion by 2035, registering a CAGR of 9.46% during 2026–2035. Spending comes from households that buy electronics, fashion, groceries and home goods through marketplaces, brand web stores and delivery apps, and from the payment, store-building and fulfillment services that carry each order. The Buenos Aires Metropolitan Area held the largest regional share, 48.0% in 2025, because the capital zone combines the densest buyer base with the main storage centers. Northern Argentina is the fastest-growing region at 10.02% a year, as inland storage capacity brings shorter delivery times to provinces that were served from the capital. The central bank made credit card payments through QR codes interoperable across all registered wallets in 2024, which let small shops accept cards without a terminal from each provider.
What does the Argentine online retail estimate count?
The estimate measures the value of retail goods sold online to buyers in Argentina, through marketplaces, retailer web stores, store-building platforms, delivery apps and payment links. Retail technology enters the estimate through the platforms that carry each sale, so the fees earned by marketplaces, store builders, wallets and logistics providers sit inside the value of goods sold and are not counted a second time.
The estimate excludes travel, event tickets, financial products and other services bought online, as well as purchases between businesses. The value chain runs from brands, importers and retailers through marketplace, store-building, payment and logistics providers to households in every province of the country.
Argentina E-Commerce & Retail Technology Market Insights
- The Argentina e-commerce and retail technology market was valued at USD 23.65 billion in 2025 and is projected to reach USD 58.53 billion by 2035, registering a CAGR of 9.46% during 2026–2035.
- The Buenos Aires Metropolitan Area held a 48.0% share of 2025 value, because the capital zone has the largest buyer base and the main storage centers.
- Electronics and appliances retail led with a 33.0% share of 2025 value, as high-ticket goods bought in installments dominate online baskets.
- Online sales in Argentina moved 645 million units in 2025, up more than 28% on the year, while orders rose only 3%.
- Mercado Libre planned to invest USD 3.4 billion in Argentina during 2026, with storage centers, platform technology and payment services among the main uses.
Electronics lead while grocery orders grow fastest
Why do transaction platforms carry most online sales?
Based on solution type, the market is categorized into E-Commerce Transaction Platforms, Payment Acceptance Technology, Merchant Commerce Software and Fulfillment Automation Technology. Each sub-segment counts the value of goods sold through the solution that enabled the sale. E-Commerce Transaction Platforms led with a 46.0% share of 2025 value, because marketplaces and retailer storefronts still close most orders. Merchant Commerce Software grows fastest at 10.19% a year, as small brands adopt store builders, chat assistants and seller analytics.
Why do electronics and appliances take the largest share?
Based on end-use industry, the market is categorized into Electronics and Appliances Retail, Fashion and Lifestyle Retail, Grocery and Personal Care Retail, and Home and Specialty Retail. Electronics and Appliances Retail led with a 33.0% share of 2025 value, because phones, televisions and appliances carry high tickets that buyers spread over card installments. Grocery and Personal Care Retail grows fastest at 10.20% a year, as dark stores bring short delivery windows to everyday baskets.
How do marketplaces shape the way sales are monetized?
Based on revenue model, the market is categorized into Commission-Based Commerce, Subscription-Based Services, Usage-Based Services and Direct Merchandise Sales. Each sub-segment counts the value of goods sold through platforms that earn money in that way, so direct merchandise sales cover retailers' own web stores. Commission-Based Commerce led with a 55.0% share of 2025 value, because most online orders still pass through marketplaces that charge sellers a fee on each sale. Subscription-Based Services grow fastest at 10.24% a year, as brands move to their own stores on monthly plans.
Which merchants generate the most online sales?
Based on enterprise size, the market is categorized into Micro Merchants, Small Retail Enterprises, Mid-Market Retail Enterprises and Large Retail Enterprises. Large Retail Enterprises led with a 40.0% share of 2025 value, because national chains and appliance retailers run the largest catalogs and logistics networks. Micro Merchants grow fastest at 10.11% a year, as wallets, QR codes and store builders cut the cost of selling online.
| Segment Group | Leading Sub-segment | Share, 2025 | Fastest-growing Sub-segment | CAGR, 2026–2035 |
|---|---|---|---|---|
| By Solution Type | E-Commerce Transaction Platforms | 46.0% | Merchant Commerce Software | 10.19% |
| By End-Use Industry | Electronics and Appliances Retail | 33.0% | Grocery and Personal Care Retail | 10.20% |
| By Revenue Model | Commission-Based Commerce | 55.0% | Subscription-Based Services | 10.24% |
| By Enterprise Size | Large Retail Enterprises | 40.0% | Micro Merchants | 10.11% |
Request a Free Sample
Fill in your details and we'll send you a free sample report.
- Sample data tables & charts
- Research methodology
Payments, logistics and merchant tools drive online sales
How do interoperable QR payments widen merchant acceptance?
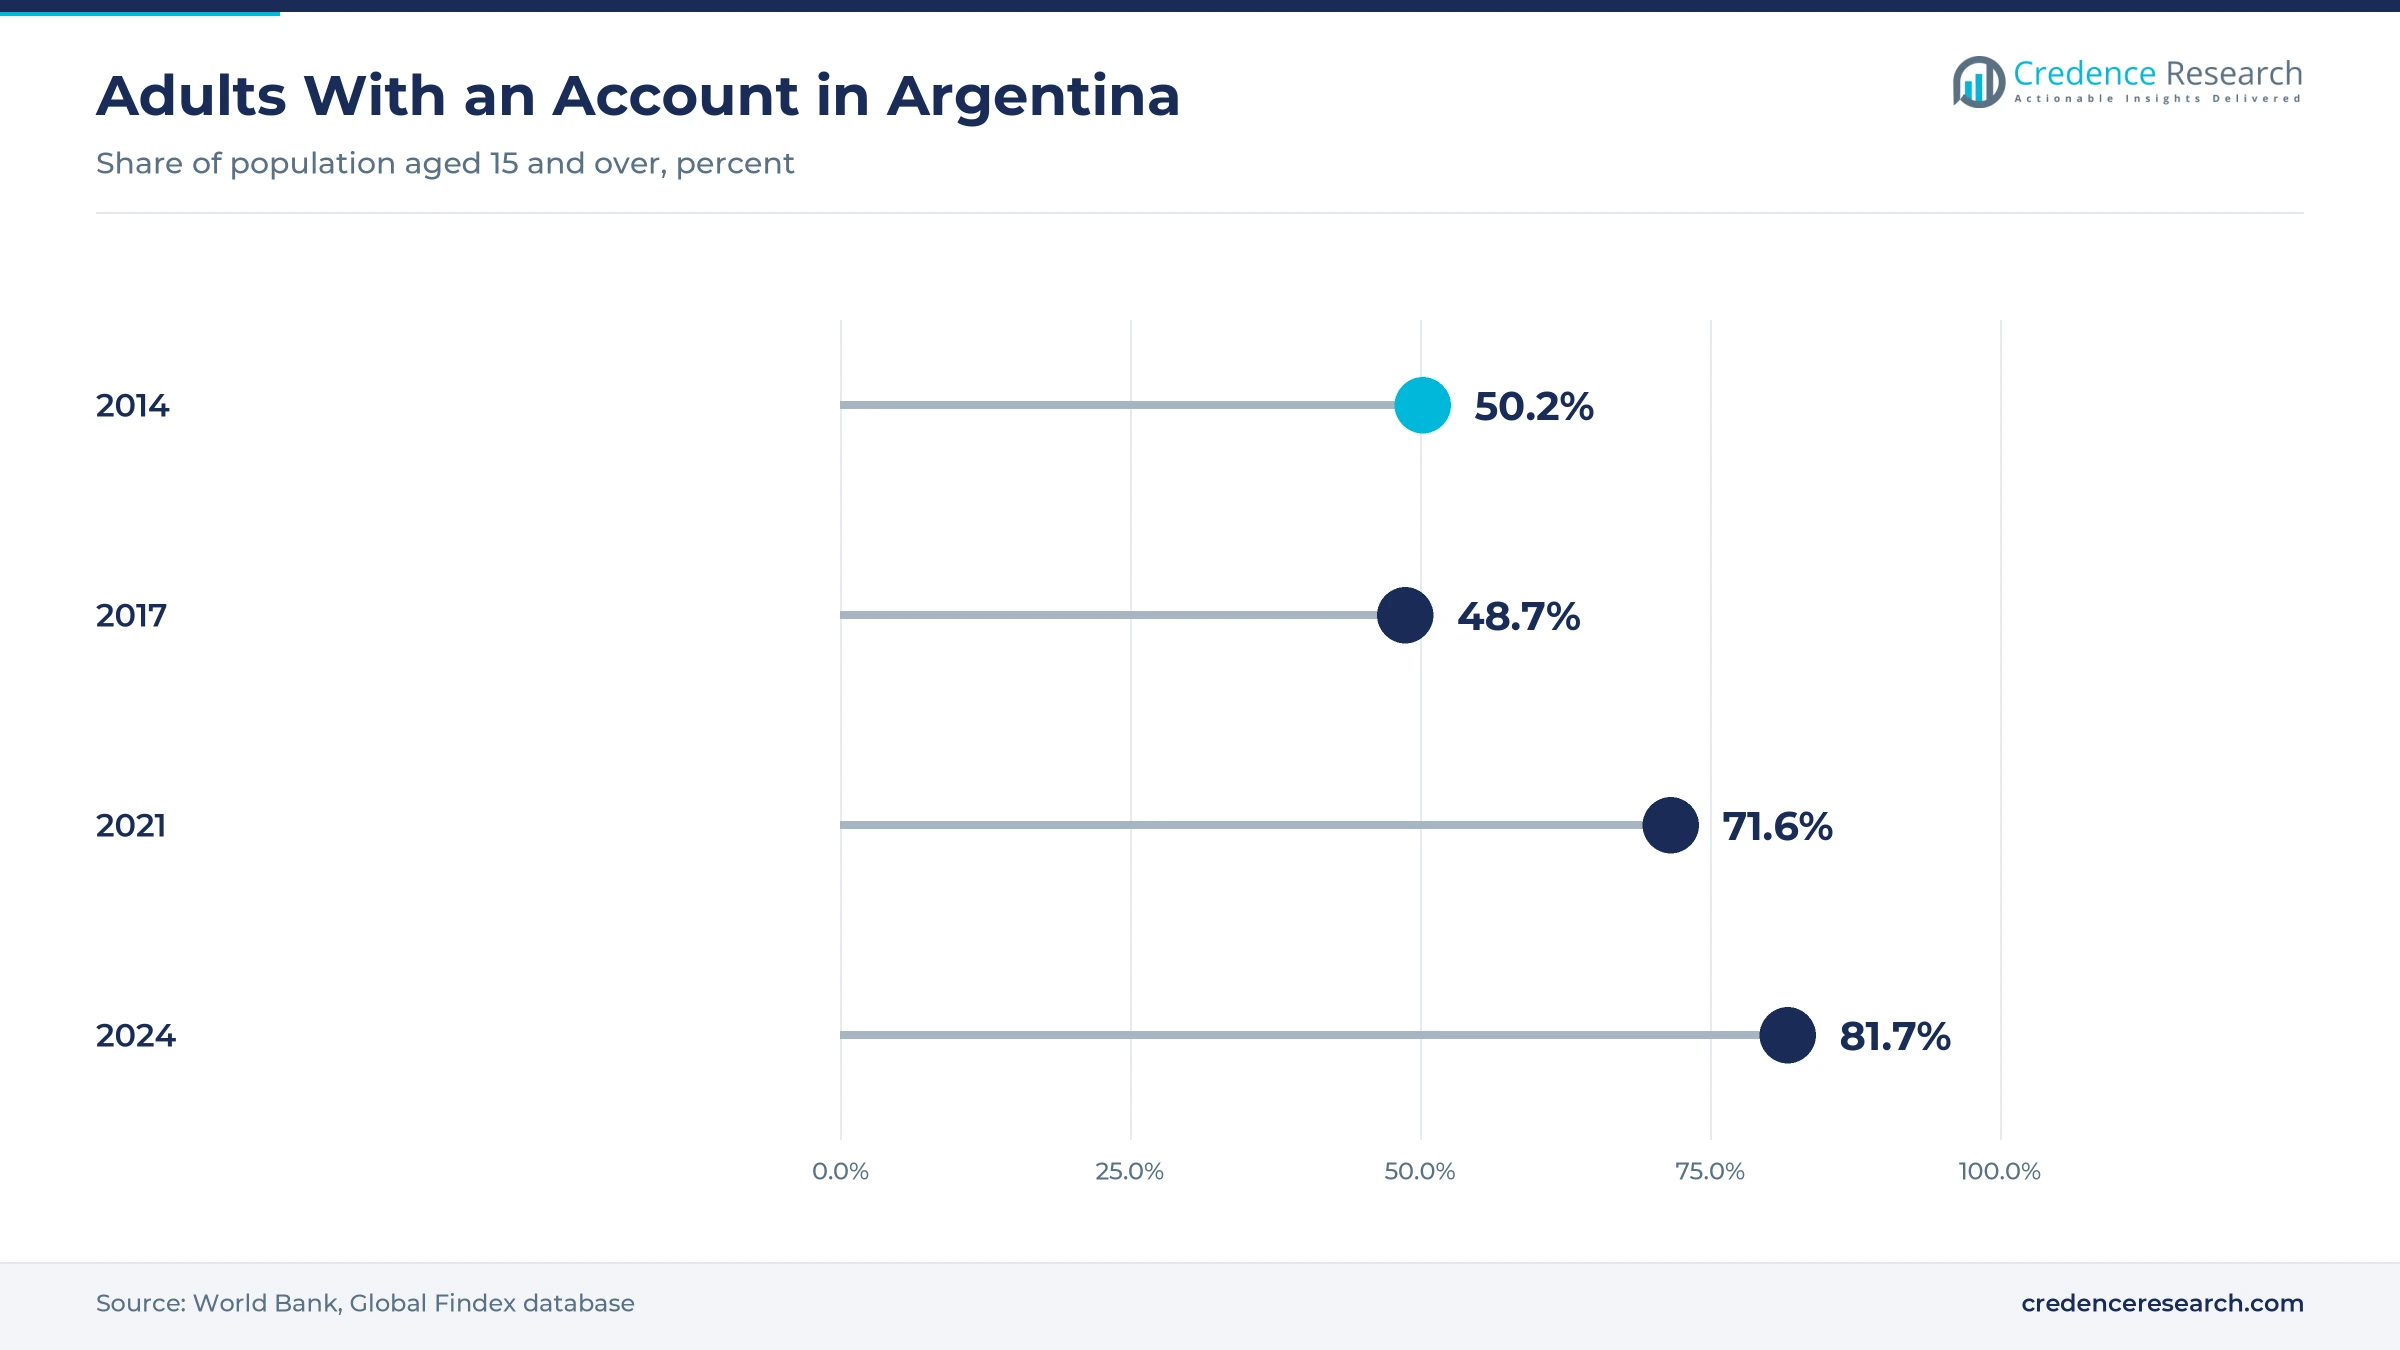
Interoperable payments let any registered wallet pay at any QR code, which lowers the cost for small shops to accept digital payments and sell through chat or payment links. According to the Central Bank of Argentina, interoperability for credit card payments through QR codes took effect on April 30, 2024, after successive delays. Communication A8032 then required every registered wallet that allows credit or prepaid card payments by QR to be interoperable. Account ownership among adults reached 81.7% in 2024, up from 71.6% in 2021, according to the World Bank. As a result, micro merchants grow fastest at 10.11% a year.
Why does marketplace infrastructure investment matter?
Marketplace operators are adding storage and delivery capacity, which shortens delivery times and lets sellers outside the capital reach national demand. Mercado Libre said it would invest USD 3.4 billion in Argentina during 2026 and create 1,900 jobs, with logistics, storage centers, platform technology and Mercado Pago among the uses, according to Revista Mercado. El Economista reported on March 18, 2026, that the company will build a USD 115 million storage center in Escobar with Plaza Logística, able to hold more than 2 million bulky items. Its USD 91 million center in Córdoba province will store up to 6 million products. In turn, commission-based commerce keeps 55.0% of 2025 value across Argentine online retail.
How does independent merchant digitization add new sellers?
Store builders and marketplace tools let small brands open an online channel without building their own systems, which steadily widens the seller base. Tiendanube reported that more than 65,000 brands sell through its platform in Argentina, and that their 2025 sales rose 73% to almost ARS 2 trillion, according to Revista Mercado. Orders on those stores rose 30% to almost 22 million, and units sold climbed 57% to more than 105.6 million. More than 3.5 million small businesses and entrepreneurs operated through Mercado Libre and Mercado Pago in 2025, and 67% of new sellers had never sold online before. Because of this, subscription-based services grow fastest at 10.24% a year.
Why do rising unit volumes support steady growth?
Argentine buyers now place more items in each online order, which raises volumes even when the number of orders barely moves. The Argentine Chamber of Electronic Commerce measured online sales of ARS 35.3 trillion in 2025, a nominal rise of 60% against annual inflation of 31%, according to Revista Mercado. Units sold rose more than 28% to 645 million, while orders grew 3% and the average ticket rose 55%. Food and beverages led by units, and children's goods, building materials, sports and household appliances all grew faster than the overall average. As a result, home and specialty retail gains share against electronics through 2035.
Cross-border buying and fast delivery reshape retail
How is cross-border buying changing local retail?
Looser import rules for small parcels are bringing foreign goods into Argentine online baskets, which pushes local retailers to add international catalogs. El Economista reported in December 2024 that the tax and customs agency ARCA raised the courier limit to USD 3,000 FOB under General Resolution 5608, with no duties on the first USD 400 of each personal shipment. Frávega said it would list products shipped from abroad with final prices including import costs, according to La Nación on Dec. 19, 2024. Mercado Libre had added foreign suppliers to its own platform the same week. In turn, local sellers compete on warranties, returns and payment in pesos.
Why is the shift toward fast grocery delivery gaining pace?
Delivery apps are building small urban warehouses that put groceries and personal care items at buyers' doors within minutes, which moves everyday spending online. PedidosYa Market runs 70 dark stores in 43 cities across 12 provinces, and its unit sales rose 34% through October 2025, according to Forbes Argentina. Rappi confirmed a USD 40 million investment over four years in May 2025 and planned to triple its Turbo stores from 20 to 60, according to La Nación. Turbo promises deliveries in 10 minutes from supermarkets, pharmacies and restaurants. As a result, grocery and personal care retail grows fastest at 10.20% a year.
Can inland storage centers open the northern provinces?
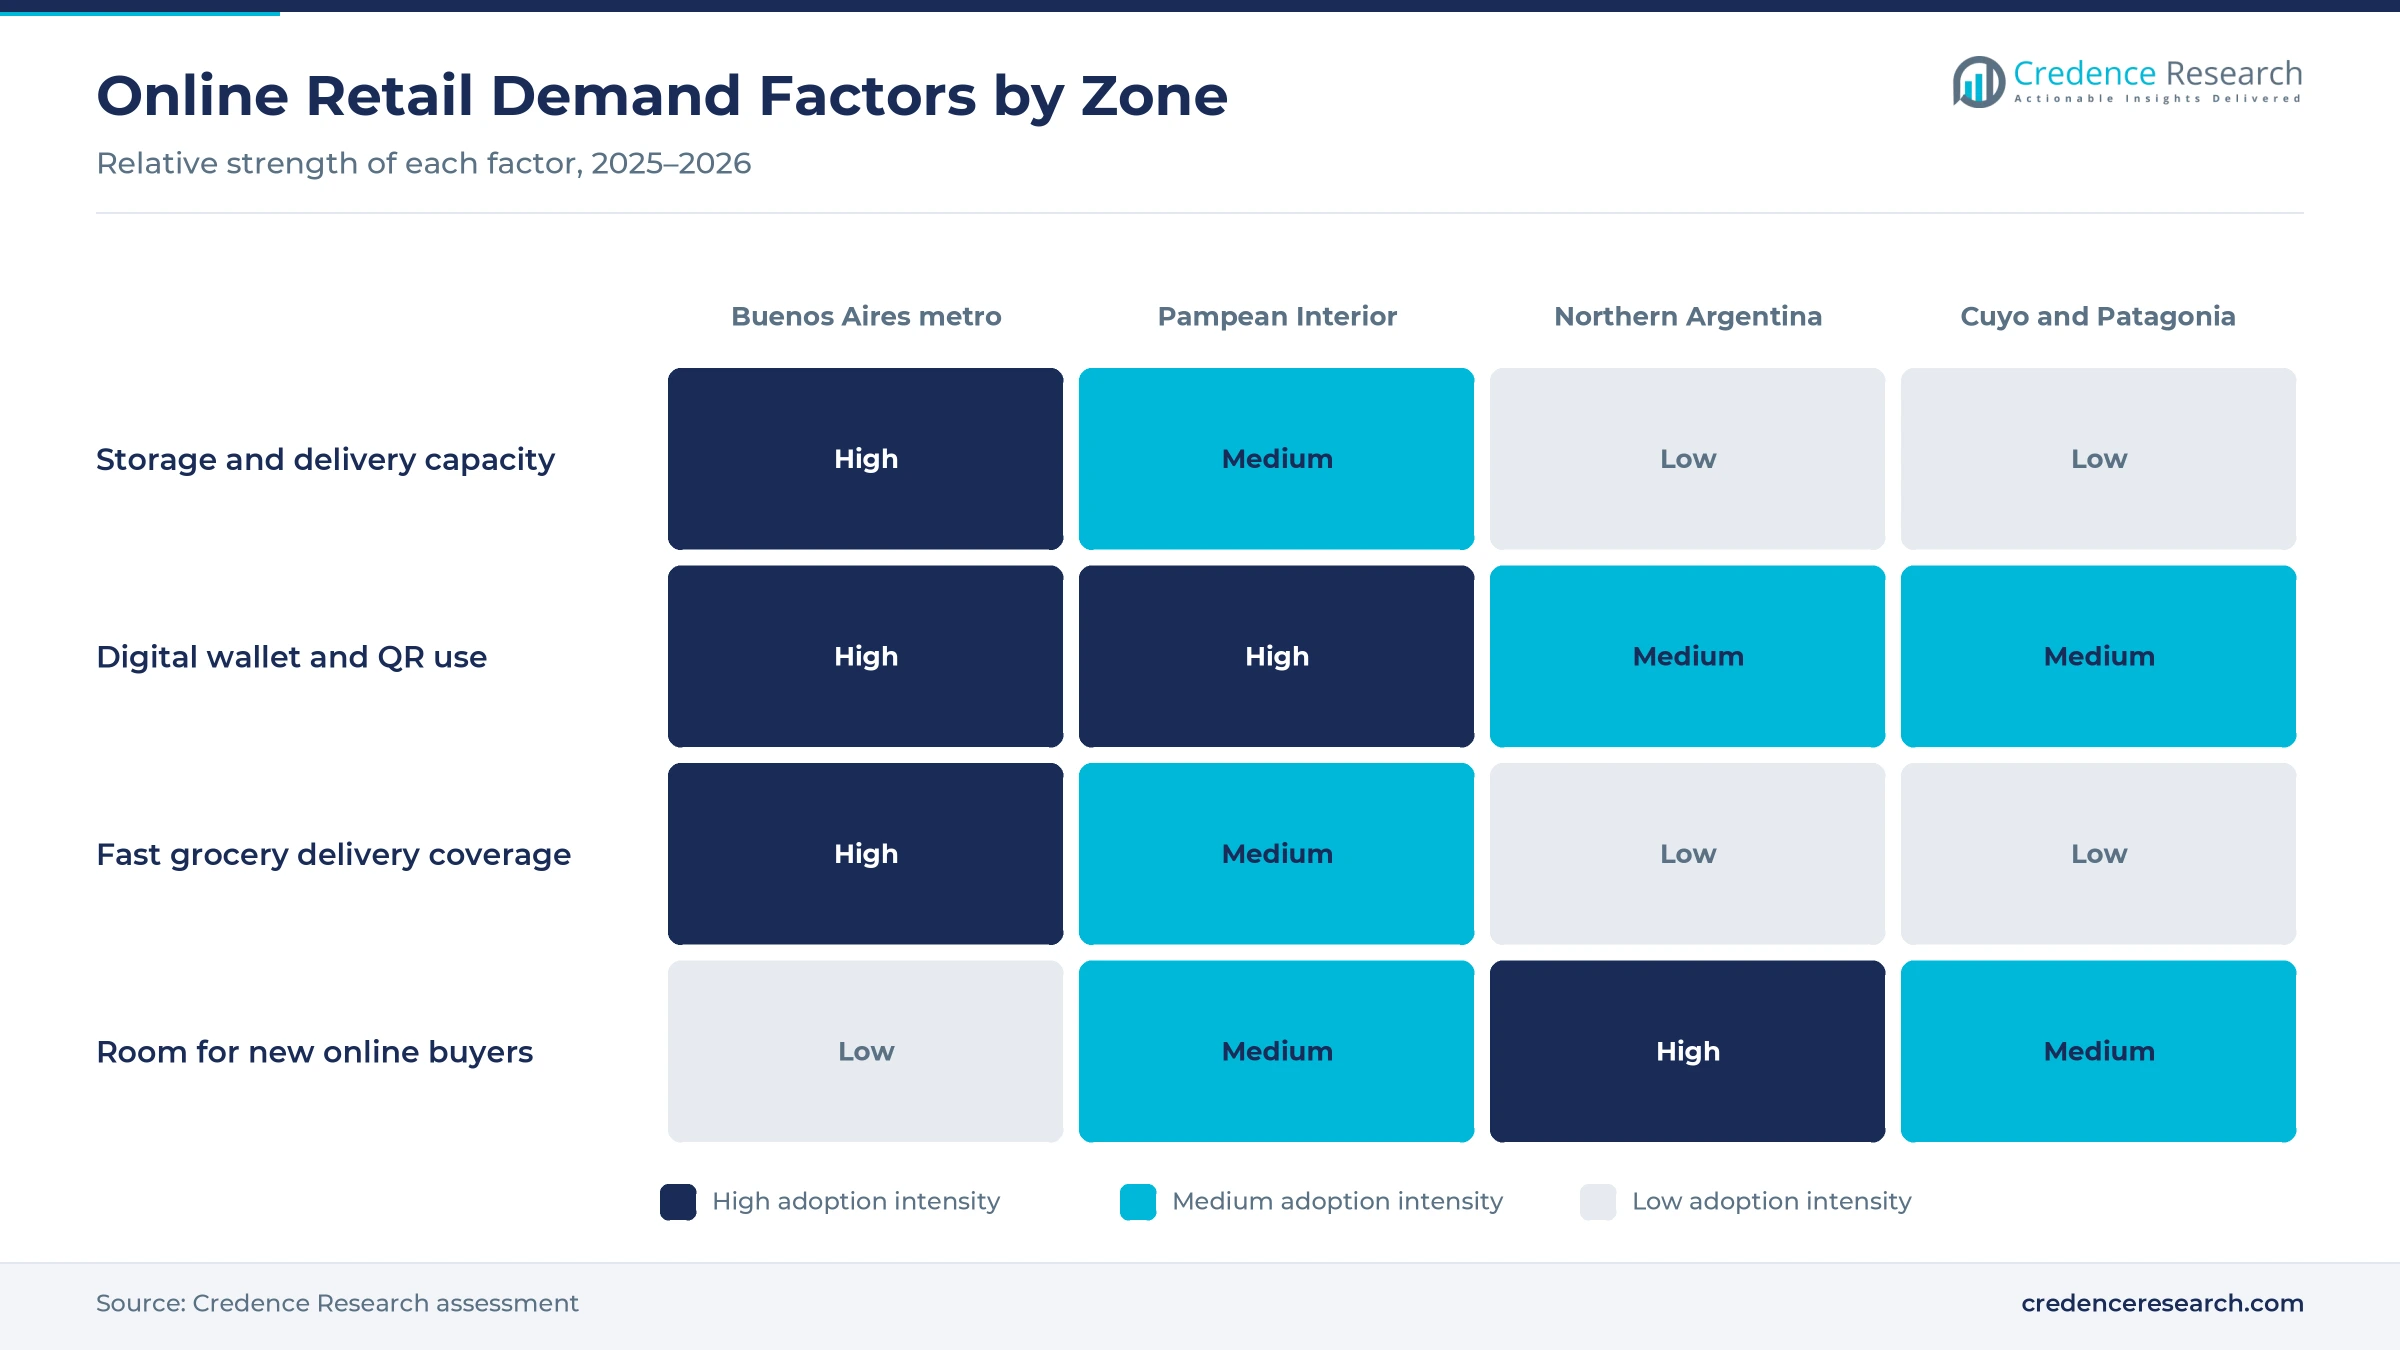
Storage capacity outside the capital creates an opening to serve provinces that have relied on long trips from Buenos Aires warehouses. Mercado Libre chose Estación Juárez Celman in Córdoba for its first storage center in the interior, a 60,000 square meter site due to open at the end of 2027, according to El Economista on Aug. 10, 2026. The center will supply last-mile depots in the central, northwest and northeast regions. Shorter delivery times should lift conversion for sellers and buyers in those provinces. In turn, Northern Argentina grows fastest among the zones, while the Pampean Interior grows at 9.72% a year.
Is there room for AI assistants in merchant service?
Conversational assistants give small merchants round-the-clock service in the chat apps that Argentine buyers already use, which opens a new layer of retail software spending. Tiendanube invested USD 10 million in artificial intelligence in 2025 and launched Chat Nube inside WhatsApp Business, according to Ámbito on Oct. 20, 2025. More than 1,000 brands had adopted the assistant, which resolves seven of every ten queries. Wise CX, an Argentine customer service platform with more than 1,500 clients, received a new investment from Wayra in February 2025, according to Telefónica. As a result, retention and service tools gain weight in merchant budgets.
Inflation, taxes and foreign platforms test local sellers
How does high inflation distort online retail budgets?
Fast price changes make nominal sales growth look strong while real volumes move far less, which complicates planning for retailers and platforms. Online sales grew far faster in nominal terms than in units or orders during 2025, according to the Argentine Chamber of Electronic Commerce. As a result, sellers must reprice often and protect margins on installment sales. Annual inflation fell from 117.8% in 2024 to 31.5% in 2025, according to INDEC, yet budgets for new platforms and integrations still depend on how quickly prices keep slowing.
Why do foreign platforms pressure local sellers?
The higher courier limit and duty-free threshold let foreign platforms ship directly to Argentine homes at low prices, which squeezes local brands in fashion and small electronics. Local sellers carry domestic taxes, wages and logistics costs that foreign shippers do not face in the same way. In turn, fashion and lifestyle retail grows below the market average through 2035. Local retailers respond with faster delivery, local warranties and installment payments in pesos.
How does weak household spending limit volumes?
Tight household budgets held back how many orders Argentine buyers could place, even as online sales gained share of retail spending. Orders grew only 5% in 2024 and 3% in 2025, according to the Argentine Chamber of Electronic Commerce, far below the rise in nominal sales. As a result, platforms compete harder for the same buyers through installments and free shipping. A recovery in real wages would lift order counts, but weak spending keeps growth uneven across categories.
Why does logistics concentration slow interior delivery?
Most storage capacity still sits around the city of Buenos Aires, which makes deliveries to the north and to Patagonia slower and more costly than in the capital zone. Mercado Libre's first interior storage center is not due to open before the end of 2027. In the meantime, sellers in Cuyo and Patagonia pay more per parcel and face longer delivery promises. This gap limits conversion in distant provinces until regional hubs and carrier networks expand.
Buenos Aires leads while the north grows fastest
| Region | Value, 2025 (USD billion) | Share, 2025 | CAGR, 2026–2035 |
|---|---|---|---|
| Buenos Aires Metropolitan Area | 11.35 | 48.0% | 9.12% |
| Pampean Interior | 6.62 | 28.0% | 9.72% |
| Northern Argentina | 2.84 | 12.0% | 10.02% |
| Cuyo and Patagonia | 2.84 | 12.0% | 9.62% |
Storage centers and dense demand keep the capital zone ahead
The Buenos Aires Metropolitan Area held a 48.0% share of 2025 value and grows at 9.12% a year. The zone combines the city of Buenos Aires with its suburbs, where most marketplace storage centers, including the planned Escobar site, are located. Rappi's Turbo stores operate in the city, La Plata, Mar del Plata, Lomas de Zamora and Vicente López. As a result, the capital zone keeps the largest share while its growth stays below the national rate.
Córdoba and Santa Fe anchor the Pampean Interior
The Pampean Interior held a 28.0% share of 2025 value and grows at 9.72% a year. The zone covers the rest of Buenos Aires province, Córdoba, Santa Fe, Entre Ríos and La Pampa, with large agricultural and industrial cities. Mercado Libre's USD 91 million storage center near Córdoba city will hold up to 6 million products from the end of 2027. In turn, delivery times in this zone are expected to shorten, which supports above-average growth.
Why does Northern Argentina grow fastest?
Northern Argentina held a 12.0% share of 2025 value and grows fastest at 10.02% a year. The northwest and northeast provinces have lower online spending per person today, which leaves more room for growth as wallets and QR payments spread. The planned Córdoba center will supply last-mile depots in both regions. As a result, the north gains share from the capital zone through 2035.
Cuyo and Patagonia rely on longer delivery routes
Cuyo and Patagonia held a 12.0% share of 2025 value and grow at 9.62% a year. Mendoza, San Juan and the Patagonian provinces sit far from the storage centers around Buenos Aires, which adds long shipping distances to every order. Higher parcel costs limit how much buyers in these provinces order online. In turn, growth in this zone depends on regional hubs and on local stores that sell through their own web channels.
Payment, logistics and delivery moves, 2024–2026
| Development | Status and market relevance |
|---|---|
| In December 2024, ARCA raised the courier import limit to USD 3,000 FOB per shipment under General Resolution 5608. | Opens Argentine online baskets to foreign goods |
| In May 2025, Rappi confirmed a USD 40 million investment in Argentina over four years and planned to triple its Turbo stores. | Expands fast grocery delivery in the capital zone |
| In February 2026, Visa agreed to acquire Prisma Medios de Pago and Newpay, while Payway stayed outside the deal as an independent acquirer. | Reshapes the merchant payments landscape |
| In March 2026, Mercado Libre announced a USD 115 million storage center in Escobar with Plaza Logística. | Adds capacity for bulky goods in the capital zone |
| In August 2026, Mercado Libre chose Córdoba province for a USD 91 million storage center due to open at the end of 2027. | Brings storage capacity to the interior |
Store builders, wallets and warehouse systems
- Store builders and marketplace tools give merchants catalogs, checkout and analytics without in-house systems, and Nubimetrics offers AI tools that suggest improvements to listings on Mercado Libre, which helps small sellers compete on search results.
- Wallets and QR acceptance let shops collect card and account payments from any registered wallet, which brings digital wallets into daily retail checkout across the country.
- Storage and dispatch systems run inventory, picking and routing in marketplace centers and dark stores, which cuts delivery times in dense urban areas.
Need a Custom Version of This Report?
Tailor the scope, geography, or segments to your exact requirements.
- Custom geography or segment scope
- Direct access to our analyst team
Mercado Libre leads as store builders and apps compete
Competition centers on marketplaces, store builders, delivery apps and payment providers that each control a different part of the order. Mercado Libre combines a marketplace, logistics network and Mercado Pago, and its ecosystem generated about 1% of Argentine output in 2025, according to Revista Mercado. Tiendanube serves brands that want their own web stores, while Frávega runs an appliance retail site that added international purchases in December 2024. PedidosYa and Rappi compete in fast delivery from dark stores and partner shops. Ualá Bis offers card readers, QR codes, payment links and web store integration for merchants, and Payway operates as an independent acquirer. Providers compete on delivery speed, payment terms and seller tools.
Which companies shape Argentine online retail?
| Company | Type | Role in the market |
|---|---|---|
| Mercado Libre | Marketplace and payments | Plans USD 3.4 billion of investment in Argentina in 2026, including storage centers |
| Tiendanube | Store-building platform | More than 65,000 Argentine brands sell through its stores |
| Frávega | Electronics and appliance retailer | Added international purchases to its online store in December 2024 |
| PedidosYa | Delivery app and dark stores | Runs 70 dark stores in 43 cities across 12 provinces |
| Rappi | Delivery app | Plans to triple Turbo stores in the Buenos Aires area from 20 to 60 |
| Ualá | Wallet and merchant acquiring | Ualá Bis offers card readers, QR codes and payment links to merchants |
| Payway | Merchant acquirer | Remains an independent acquirer outside the Visa purchase of Prisma |
| Nubimetrics | Seller analytics | Offers AI listing tools for Mercado Libre sellers |
| Wise CX | Customer service software | Argentine omnichannel service platform with more than 1,500 clients |
Credence Research view on Argentine online retail
Credence Research's view is that Argentine online retail will keep growing faster than store sales, because interoperable payments, marketplace logistics and low-cost store builders all reduce the cost of selling online. Marketplaces will keep the largest share of orders, yet brand-owned stores and chat-based selling will grow faster as micro merchants and small brands gain tools that once required large budgets. Inland storage centers should narrow the delivery gap between the capital and the provinces. Providers that combine payments, logistics and seller software are best placed to capture the Argentina e-commerce and retail technology opportunity through 2035.
How the Argentine online retail estimate was built
The report uses 2025 as the base year on a calendar basis, and market values come from the Credence Research model. That model combines online sales data from the national electronic commerce chamber, official exchange rate, internet and account ownership statistics from the World Bank, central bank payment rules and company announcements. Segment splits and zone shares and growth rates are Credence Research estimates built from population, income, online order patterns and fulfillment capacity by zone. Sources used are official statistics, regulations, trade body releases, news reports and company releases, and Credence Research conducted no interviews or surveys of its own for this report.
Small merchants and inland logistics lead growth to 2035
Spending is expected to reach USD 58.53 billion by 2035, a 9.46% CAGR during 2026–2035, as more buyers and merchants move everyday retail online. Growth should come from grocery and personal care orders, subscription-based store builders, micro merchants and the northern provinces. Steadier prices and lower taxes would raise real volumes, while renewed inflation or a surge in foreign parcels would weigh on local sellers. Investment in warehouse management systems and regional hubs is expected to decide which providers gain share by 2035.
Frequently Asked Questions
How big is the Argentina e-commerce and retail technology market?
Which end-use industry leads Argentine online retail?
Which region leads the Argentine market?
How did QR interoperability change merchant payments?
How fast did Argentine online sales grow in 2025?
Why are subscription-based store builders growing?
Which companies are active in the Argentine market?
What are the main challenges for online sellers in Argentina?
Table of Content
Chapter 1 Market Segmentation
- 1.1 Segmentation Framework
- 1.1.1 Product and Service Classification
- 1.1.2 Application and End-Use Classification
- 1.1.3 Technology and Solution Classification
- 1.1.4 Customer and Distribution Channel Classification
- 1.1.5 Geographic Segmentation
- 1.1.6 Market Segment Definitions and Boundaries
- 1.2 By Solution Type
- 1.2.1 E-Commerce Transaction Platforms
- 1.2.2 Payment Acceptance Technology
- 1.2.3 Merchant Commerce Software
- 1.2.4 Fulfillment Automation Technology
- 1.3 By End-Use Industry
- 1.3.1 Electronics and Appliances Retail
- 1.3.2 Fashion and Lifestyle Retail
- 1.3.3 Grocery and Personal Care Retail
- 1.3.4 Home and Specialty Retail
- 1.4 By Revenue Model
- 1.4.1 Commission-Based Commerce
- 1.4.2 Subscription-Based Services
- 1.4.3 Usage-Based Services
- 1.4.4 Direct Merchandise Sales
- 1.5 By Enterprise Size
- 1.5.1 Micro Merchants
- 1.5.2 Small Retail Enterprises
- 1.5.3 Mid-Market Retail Enterprises
- 1.5.4 Large Retail Enterprises
Chapter 2 Introduction
- 2.1 Report Objectives and Scope
- 2.2 Product Definition and Industry Terminology
- 2.3 Market Inclusions and Exclusions
- 2.4 Research Process
- 2.4.1 Primary Research and Expert Interviews
- 2.4.2 Secondary Research and Source Review
- 2.4.3 Top-Down and Bottom-Up Estimation
- 2.4.4 Data Triangulation and Verification
- 2.5 Market Size Measurement Basis
- 2.5.1 2025: USD 23.65 billion → 2035: USD 58.53 billion
- 2.6 Historical and Forecast Reference Periods
- 2.6.1 Historical Period: 2018-2025
- 2.6.2 Base Year: 2025
- 2.6.3 Forecast Period: 2025-2035
- 2.7 Research Assumptions and Limitations
Chapter 3 Executive Summary
- 3.1 Market Snapshot and Key Findings
- 3.2 Base-Year Market Size, 2025
- 3.3 Forecast Market Size, 2035
- 3.4 Revenue and Volume Growth Outlook
- 3.5 Key Demand and Supply Indicators
- 3.6 Leading Market Segments
- 3.7 Fastest-Growing Market Opportunities
- 3.8 Regional Performance Highlights
- 3.9 Technology and Industry Transformation
- 3.10 Competitive Landscape Summary
- 3.11 Analyst View and Strategic Implications
Chapter 4 Argentina E-Commerce & Retail Technology Market Trends and Developments
- 4.1 Historical Industry Development, 2018-2025
- 4.2 Recent Market Trends and Developments
- 4.3 Demand and Customer Behavior Trends
- 4.4 Technology and Product Innovation
- 4.5 Artificial Intelligence, Automation and Digitalization
- 4.6 Local Manufacturing and Supply Chain Realignment
- 4.7 Industry Partnerships, Mergers and Acquisitions
- 4.8 Sustainability and Circular Economy Developments
- 4.9 Government and Private Sector Investment Trends
- 4.10 Emerging Business Models and Commercialization
- 4.11 Industry Developments and Announcements
Chapter 5 Argentina E-Commerce & Retail Technology Market Production, Supply and Demand Analysis
- 5.1 Demand Trend and Consumption Analysis, 2018-2025
- 5.2 Demand Forecast, 2025-2035
- 5.3 Production and Output Trend, 2018-2025
- 5.4 Production and Output Forecast, 2025-2035
- 5.5 Installed Capacity and Capacity Utilization
- 5.6 Company-Wise Production Plants and Statistics
- 5.6.1 Installed Production Capacity
- 5.6.2 Actual Production
- 5.6.3 Planned Capacity and Expansion Targets
- 5.7 Supply Chain Structure and Procurement Trends
- 5.8 Supply-Demand Gap and Bottlenecks
- 5.9 Import Dependence and Sourcing Structure
- 5.10 Contract Manufacturing and Outsourcing
- 5.11 Regional Supply and Demand Concentration
Chapter 6 Argentina E-Commerce & Retail Technology Market Pricing Analysis
- 6.1 Pricing Structure and Measurement
- 6.2 Historical Pricing Trends, 2018-2025
- 6.3 Pricing Outlook, 2025-2035
- 6.4 Average Selling Price and Unit Economics
- 6.5 Pricing by Product and Market Segment
- 6.6 Geographic Pricing Differences
- 6.7 Key Input, Energy, Labor and Logistics Costs
- 6.8 Contract Pricing and Purchasing Models
- 6.9 Pricing Sensitivity and Competitive Positioning
- 6.10 Price, Margin and Profitability Implications
Chapter 7 Argentina E-Commerce & Retail Technology Market Dynamics
- 7.1 Market Growth Drivers
- 7.1.1 Demand-Side Drivers
- 7.1.2 Technology and Innovation Drivers
- 7.1.3 Infrastructure and Investment Drivers
- 7.1.4 Regulatory and Policy Drivers
- 7.2 Market Restraints
- 7.2.1 Cost and Affordability Constraints
- 7.2.2 Technology and Adoption Barriers
- 7.2.3 Supply Chain and Operational Constraints
- 7.3 Market Challenges
- 7.3.1 Competitive Pressure and Margin Erosion
- 7.3.2 Skills, Infrastructure and Implementation Gaps
- 7.4 Emerging Market Opportunities
- 7.5 Market Dynamics Impact and Time-Horizon Assessment
Chapter 8 Argentina E-Commerce & Retail Technology Value Chain Analysis
- 8.1 Industry Value Chain Overview
- 8.2 Upstream Suppliers and Critical Inputs
- 8.3 Technology and Component Providers
- 8.4 Manufacturing or Service Delivery
- 8.5 Distribution, Channel Partners and Integrators
- 8.6 Downstream Applications and End Users
- 8.7 Value Addition and Profit Pools
- 8.8 Vertical Integration and Outsourcing
- 8.9 Supplier Concentration and Risk
- 8.10 Supply Chain Localization and Resilience
Chapter 9 Argentina E-Commerce & Retail Technology Market Regulations and Policies
- 9.1 Relevant Laws, Standards and Compliance Frameworks
- 9.2 Product, Service, Safety and Quality Requirements
- 9.3 Government Policies, Incentives and Subsidies
- 9.4 Imports, Exports and Trade Barriers
- 9.5 Public Procurement and Local Content Requirements
- 9.6 Environmental and Sustainability Compliance
- 9.7 Data Protection, AI and Cybersecurity Compliance
- 9.8 Upcoming Policy Changes and Market Implications
Chapter 10 Argentina E-Commerce & Retail Technology Market Hotspots and Opportunities
- 10.1 Market Opportunity Mapping and Growth Hotspots
- 10.2 High-Growth Applications and Customer Groups
- 10.3 Underserved Markets and White-Space Opportunities
- 10.4 Emerging Technology and Product Opportunities
- 10.5 New Capacity and Investment Hotspots
- 10.6 Market Entry and Expansion Opportunities
- 10.7 Distribution and Partnership Opportunities
- 10.8 Near-Term and Long-Term Commercial Potential
- 10.9 Opportunity Attractiveness and Execution Risks
Chapter 11 Argentina E-Commerce & Retail Technology Market Outlook, 2025-2035
- 11.1 Market Size and Analysis
- 11.1.1 Revenue (Market Measurement: 2025: USD 23.65 billion → 2035: USD 58.53 billion)
- 11.1.2 Market Volume and Quantity Sold
- 11.1.3 Historical Market Size, 2018-2025
- 11.1.4 Base-Year Market Size, 2025
- 11.2 Market Forecast, 2025-2035
- 11.2.1 Revenue Forecast to 2035
- 11.2.2 Volume Forecast to 2035
- 11.2.3 CAGR and Year-on-Year Growth
- 11.2.4 Incremental Revenue Opportunity
- 11.3 Forecast Assumptions and Scenario Analysis
- 11.3.1 Base-Case Forecast
- 11.3.2 Optimistic and Conservative Scenarios
- 11.3.3 Technology, Pricing and Policy Sensitivities
- 11.4 Market Attractiveness and Growth Outlook
Chapter 12 Argentina E-Commerce & Retail Technology Market Segmentation and Outlook
- 12.1 Segmentation Summary and Market Shares, 2025
- 12.2 Largest and Fastest-Growing Segments
- 12.3 By Solution Type - Market Size and Forecast, 2025-2035
- 12.3.1 Segment Definition and Scope
- 12.3.2 Historical Market Size, 2018-2025
- 12.3.3 Revenue Forecast, 2025-2035
- 12.3.4 Volume Forecast, 2025-2035
- 12.3.5 Base-Year Market Share, 2025
- 12.3.6 Segment CAGR and Growth Drivers
- 12.3.7 Subsegment Market Size and Forecast
- 12.3.7.1 E-Commerce Transaction Platforms
- 12.3.7.2 Payment Acceptance Technology
- 12.3.7.3 Merchant Commerce Software
- 12.3.7.4 Fulfillment Automation Technology
- 12.3.8 Subsegment Pricing and Adoption Trends
- 12.3.9 Leading Suppliers and Competition
- 12.3.10 Regional Demand and Opportunities
- 12.4 By End-Use Industry - Market Size and Forecast, 2025-2035
- 12.4.1 Segment Definition and Scope
- 12.4.2 Historical Market Size, 2018-2025
- 12.4.3 Revenue Forecast, 2025-2035
- 12.4.4 Volume Forecast, 2025-2035
- 12.4.5 Base-Year Market Share, 2025
- 12.4.6 Segment CAGR and Growth Drivers
- 12.4.7 Subsegment Market Size and Forecast
- 12.4.7.1 Electronics and Appliances Retail
- 12.4.7.2 Fashion and Lifestyle Retail
- 12.4.7.3 Grocery and Personal Care Retail
- 12.4.7.4 Home and Specialty Retail
- 12.4.8 Subsegment Pricing and Adoption Trends
- 12.4.9 Leading Suppliers and Competition
- 12.4.10 Regional Demand and Opportunities
- 12.5 By Revenue Model - Market Size and Forecast, 2025-2035
- 12.5.1 Segment Definition and Scope
- 12.5.2 Historical Market Size, 2018-2025
- 12.5.3 Revenue Forecast, 2025-2035
- 12.5.4 Volume Forecast, 2025-2035
- 12.5.5 Base-Year Market Share, 2025
- 12.5.6 Segment CAGR and Growth Drivers
- 12.5.7 Subsegment Market Size and Forecast
- 12.5.7.1 Commission-Based Commerce
- 12.5.7.2 Subscription-Based Services
- 12.5.7.3 Usage-Based Services
- 12.5.7.4 Direct Merchandise Sales
- 12.5.8 Subsegment Pricing and Adoption Trends
- 12.5.9 Leading Suppliers and Competition
- 12.5.10 Regional Demand and Opportunities
- 12.6 By Enterprise Size - Market Size and Forecast, 2025-2035
- 12.6.1 Segment Definition and Scope
- 12.6.2 Historical Market Size, 2018-2025
- 12.6.3 Revenue Forecast, 2025-2035
- 12.6.4 Volume Forecast, 2025-2035
- 12.6.5 Base-Year Market Share, 2025
- 12.6.6 Segment CAGR and Growth Drivers
- 12.6.7 Subsegment Market Size and Forecast
- 12.6.7.1 Micro Merchants
- 12.6.7.2 Small Retail Enterprises
- 12.6.7.3 Mid-Market Retail Enterprises
- 12.6.7.4 Large Retail Enterprises
- 12.6.8 Subsegment Pricing and Adoption Trends
- 12.6.9 Leading Suppliers and Competition
- 12.6.10 Regional Demand and Opportunities
- 12.7 Segment Growth Comparison
- 12.8 Segment Attractiveness and Priority Matrix
Chapter 13 Argentina E-Commerce & Retail Technology End-Use and Application Market Outlook
- 13.1 End-Use Industry and Customer Demand Structure
- 13.2 Leading Applications and Customer Groups
- 13.3 End-Use Market Size, Share and Forecast
- 13.4 Major End-Use Industry Deep Dives
- 13.4.1 Customer Requirements and Use Cases
- 13.4.2 Demand and Replacement Cycles
- 13.4.3 Technical and Regulatory Considerations
- 13.4.4 Purchasing and Procurement Models
- 13.4.5 Leading Vendors and Distribution Channels
- 13.4.6 Forecast and Commercial Opportunities
- 13.5 Emerging Applications and Cross-Segment Demand
- 13.6 End-Use Industry Investment Priorities
Chapter 14 Argentina E-Commerce & Retail Technology Geographic Market Outlook, 2025-2035
- 14.1 Domestic Market Distribution and Demand Clusters
- 14.2 State- or Province-Wise Market Size and Forecast, 2025-2035
- 14.3 City and Metropolitan Market Outlook
- 14.4 Industrial, Manufacturing and Commercial Clusters
- 14.5 Geographic Concentration of Key End Users
- 14.6 Local Pricing and Purchasing Differences
- 14.7 Domestic Production Facilities and Capacity Map
- 14.8 Local Infrastructure and Project Pipeline
- 14.9 State-Level Policy and Incentive Differences
- 14.10 Subnational Investment Hotspots and Opportunities
- 14.11 Distribution and Logistics Networks
- 14.12 Domestic Competitive Footprint
Chapter 15 Argentina E-Commerce & Retail Technology Technology, Innovation and Sustainability Outlook
- 15.1 Technology Landscape and Maturity
- 15.2 Product, Process and Service Innovation
- 15.3 AI, Automation and Digital Tools in the Industry
- 15.4 Technology Adoption and Performance Benchmarking
- 15.5 Innovation Pipeline and R&D Investment
- 15.6 Patent and Intellectual Property Trends
- 15.7 Energy Efficiency and Resource Management
- 15.8 Sustainability, Recycling and Circularity
- 15.9 Technology Roadmap, 2025-2035
- 15.10 Risks of Obsolescence and Technology Substitution
Chapter 16 Argentina E-Commerce & Retail Technology Market Key Strategic Imperatives
- 16.1 Growth and Market Entry Priorities
- 16.2 High-Return Products and Segments
- 16.3 Pricing, Profitability and Cost Optimization
- 16.4 Technology Investment and Product Differentiation
- 16.5 Supply Chain Localization and Resilience
- 16.6 Distribution and Customer Acquisition
- 16.7 Partnership, Acquisition and Capacity Strategy
- 16.8 Regional Expansion Priorities
- 16.9 Short-, Medium- and Long-Term Actions
Chapter 17 Competition Outlook
- 17.1 Industry Competition Characteristics
- 17.2 Market Structure and Concentration
- 17.3 Market Share and Competitive Positioning, 2025
- 17.4 Company-Wise Revenue and Product Benchmarking
- 17.5 Production and Service Capacity Benchmarking
- 17.6 Technology, Pricing and Differentiation
- 17.7 Regional Footprint and Distribution Strength
- 17.8 Mergers, Acquisitions and Strategic Alliances
- 17.9 New Entrants and Competitive Threats
- 17.10 Porter's Five Forces and Industry Attractiveness
- 17.11 Competitive Outlook, 2025-2035
Chapter 18 Company Profiles
- 18.1 Company Coverage and Selection Criteria
- 18.2 Mercado Libre
- 18.2.1 Business Description
- 18.2.2 Company Ownership and Geographic Presence
- 18.2.3 Product and Service Portfolio
- 18.2.4 Manufacturing and Operating Footprint
- 18.2.5 Production Capacity and Expansion Plans
- 18.2.6 Financial Performance and Investment
- 18.2.7 Market Share and Competitive Position
- 18.2.8 Technology and Innovation Capabilities
- 18.2.9 Strategic Alliances or Partnerships
- 18.2.10 Recent Developments
- 18.2.11 Growth Strategy and Outlook
- 18.3 Tiendanube
- 18.4 Frávega
- 18.5 PedidosYa
- 18.6 Rappi
- 18.7 Payway
- 18.8 Ualá
- 18.9 VTEX
- 18.10 Nubimetrics
- 18.11 Wise CX
- 18.12 Other Relevant Market Participants
Note: Every listed company is profiled on the structure shown under the first company. The company list is preliminary and may change based on research findings, market developments, data availability and client requirements.
Chapter 19 Disclaimer
- 19.1 Research and Forecast Disclaimer
- 19.2 Data Source and Estimation Limitations
Note: The depth of individual sections depends on data availability for this market. Volume, capacity, trade and other unit-based metrics are included where applicable.

