
Fiber cables become continuous sensors for asset owners
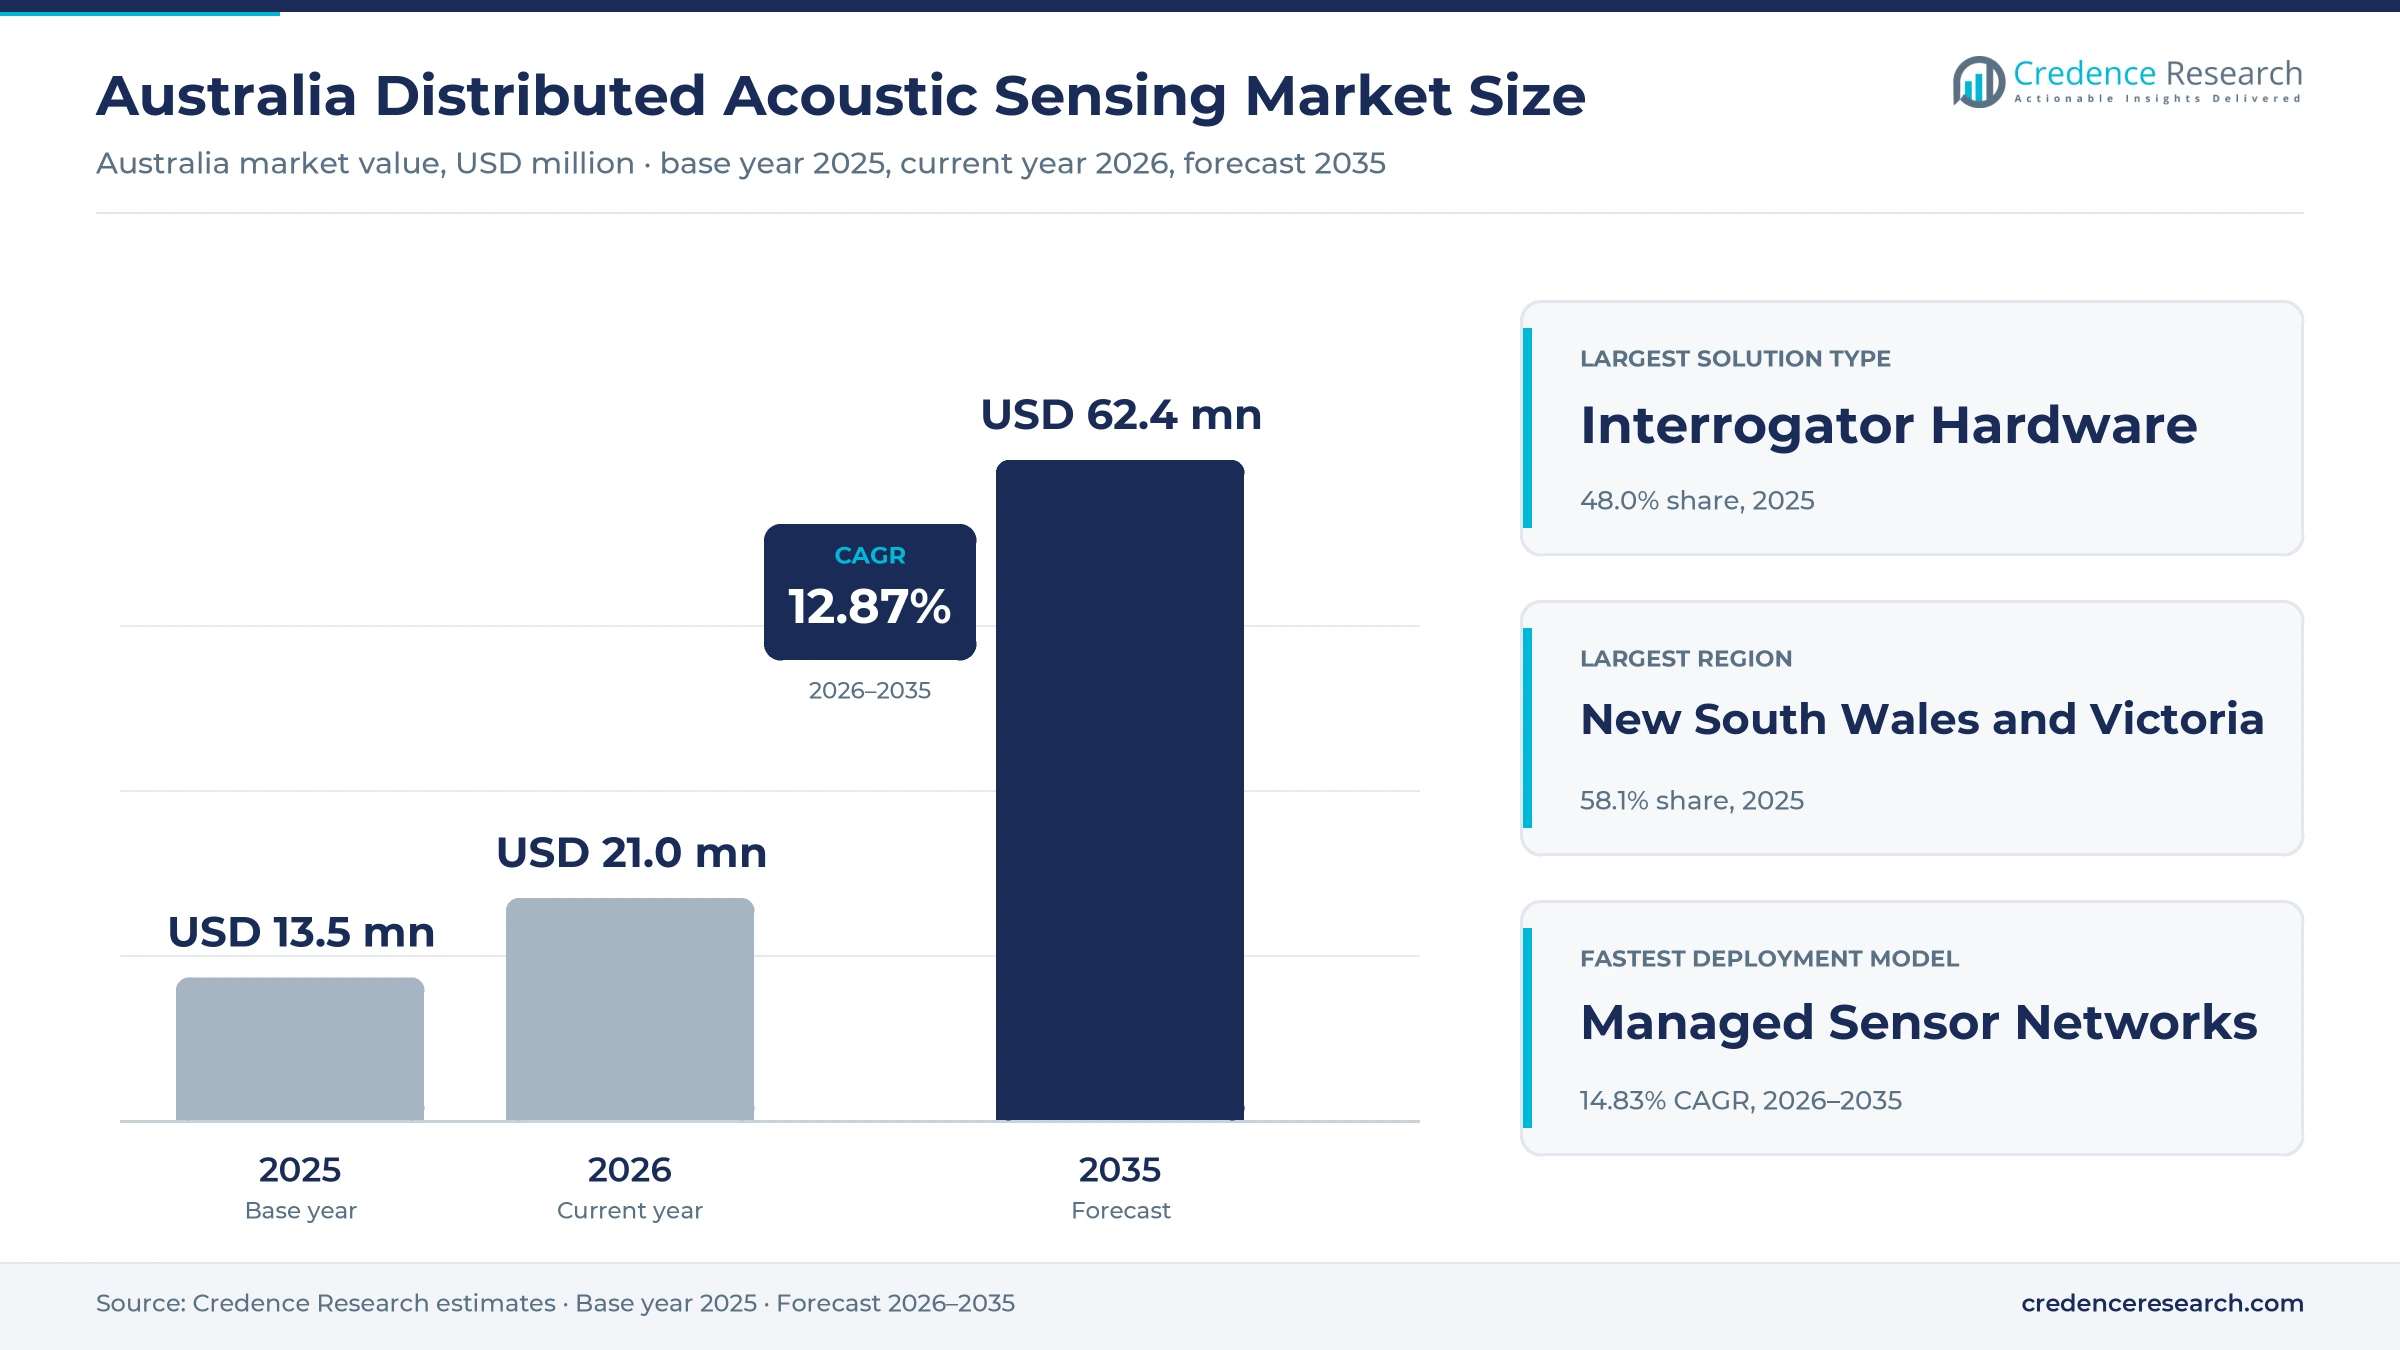
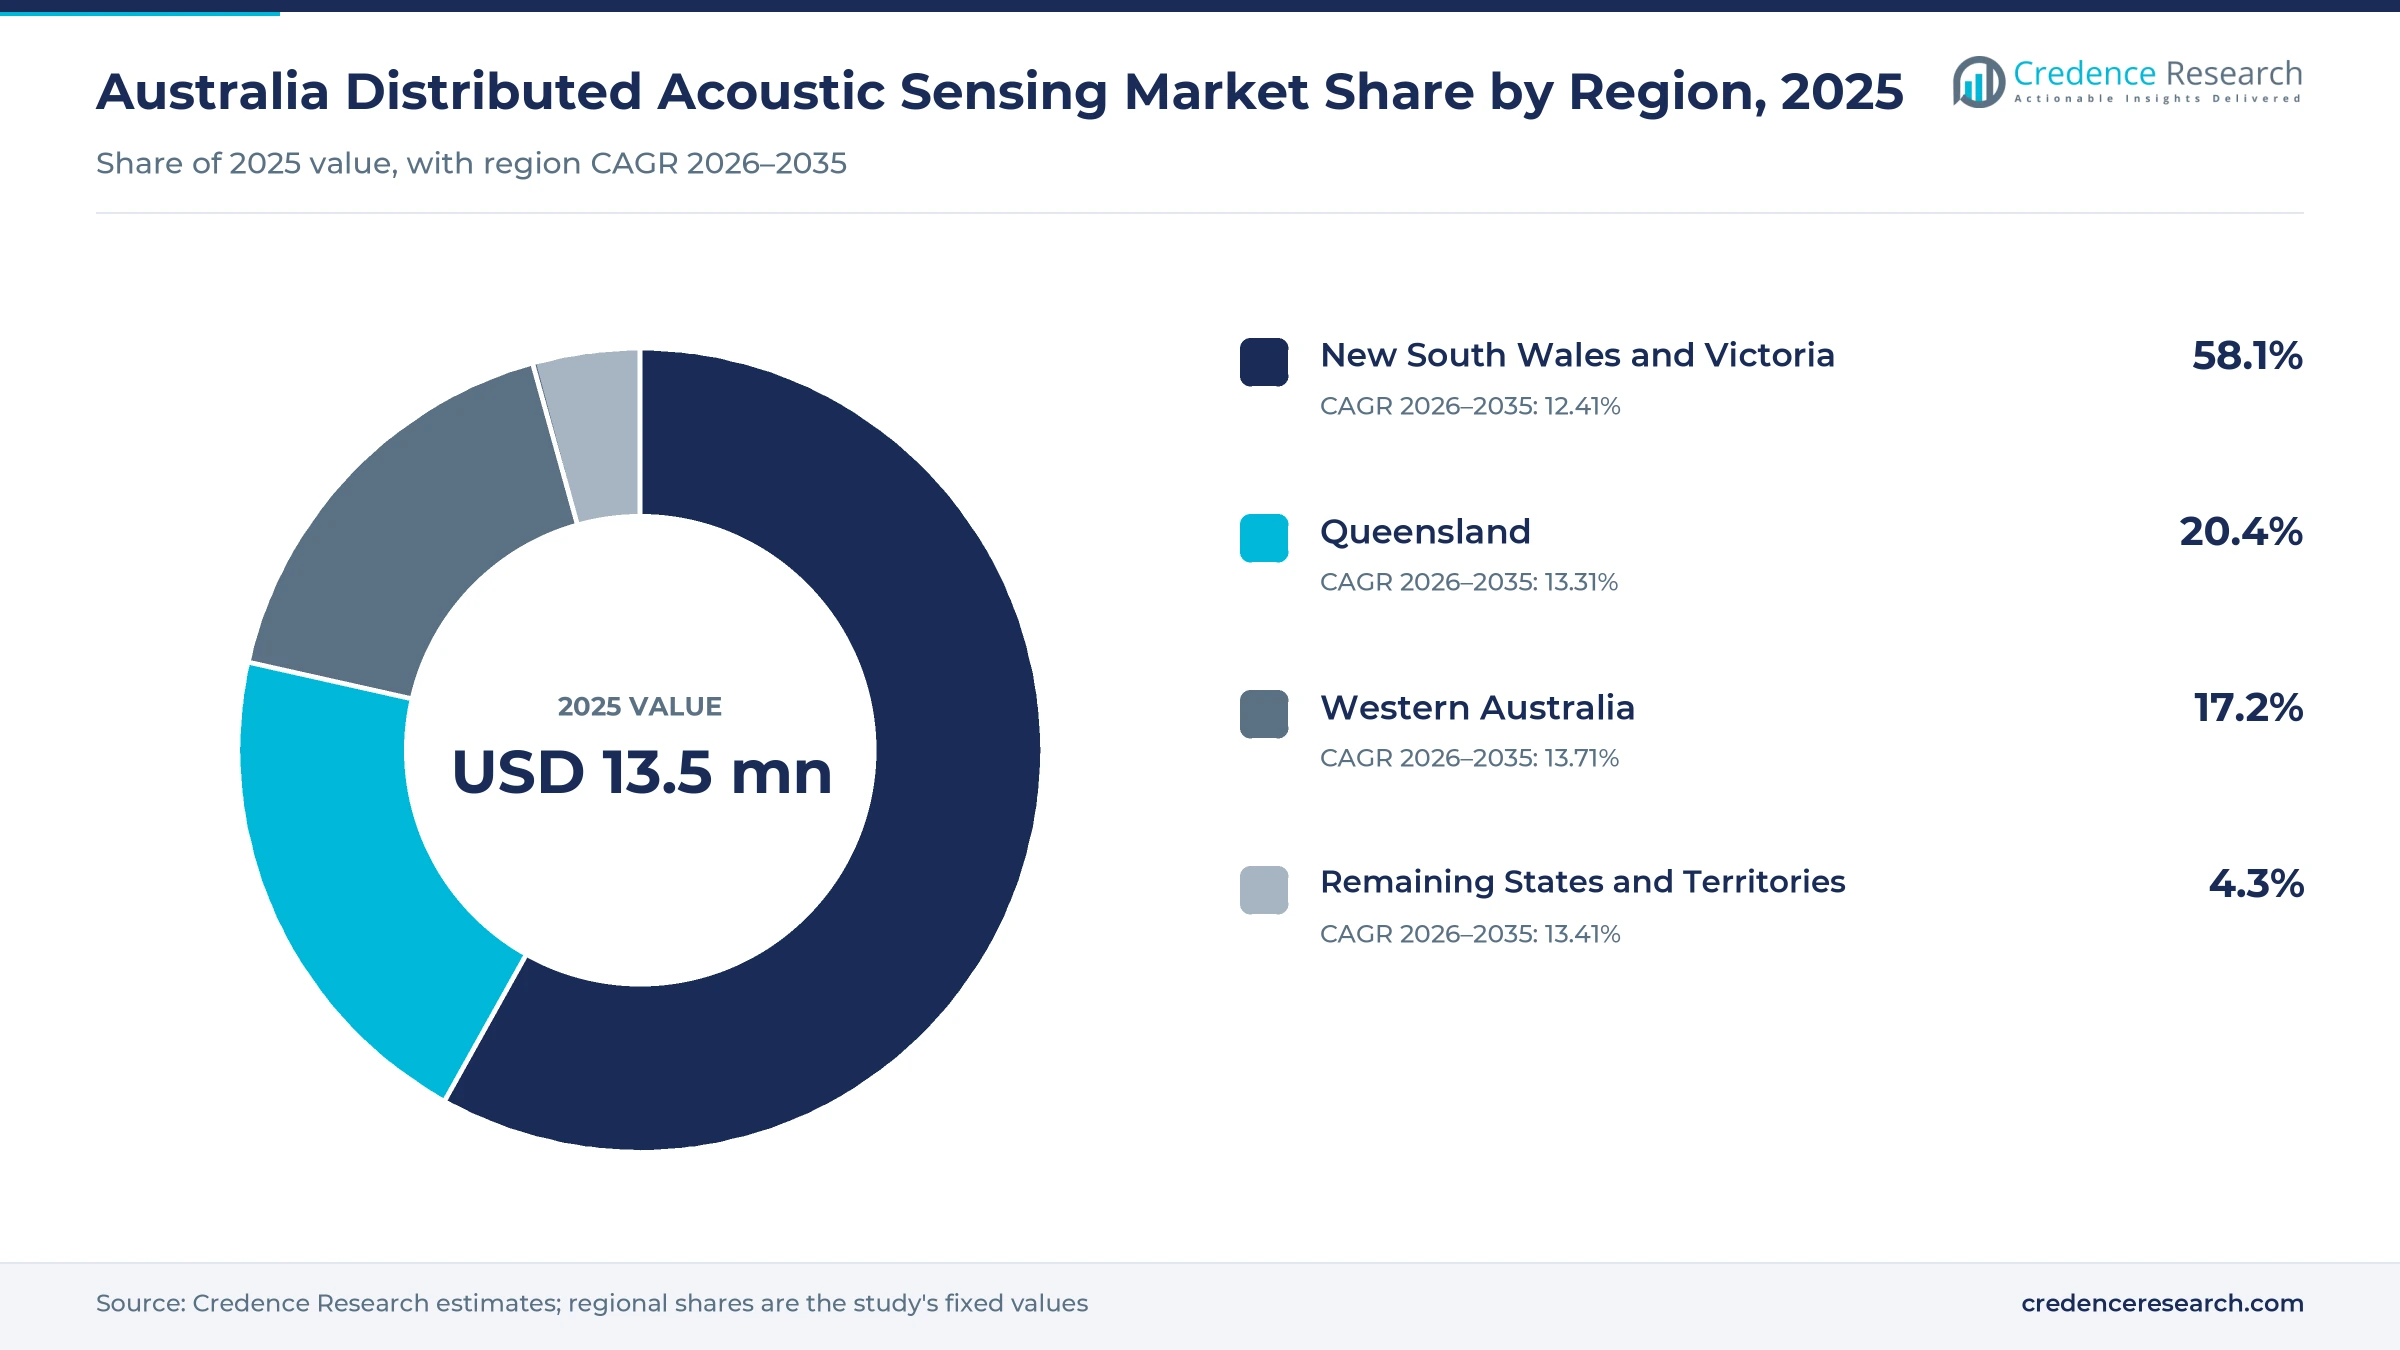
The Australia distributed acoustic sensing market was valued at USD 13.5 million in 2025 and is projected to increase from USD 21.0 million in 2026 to USD 62.4 million by 2035, registering a CAGR of 12.87% during 2026–2035. Demand comes from gas pipeline and well owners, rail and airport operators, telecom carriers and mines that want one fiber cable to replace thousands of point sensors along an asset. New South Wales and Victoria held the largest regional share, 58.1% in 2025, because metro rail projects, the Victorian gas transmission grid, carbon storage research and most telecom and contractor head offices sit in those two states. Western Australia is the fastest-growing region at 13.71% a year during 2026–2035, as offshore research sensing, gas plant security and mine monitoring expand from Perth. Ava Risk Group signed a preferred supplier agreement with Telstra in February 2024, which opened telecom fiber as a new route to market for intrusion and cable strike detection.
Which fiber sensing spending does this estimate include?
The estimate counts spending by buyers in Australia on distributed acoustic sensing interrogators, analytics software and the integration, installation and monitoring services that turn optical fiber into a continuous vibration and acoustic sensor. It covers permanent systems on pipelines, wells, rail corridors, fences and telecom cables, portable systems used for borehole and surface surveys, and managed sensor networks sold as subscriptions. Regional shares allocate value to the place where each contract is booked and the asset sits, so head office purchasing in Sydney and Melbourne lifts the eastern states.
The estimate leaves out the cost of the fiber cable itself and its civil installation when they are paid for as part of a pipeline, rail or telecom build. Distributed temperature and strain sensing, point seismometers and conventional geophones are also excluded, unless they are bundled inside an acoustic sensing contract, because buyers usually procure them as separate instruments.
Australia Distributed Acoustic Sensing Market Insights
- The Australia distributed acoustic sensing market is projected to reach USD 62.4 million by 2035 at a 12.87% CAGR as buried fiber becomes a sensor.
- New South Wales and Victoria held the largest regional share at 58.1% in 2025, led by metro rail security, gas networks and telecom fiber.
- Interrogator hardware led solution types with 48.0% of 2025 value, because each permanent installation still needs a dedicated optical unit at the cable end.
- AuScope started an offshore fiber sensing pilot in January 2026 that will run a long-range interrogator from CSIRO in Perth until June 2027.
- Ava Risk Group, Terra15, Silixa and the Institute of Mine Seismology each have verified Australian work, from metro rail security to mine seismic monitoring.
Interrogator hardware still takes the largest share
Why does interrogator hardware lead solution spending?
Based on solution type, the market is categorized into interrogator hardware, analytics software and integration and monitoring services. Interrogator Hardware led with 48.0% of 2025 value, because each pipeline, rail corridor or well needs its own optical unit before any data can be collected. Analytics Software is the fastest-growing segment at 14.16% a year, as buyers pay for event classification that separates a digger from a passing train.
Which industries account for most fiber sensing value?
Based on end-use industry, the market is categorized into oil and gas, mining and geophysics, infrastructure and security, and environmental monitoring. Oil and Gas led with 36.0% of 2025 value, because wells, gas plants and pipelines were the first assets fitted with permanent fiber. Environmental Monitoring grows fastest at 14.24% a year, as research agencies turn subsea and urban telecom cables into seismic and marine sensing arrays.
How do buyers use the data from sensing fiber?
Based on application, the market is categorized into subsurface characterisation, asset integrity monitoring, intrusion detection and environmental event detection. Asset Integrity Monitoring led with 34.0% of 2025 value, because pipeline and cable owners watch for leaks, flow changes and third-party digging every day. Environmental Event Detection grows fastest at 14.22% a year, as earthquake, landslide and seabed monitoring move from trials to funded national programs.
Why are managed sensor networks gaining ground?
Based on deployment model, the market is categorized into permanent installations, portable survey systems and managed sensor networks. Permanent Installations led with 62.0% of 2025 value, because fiber behind well casing or along a rail corridor is usually monitored for its full life. Managed Sensor Networks grow fastest at 14.83% a year, as owners prefer subscriptions that bundle alarms, software updates and remote support.
| Segment Group | Leading Sub-segment | Share, 2025 | Fastest-growing Sub-segment | CAGR, 2026–2035 |
|---|---|---|---|---|
| By Solution Type | Interrogator Hardware | 48.0% | Analytics Software | 14.16% |
| By End-Use Industry | Oil and Gas | 36.0% | Environmental Monitoring | 14.24% |
| By Application | Asset Integrity Monitoring | 34.0% | Environmental Event Detection | 14.22% |
| By Deployment Model | Permanent Installations | 62.0% | Managed Sensor Networks | 14.83% |
Request a Free Sample
Fill in your details and we'll send you a free sample report.
- Sample data tables & charts
- Research methodology
Energy, mining and infrastructure rules lift demand
Energy asset monitoring keeps oil and gas the anchor buyer
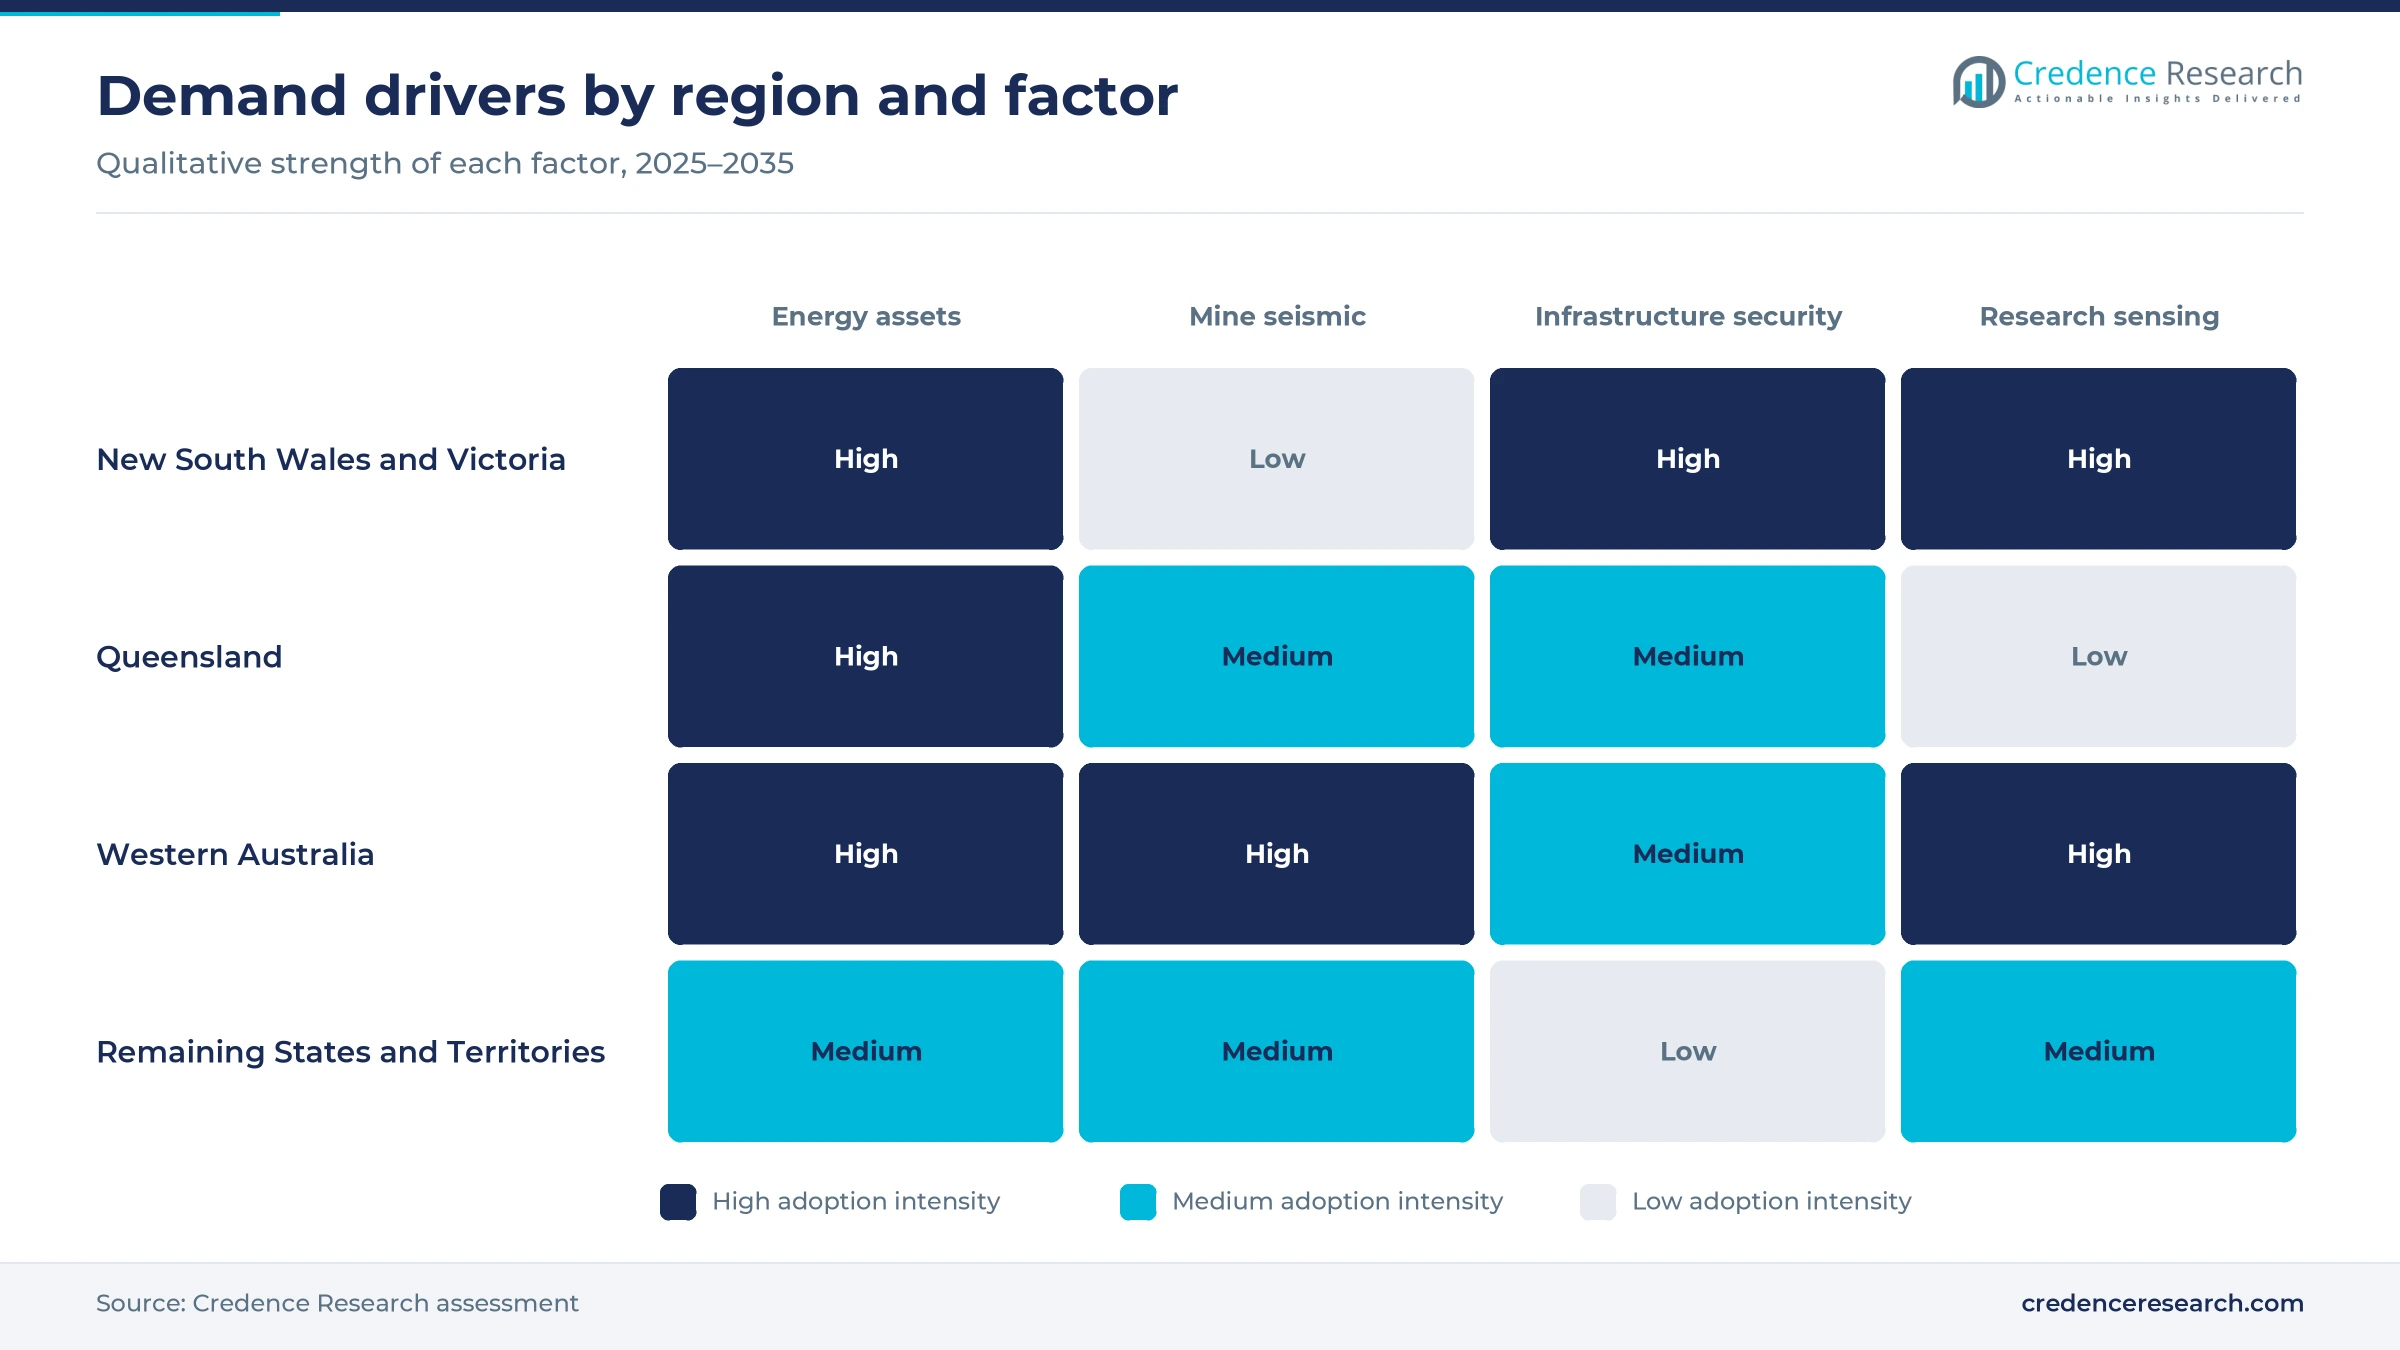
Energy operators remain the anchor buyers, because one fiber along a pipeline or behind a well casing can watch for leaks, flow changes and digging over many kilometers. The three transmission pipelines regulated by the Australian Energy Regulator run 4,928 km, and its six regulated distribution networks span 75,831 km, according to its State of the energy market 2025 pipeline chapter. APA lodged the regulator's first greenfields determination application for the Bulloo Interlink in May 2025, which will add new corridor length to monitor. In October 2025, Ava Risk Group said its Aura Ai-X system had replaced legacy controllers at Woodside's Karratha Gas Plant, where one fiber now covers fence and gates. As a result, oil and gas held 36.0% of 2025 value, the largest end-use share.
Mine seismic visibility moves from points to fiber lines
Mines are adopting fiber sensing because one cable records ground motion every meter, while conventional geophones sit at a handful of points. Australia produced an estimated 92,000 tons of lithium content in 2025, out of a world total of about 290,000 tons, according to USGS mineral commodity data. Each new hard-rock pit adds pit walls, waste dumps and tailings dams that operators must watch for ground movement. In a paper published June 7, 2024, for the ISC'7 geotechnical conference, University of Western Australia researchers and partners trenched a fiber cable along the top of a tailings storage facility at an Australian mine and recorded ambient noise for several months. The Institute of Mine Seismology, which has an office in Kingston, Tasmania, now offers routine monitoring services with Terra15 interrogators.
Critical infrastructure resilience rules favor fiber alarms
Critical infrastructure law gives owners a reason to watch long, exposed assets continuously instead of by patrol. The duty to adopt a risk management program under the Security of Critical Infrastructure Act began on Feb. 17, 2023, for 13 asset classes including gas, electricity, water and data storage, according to the Office of Impact Analysis. Ava Risk Group reported in February 2026 that Aura Ai-X is being installed for corridor intrusion and obstacle detection on the Sydney Metro Southwest line, with completion expected during 2026. The company also expects commissioning of a Siemens Australia transport project across 2026 and 2027. Rail operators now treat fiber alarms as part of wider perimeter intrusion detection programs, which lifts spending in New South Wales and Victoria.
Carbon storage projects need permanent seismic monitoring
Carbon storage creates a new class of permanent buyer, because operators need repeated images that show where injected gas moves for many years. At the CO2CRC Otway site in Victoria, 10 buried seismic sources are paired with fiber installed outside well casing, and injected CO2 was detected within two days at under 300 tons, according to CO2CRC. The CRC-8 monitoring well, drilled to 1,680 m in December 2023, also carries fiber outside its casing. Automated processing on site cuts the raw archive to about 1 GB a day sent offsite. Developers of carbon capture technology are watching these results, because the same design can be repeated at commercial storage sites.
Telecom fiber and AI alarms reshape how buyers pay
Shift of telecom networks into sensing assets
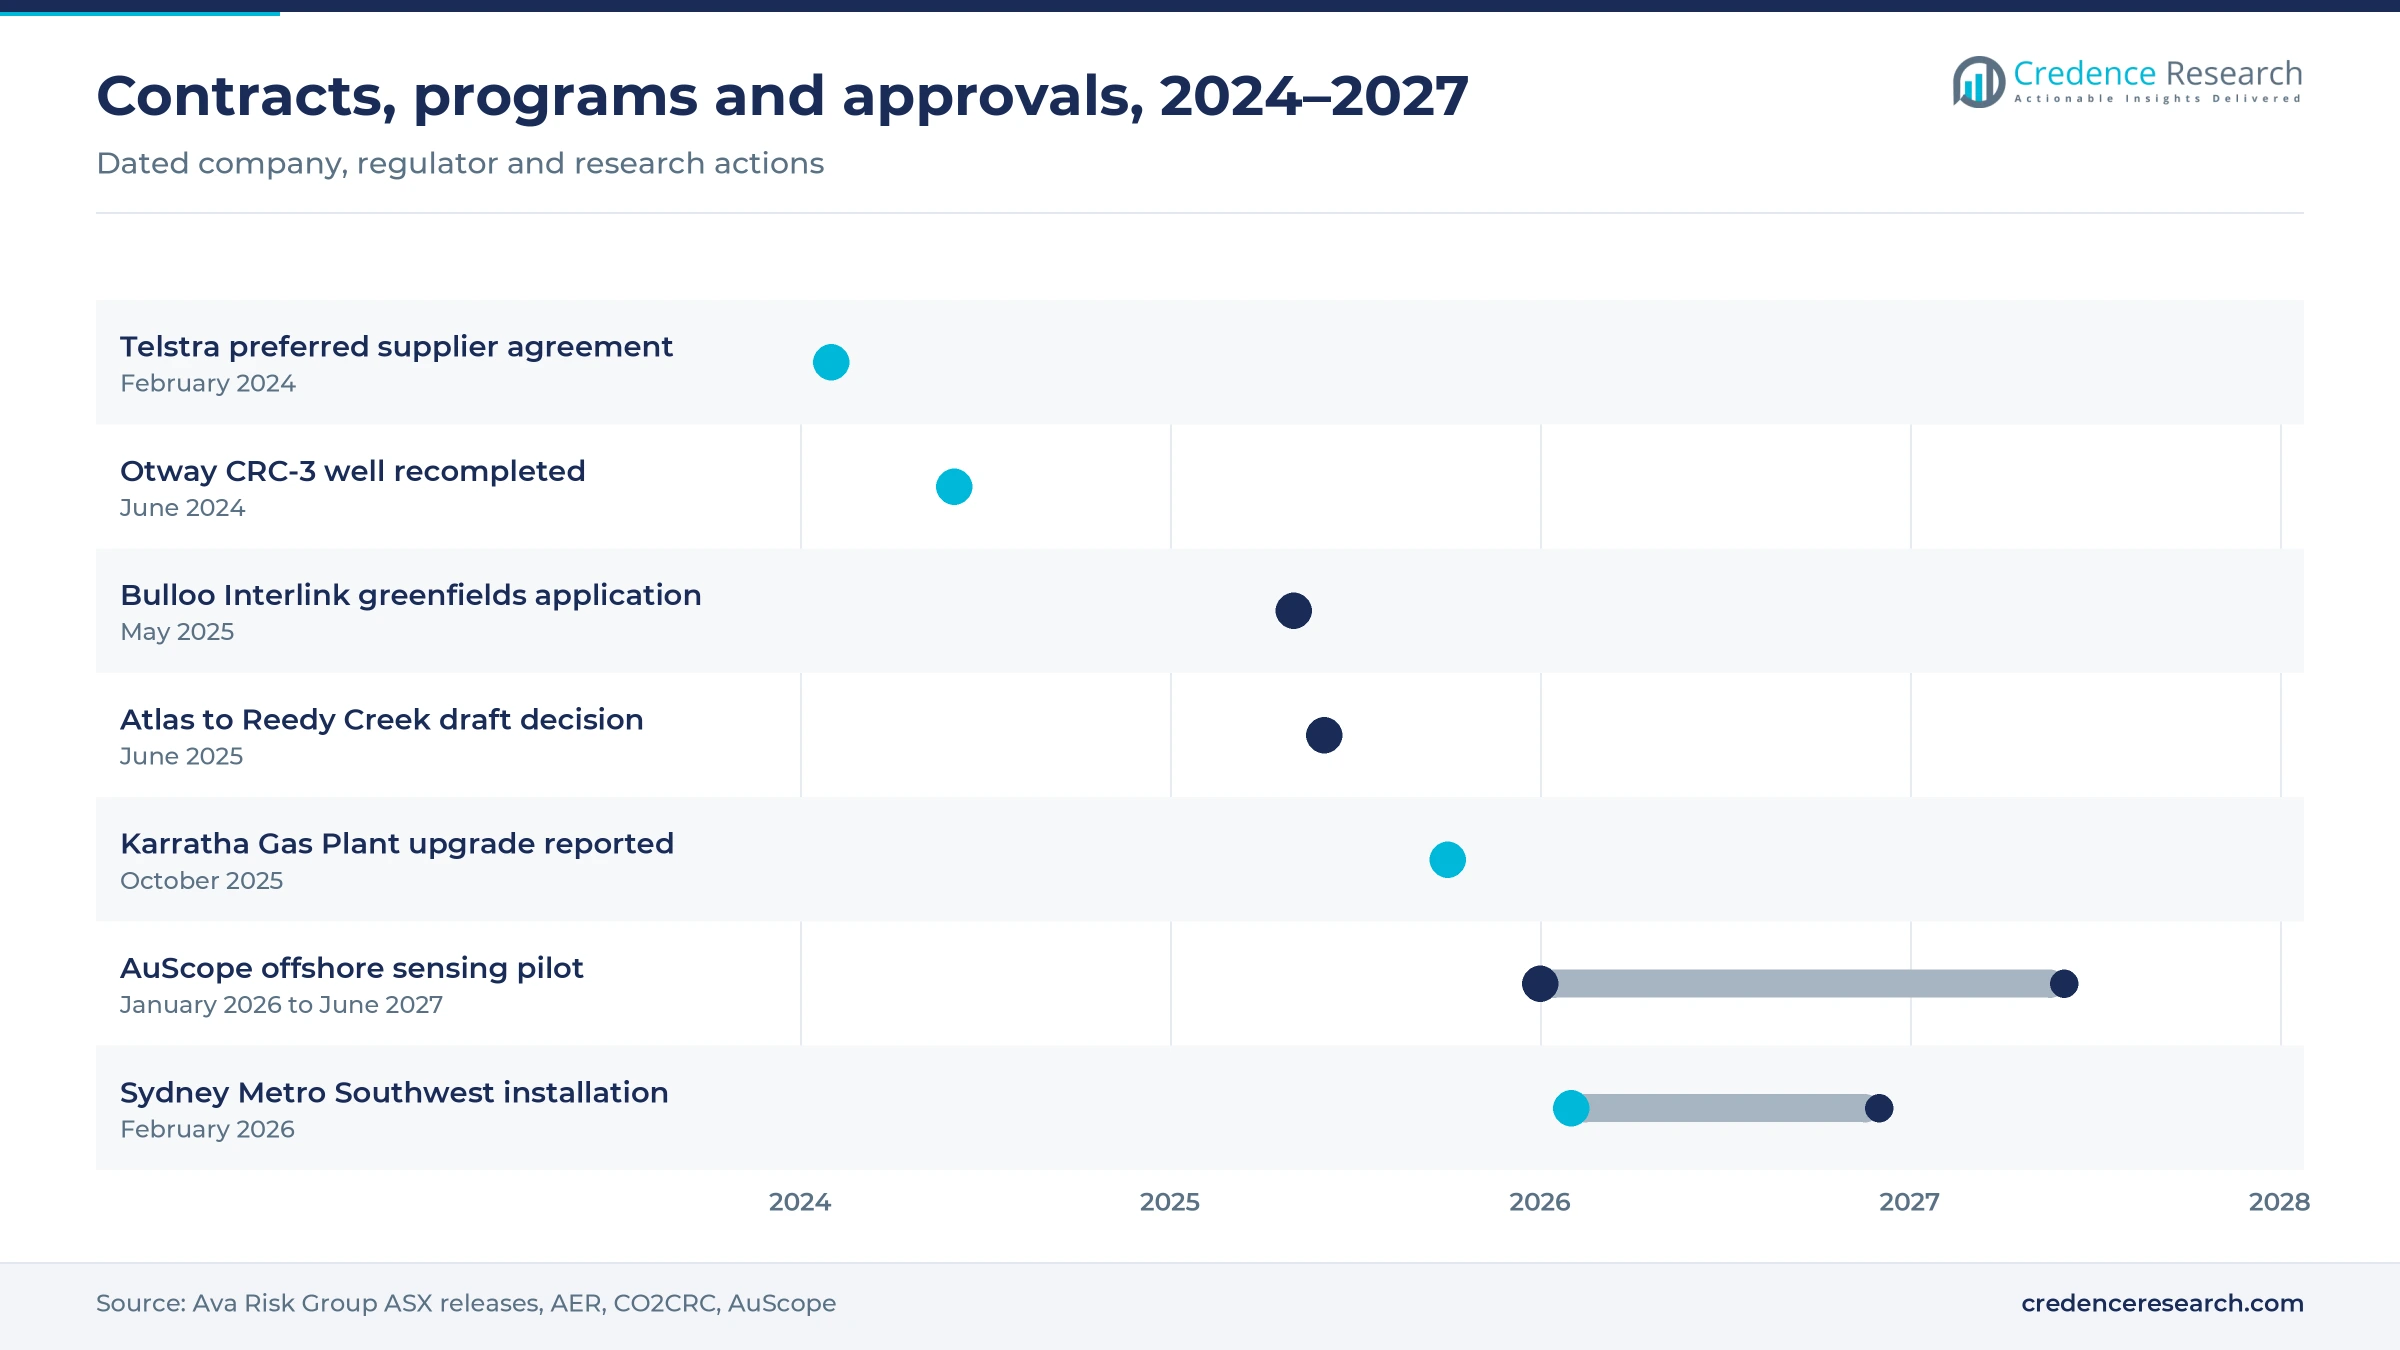
Carriers are starting to treat their fiber as a sensing asset that protects the network itself. Ava Risk Group signed a preferred supplier agreement with Telstra on Feb. 9, 2024, after 10 months of trials on urban fiber in Melbourne and subsea cables in the Port of Darwin, according to its ASX announcement. The same release said Telstra InfraCo manages about 250,000 km of fiber and has access to 400,000 km of subsea cable. Ava later reported that Aura Ai-X was installed on a Telstra subsea cable in the June quarter of 2025. A 76.6 km loop of NBN-type fiber under Melbourne is also used by RMIT and ANU researchers for earthquake sensing, showing how widely existing cable can be reused.
Rise of AI classification and subscription pricing
Value is moving from optical hardware toward software that classifies events and services that keep alarms reliable. Ava Risk Group launched Aura Ai-X in March 2023 with a deep learning module and an optional multi-year subscription, according to its October 2025 AGM address. The company said it built and sold short-range, shallow-buried, L-band and phase variants within two years of launch. Terra15 offers AssureSRV, a managed data, maintenance and reporting service that runs on its Treble interrogators, and it announced a monitoring alliance with MicroSeismic on Aug. 24, 2023. As a result, analytics software grows fastest among solution types at 14.16% a year, and managed sensor networks grow at 14.83% a year.
Opportunity in offshore cables for public research buyers
Public research agencies offer an opening for suppliers of long-range interrogators and data services. AuScope's Offshore Fibre Sensing Infrastructure pilot runs from January 2026 to June 2027 and will deploy an interrogator rated above 100 km to turn existing submarine telecom cables into seismic arrays. The system is hosted at CSIRO's Kensington campus in Perth, with ANU and AARNet as collaborators. Geoscience Australia, the Australian Antarctic Division and Parks Australia are named among the groups that will benefit from the data. Environmental event detection therefore grows fastest among applications, at 14.22% a year, and Western Australia gains share.
Opportunity in borehole surveys for mineral exploration
Mineral explorers offer an opening for portable systems that log a borehole in one pass. In a 2018 case study published in ASEG Extended Abstracts, Andrej Bona and Roman Pevzner found acoustic fiber data much better than a hydrophone string in a South Australian Mineral Systems Drilling Program borehole, with faster acquisition as depth increased. Mineral exploration spending reached A$1,143 million in the June quarter of 2026, seasonally adjusted, according to the Australian Bureau of Statistics. Curtin University began a fiber acoustic sensing project with CSIRO, Santos, Woodside and Silixa in September 2021, noting that Australian uptake lagged the U.S. and U.K. Mines that already run AI-based mine safety monitoring are likely early buyers.
Data volumes, false alarms and delays slow adoption
Raw data volumes strain small operator teams
A single interrogator produces far more data than a conventional seismic array, which strains storage and staff. The CO2CRC Otway site holds a petabyte-scale archive and relies on automated processing to send about 1 GB a day offsite. Smaller pipeline and mine operators rarely employ geophysicists who can tune these workflows. As a result, many buyers depend on vendor monitoring services, which raises lifetime cost but reduces internal risk.
Nuisance alarms in noisy corridors erode trust
Rail lines, airports and industrial sites produce constant vibration from trains, aircraft and machinery. Ava Risk Group had to customize its algorithm to filter jet blast noise on the 16 km Dubai airport perimeter, showing how site-specific tuning can be. Each false alarm costs a patrol visit and weakens operator confidence. Suppliers respond with deep learning classifiers and rail safety certification, yet tuning still adds weeks to commissioning.
Contract timing depends on large transport projects
Many Australian orders are tied to metro, rail and airport programs whose timing is set by prime contractors. Ava Risk Group reported that several major orders expected in the second half of fiscal 2025 slipped into the following half, and a major Australian transport bid was delayed. Such delays move revenue between years for suppliers and integrators. Firms reduce the risk by building recurring service contracts that continue between project awards.
Fiber access and placement limit retrofit projects
Sensing works best when fiber is placed close to the asset, which is hard to arrange after construction. Wells need fiber cemented outside casing, while telecom cables include manhole loops that add about 2 to 100 meters of extra fiber and distort location data, according to RMIT researchers. Access to unused dark fiber also needs carrier agreements with the network owners. These limits favor new builds and slow retrofits on older pipelines and corridors.
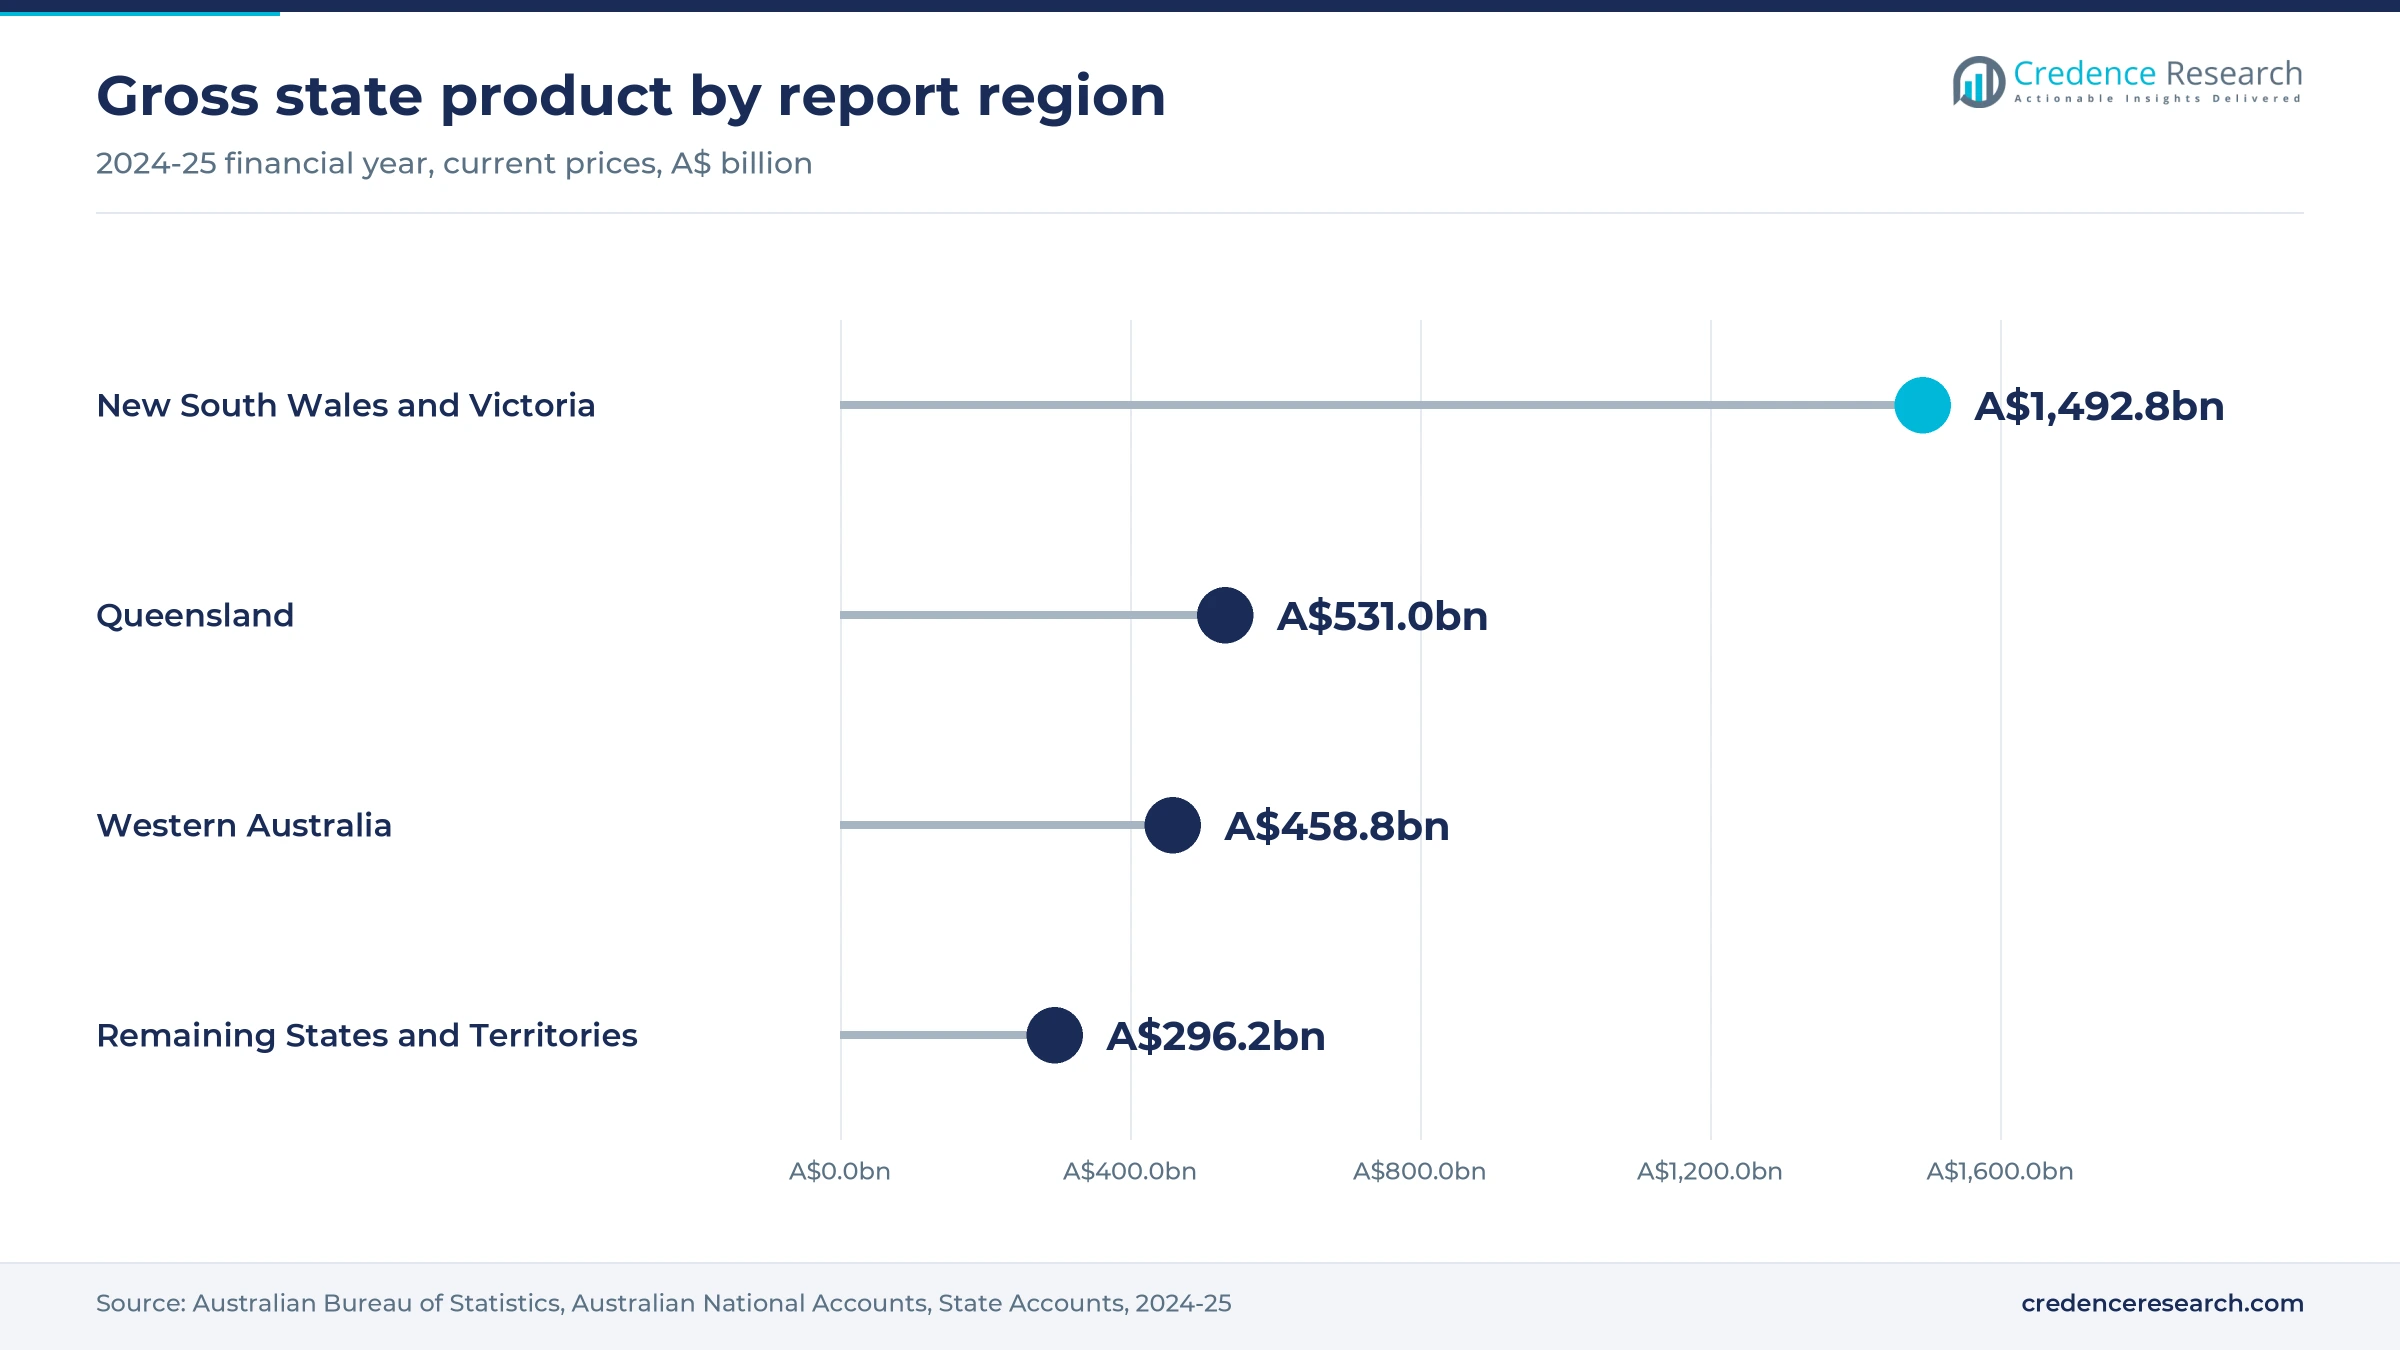
New South Wales and Victoria lead booked spending
| Region | Value, 2025 (USD million) | Share, 2025 | CAGR, 2026–2035 |
|---|---|---|---|
| New South Wales and Victoria | 7.8 | 58.1% | 12.41% |
| Queensland | 2.8 | 20.4% | 13.31% |
| Western Australia | 2.3 | 17.2% | 13.71% |
| Remaining States and Territories | 0.6 | 4.3% | 13.41% |
New South Wales and Victoria lead on rail and telecom work
New South Wales and Victoria held 58.1% of 2025 value, the largest regional share, and grow at 12.41% a year. Sydney Metro corridor detection, the 2,318 km Victorian Transmission System and the Otway carbon storage site all sit in these two states. Telstra trials on urban Melbourne fiber add telecom demand, while head offices in both cities book many national contracts. Growth trails the national rate because the base is already large.
Queensland grows on gas corridors and new pipelines
Queensland held a 20.4% share of 2025 value and grows at 13.31% a year, above the national rate. The 984 km Roma Brisbane Pipeline is one of the AER's three regulated transmission lines, and the regulator issued a draft decision on the new Atlas to Reedy Creek Pipeline in the Surat Basin on June 27, 2025. Operators often pair fiber alarms with pipeline leak detection systems on these routes. The AER also expects possible gas supply shortfalls in southern states from 2027 or 2028, which favors added Queensland pipeline capacity.
Western Australia grows fastest from a Perth base
Western Australia held a 17.2% share of 2025 value and grows fastest among regions, at 13.71% a year. Perth hosts Terra15, which builds the Treble interrogator family, and CSIRO's Kensington campus, which hosts the national offshore sensing pilot. Ava Risk Group has also upgraded security sensing at Woodside's Karratha Gas Plant. Hard-rock lithium and gold mines add demand for tailings and seismic monitoring, which supports both portable surveys and permanent installs.
Remaining states and territories add niche projects
Remaining States and Territories held a 4.3% share of 2025 value and grow at 13.41% a year. South Australia hosted an early borehole sensing study in the Mineral Systems Drilling Program, and the Northern Territory's 1,626 km Amadeus Gas Pipeline is a regulated transmission line. Telstra's subsea trial in the Port of Darwin and the Institute of Mine Seismology office in Tasmania also sit in this group.
Telstra, Sydney Metro and offshore pilots since 2024
| Development | Status and market relevance |
|---|---|
| In February 2024, Ava Risk Group signed a preferred supplier agreement with Telstra after trials in Melbourne and the Port of Darwin. | Active; opens telecom fiber protection as a sales channel |
| In June 2024, CO2CRC recompleted the CRC-3 well at the Otway site in Victoria for its Stage 4 injection program. | Complete; extends fiber-based carbon storage monitoring |
| In October 2025, Ava Risk Group reported that Aura Ai-X had replaced legacy controllers at Woodside's Karratha Gas Plant. | Installed; one fiber now covers fence and gates |
| In January 2026, AuScope began its offshore fiber sensing pilot hosted at CSIRO's Kensington campus in Perth. | Active to June 2027; turns subsea telecom cables into seismic arrays |
| In February 2026, Ava Risk Group said Aura Ai-X was being installed on the Sydney Metro Southwest line. | In progress; completion expected during 2026 |
Phase interrogators and edge processing change the work
- Phase-based interrogators measure tiny strain changes along the fiber, and Terra15's Treble, Treble+ and TrebleDuo units serve pipelines, mines and geoscience work.
- L-band units let operators sense on lit telecom fiber, and Ava Risk Group has added an L-band Aura Ai-X variant for carriers.
- Permanent seismic sources such as the buried orbital vibrators at Otway, work with fiber in wells to repeat images on demand.
- Edge processing reduces raw data at the site, and it links acoustic channels with other fiber optic sensor outputs before alerts go to control rooms.
Need a Custom Version of This Report?
Tailor the scope, geography, or segments to your exact requirements.
- Custom geography or segment scope
- Direct access to our analyst team
Suppliers compete on classification and local support
Competition centers on event classification, local engineering support and certification rather than on optical hardware alone. Ava Risk Group, through its Future Fibre Technologies brand, leads security and infrastructure work, with Aura Ai-X on the Sydney Metro Southwest line, Woodside's Karratha Gas Plant and a Telstra subsea cable. Terra15, based in Perth, sells the Treble interrogator family and the AssureSRV managed service for pipelines, mines and geoscience. The Institute of Mine Seismology runs monitoring services from its Tasmanian office using Terra15 hardware. Silixa joined Curtin University's 2021 fiber acoustic sensing project with CSIRO, Santos and Woodside. Aura Ai-X also holds SIL2 safety accreditation, which supports rail work with prime contractors such as UGL and Siemens. Suppliers with certified classifiers and local service teams are best placed for multi-year contracts.
Companies profiled and their roles in this market
| Company | Type | Role in the market |
|---|---|---|
| Ava Risk Group (Future Fibre Technologies) | Security sensing supplier | Aura Ai-X on Sydney Metro, Karratha and Telstra cables |
| Terra15 | Interrogator maker | Perth firm selling Treble units and AssureSRV managed service |
| Institute of Mine Seismology | Mine monitoring provider | Tasmanian office offering routine fiber monitoring services |
| Silixa | Interrogator and services supplier | Partner in Curtin University fiber sensing project since 2021 |
Credence Research view on fiber sensing in Australia
Credence Research's view is that the Australia distributed acoustic sensing market is moving from one-off hardware sales toward managed networks built on fiber that already exists. Interrogator hardware remains the largest category, yet analytics and subscriptions capture a rising share as buyers demand fewer false alarms. Oil and gas keeps the largest end-use share, while public research programs and telecom carriers add new demand. Suppliers that combine certified classifiers, local support in Perth, Sydney and Melbourne, and recurring service contracts should win the longest relationships.
How the regional and segment estimates were built
The report uses 2025 as the base year on a calendar basis, and market values come from the Credence Research model. That model draws on Australian Energy Regulator pipeline data, Australian Bureau of Statistics state accounts and exploration data, USGS production data, AuScope and CO2CRC program pages, university research releases and company stock exchange announcements. Segment splits and regional growth rates are Credence Research estimates, while regional shares are the fixed values for this study. Sources used are government pages, agency reports, company filings and research publications, and no interviews or surveys were used.
Managed networks and telecom fiber drive growth to 2035
The Australia distributed acoustic sensing market is expected to reach USD 62.4 million by 2035, rising at a 12.87% CAGR during 2026–2035, as owners turn pipelines, rail corridors, wells and telecom cables into continuous sensors. Interrogator hardware keeps the largest share, while analytics software, managed networks and environmental event detection grow fastest. Western Australia gains share as offshore research sensing and mine monitoring expand from Perth. Data volumes, false alarms and project delays will slow some buyers, yet critical infrastructure rules keep demand steady through the forecast period.
Frequently Asked Questions
How big is the Australia distributed acoustic sensing market?
Which solution type holds the largest share?
Which region holds the largest share of value?
Which region grows fastest?
Why is oil and gas the largest end-use industry?
How are telecom carriers using fiber sensing?
Which deployment model grows fastest?
Which companies are active in the Australia distributed acoustic sensing market?
Table of Content
Chapter 1 Market Segmentation
- 1.1 Segmentation Framework
- 1.1.1 Product and Service Classification
- 1.1.2 Application and End-Use Classification
- 1.1.3 Technology and Solution Classification
- 1.1.4 Customer and Distribution Channel Classification
- 1.1.5 Geographic Segmentation
- 1.1.6 Market Segment Definitions and Boundaries
- 1.2 By Solution Type
- 1.2.1 Interrogator Hardware
- 1.2.2 Integration and Monitoring Services
- 1.2.3 Analytics Software
- 1.3 By End-Use Industry
- 1.3.1 Oil and Gas
- 1.3.2 Infrastructure and Security
- 1.3.3 Mining and Geophysics
- 1.3.4 Environmental Monitoring
- 1.4 By Application
- 1.4.1 Asset Integrity Monitoring
- 1.4.2 Intrusion Detection
- 1.4.3 Subsurface Characterisation
- 1.4.4 Environmental Event Detection
- 1.5 By Deployment Model
- 1.5.1 Permanent Installations
- 1.5.2 Portable Survey Systems
- 1.5.3 Managed Sensor Networks
Chapter 2 Introduction
- 2.1 Report Objectives and Scope
- 2.2 Product Definition and Industry Terminology
- 2.3 Market Inclusions and Exclusions
- 2.4 Research Process
- 2.4.1 Primary Research and Expert Interviews
- 2.4.2 Secondary Research and Source Review
- 2.4.3 Top-Down and Bottom-Up Estimation
- 2.4.4 Data Triangulation and Verification
- 2.5 Market Size Measurement Basis
- 2.5.1 2025: USD 13.5 million → 2035: USD 62.4 million
- 2.6 Historical and Forecast Reference Periods
- 2.6.1 Historical Period: 2018-2025
- 2.6.2 Base Year: 2025
- 2.6.3 Forecast Period: 2025-2035
- 2.7 Research Assumptions and Limitations
Chapter 3 Executive Summary
- 3.1 Market Snapshot and Key Findings
- 3.2 Base-Year Market Size, 2025
- 3.3 Forecast Market Size, 2035
- 3.4 Revenue and Volume Growth Outlook
- 3.5 Key Demand and Supply Indicators
- 3.6 Leading Market Segments
- 3.7 Fastest-Growing Market Opportunities
- 3.8 Regional Performance Highlights
- 3.9 Technology and Industry Transformation
- 3.10 Competitive Landscape Summary
- 3.11 Analyst View and Strategic Implications
Chapter 4 Australia Distributed Acoustic Sensing Market Trends and Developments
- 4.1 Historical Industry Development, 2018-2025
- 4.2 Recent Market Trends and Developments
- 4.3 Demand and Customer Behavior Trends
- 4.4 Technology and Product Innovation
- 4.5 Artificial Intelligence, Automation and Digitalization
- 4.6 Local Manufacturing and Supply Chain Realignment
- 4.7 Industry Partnerships, Mergers and Acquisitions
- 4.8 Sustainability and Circular Economy Developments
- 4.9 Government and Private Sector Investment Trends
- 4.10 Emerging Business Models and Commercialization
- 4.11 Industry Developments and Announcements
Chapter 5 Australia Distributed Acoustic Sensing Market Production, Supply and Demand Analysis
- 5.1 Demand Trend and Consumption Analysis, 2018-2025
- 5.2 Demand Forecast, 2025-2035
- 5.3 Production and Output Trend, 2018-2025
- 5.4 Production and Output Forecast, 2025-2035
- 5.5 Installed Capacity and Capacity Utilization
- 5.6 Company-Wise Production Plants and Statistics
- 5.6.1 Installed Production Capacity
- 5.6.2 Actual Production
- 5.6.3 Planned Capacity and Expansion Targets
- 5.7 Supply Chain Structure and Procurement Trends
- 5.8 Supply-Demand Gap and Bottlenecks
- 5.9 Import Dependence and Sourcing Structure
- 5.10 Contract Manufacturing and Outsourcing
- 5.11 Regional Supply and Demand Concentration
Chapter 6 Australia Distributed Acoustic Sensing Market Pricing Analysis
- 6.1 Pricing Structure and Measurement
- 6.2 Historical Pricing Trends, 2018-2025
- 6.3 Pricing Outlook, 2025-2035
- 6.4 Average Selling Price and Unit Economics
- 6.5 Pricing by Product and Market Segment
- 6.6 Geographic Pricing Differences
- 6.7 Key Input, Energy, Labor and Logistics Costs
- 6.8 Contract Pricing and Purchasing Models
- 6.9 Pricing Sensitivity and Competitive Positioning
- 6.10 Price, Margin and Profitability Implications
Chapter 7 Australia Distributed Acoustic Sensing Market Dynamics
- 7.1 Market Growth Drivers
- 7.1.1 Demand-Side Drivers
- 7.1.2 Technology and Innovation Drivers
- 7.1.3 Infrastructure and Investment Drivers
- 7.1.4 Regulatory and Policy Drivers
- 7.2 Market Restraints
- 7.2.1 Cost and Affordability Constraints
- 7.2.2 Technology and Adoption Barriers
- 7.2.3 Supply Chain and Operational Constraints
- 7.3 Market Challenges
- 7.3.1 Competitive Pressure and Margin Erosion
- 7.3.2 Skills, Infrastructure and Implementation Gaps
- 7.4 Emerging Market Opportunities
- 7.5 Market Dynamics Impact and Time-Horizon Assessment
Chapter 8 Australia Distributed Acoustic Sensing Value Chain Analysis
- 8.1 Industry Value Chain Overview
- 8.2 Upstream Suppliers and Critical Inputs
- 8.3 Technology and Component Providers
- 8.4 Manufacturing or Service Delivery
- 8.5 Distribution, Channel Partners and Integrators
- 8.6 Downstream Applications and End Users
- 8.7 Value Addition and Profit Pools
- 8.8 Vertical Integration and Outsourcing
- 8.9 Supplier Concentration and Risk
- 8.10 Supply Chain Localization and Resilience
Chapter 9 Australia Distributed Acoustic Sensing Market Regulations and Policies
- 9.1 Relevant Laws, Standards and Compliance Frameworks
- 9.2 Product, Service, Safety and Quality Requirements
- 9.3 Government Policies, Incentives and Subsidies
- 9.4 Imports, Exports and Trade Barriers
- 9.5 Public Procurement and Local Content Requirements
- 9.6 Environmental and Sustainability Compliance
- 9.7 Data Protection, AI and Cybersecurity Compliance
- 9.8 Upcoming Policy Changes and Market Implications
Chapter 10 Australia Distributed Acoustic Sensing Market Hotspots and Opportunities
- 10.1 Market Opportunity Mapping and Growth Hotspots
- 10.2 High-Growth Applications and Customer Groups
- 10.3 Underserved Markets and White-Space Opportunities
- 10.4 Emerging Technology and Product Opportunities
- 10.5 New Capacity and Investment Hotspots
- 10.6 Market Entry and Expansion Opportunities
- 10.7 Distribution and Partnership Opportunities
- 10.8 Near-Term and Long-Term Commercial Potential
- 10.9 Opportunity Attractiveness and Execution Risks
Chapter 11 Australia Distributed Acoustic Sensing Market Outlook, 2025-2035
- 11.1 Market Size and Analysis
- 11.1.1 Revenue (Market Measurement: 2025: USD 13.5 million → 2035: USD 62.4 million)
- 11.1.2 Market Volume and Quantity Sold
- 11.1.3 Historical Market Size, 2018-2025
- 11.1.4 Base-Year Market Size, 2025
- 11.2 Market Forecast, 2025-2035
- 11.2.1 Revenue Forecast to 2035
- 11.2.2 Volume Forecast to 2035
- 11.2.3 CAGR and Year-on-Year Growth
- 11.2.4 Incremental Revenue Opportunity
- 11.3 Forecast Assumptions and Scenario Analysis
- 11.3.1 Base-Case Forecast
- 11.3.2 Optimistic and Conservative Scenarios
- 11.3.3 Technology, Pricing and Policy Sensitivities
- 11.4 Market Attractiveness and Growth Outlook
Chapter 12 Australia Distributed Acoustic Sensing Market Segmentation and Outlook
- 12.1 Segmentation Summary and Market Shares, 2025
- 12.2 Largest and Fastest-Growing Segments
- 12.3 By Solution Type - Market Size and Forecast, 2025-2035
- 12.3.1 Segment Definition and Scope
- 12.3.2 Historical Market Size, 2018-2025
- 12.3.3 Revenue Forecast, 2025-2035
- 12.3.4 Volume Forecast, 2025-2035
- 12.3.5 Base-Year Market Share, 2025
- 12.3.6 Segment CAGR and Growth Drivers
- 12.3.7 Subsegment Market Size and Forecast
- 12.3.7.1 Interrogator Hardware
- 12.3.7.2 Integration and Monitoring Services
- 12.3.7.3 Analytics Software
- 12.3.8 Subsegment Pricing and Adoption Trends
- 12.3.9 Leading Suppliers and Competition
- 12.3.10 Regional Demand and Opportunities
- 12.4 By End-Use Industry - Market Size and Forecast, 2025-2035
- 12.4.1 Segment Definition and Scope
- 12.4.2 Historical Market Size, 2018-2025
- 12.4.3 Revenue Forecast, 2025-2035
- 12.4.4 Volume Forecast, 2025-2035
- 12.4.5 Base-Year Market Share, 2025
- 12.4.6 Segment CAGR and Growth Drivers
- 12.4.7 Subsegment Market Size and Forecast
- 12.4.7.1 Oil and Gas
- 12.4.7.2 Infrastructure and Security
- 12.4.7.3 Mining and Geophysics
- 12.4.7.4 Environmental Monitoring
- 12.4.8 Subsegment Pricing and Adoption Trends
- 12.4.9 Leading Suppliers and Competition
- 12.4.10 Regional Demand and Opportunities
- 12.5 By Application - Market Size and Forecast, 2025-2035
- 12.5.1 Segment Definition and Scope
- 12.5.2 Historical Market Size, 2018-2025
- 12.5.3 Revenue Forecast, 2025-2035
- 12.5.4 Volume Forecast, 2025-2035
- 12.5.5 Base-Year Market Share, 2025
- 12.5.6 Segment CAGR and Growth Drivers
- 12.5.7 Subsegment Market Size and Forecast
- 12.5.7.1 Asset Integrity Monitoring
- 12.5.7.2 Intrusion Detection
- 12.5.7.3 Subsurface Characterisation
- 12.5.7.4 Environmental Event Detection
- 12.5.8 Subsegment Pricing and Adoption Trends
- 12.5.9 Leading Suppliers and Competition
- 12.5.10 Regional Demand and Opportunities
- 12.6 By Deployment Model - Market Size and Forecast, 2025-2035
- 12.6.1 Segment Definition and Scope
- 12.6.2 Historical Market Size, 2018-2025
- 12.6.3 Revenue Forecast, 2025-2035
- 12.6.4 Volume Forecast, 2025-2035
- 12.6.5 Base-Year Market Share, 2025
- 12.6.6 Segment CAGR and Growth Drivers
- 12.6.7 Subsegment Market Size and Forecast
- 12.6.7.1 Permanent Installations
- 12.6.7.2 Portable Survey Systems
- 12.6.7.3 Managed Sensor Networks
- 12.6.8 Subsegment Pricing and Adoption Trends
- 12.6.9 Leading Suppliers and Competition
- 12.6.10 Regional Demand and Opportunities
- 12.7 Segment Growth Comparison
- 12.8 Segment Attractiveness and Priority Matrix
Chapter 13 Australia Distributed Acoustic Sensing End-Use and Application Market Outlook
- 13.1 End-Use Industry and Customer Demand Structure
- 13.2 Leading Applications and Customer Groups
- 13.3 End-Use Market Size, Share and Forecast
- 13.4 Major End-Use Industry Deep Dives
- 13.4.1 Customer Requirements and Use Cases
- 13.4.2 Demand and Replacement Cycles
- 13.4.3 Technical and Regulatory Considerations
- 13.4.4 Purchasing and Procurement Models
- 13.4.5 Leading Vendors and Distribution Channels
- 13.4.6 Forecast and Commercial Opportunities
- 13.5 Emerging Applications and Cross-Segment Demand
- 13.6 End-Use Industry Investment Priorities
Chapter 14 Australia Distributed Acoustic Sensing Geographic Market Outlook, 2025-2035
- 14.1 Domestic Market Distribution and Demand Clusters
- 14.2 State- or Province-Wise Market Size and Forecast, 2025-2035
- 14.3 City and Metropolitan Market Outlook
- 14.4 Industrial, Manufacturing and Commercial Clusters
- 14.5 Geographic Concentration of Key End Users
- 14.6 Local Pricing and Purchasing Differences
- 14.7 Domestic Production Facilities and Capacity Map
- 14.8 Local Infrastructure and Project Pipeline
- 14.9 State-Level Policy and Incentive Differences
- 14.10 Subnational Investment Hotspots and Opportunities
- 14.11 Distribution and Logistics Networks
- 14.12 Domestic Competitive Footprint
Chapter 15 Australia Distributed Acoustic Sensing Technology, Innovation and Sustainability Outlook
- 15.1 Technology Landscape and Maturity
- 15.2 Product, Process and Service Innovation
- 15.3 AI, Automation and Digital Tools in the Industry
- 15.4 Technology Adoption and Performance Benchmarking
- 15.5 Innovation Pipeline and R&D Investment
- 15.6 Patent and Intellectual Property Trends
- 15.7 Energy Efficiency and Resource Management
- 15.8 Sustainability, Recycling and Circularity
- 15.9 Technology Roadmap, 2025-2035
- 15.10 Risks of Obsolescence and Technology Substitution
Chapter 16 Australia Distributed Acoustic Sensing Market Key Strategic Imperatives
- 16.1 Growth and Market Entry Priorities
- 16.2 High-Return Products and Segments
- 16.3 Pricing, Profitability and Cost Optimization
- 16.4 Technology Investment and Product Differentiation
- 16.5 Supply Chain Localization and Resilience
- 16.6 Distribution and Customer Acquisition
- 16.7 Partnership, Acquisition and Capacity Strategy
- 16.8 Regional Expansion Priorities
- 16.9 Short-, Medium- and Long-Term Actions
Chapter 17 Competition Outlook
- 17.1 Industry Competition Characteristics
- 17.2 Market Structure and Concentration
- 17.3 Market Share and Competitive Positioning, 2025
- 17.4 Company-Wise Revenue and Product Benchmarking
- 17.5 Production and Service Capacity Benchmarking
- 17.6 Technology, Pricing and Differentiation
- 17.7 Regional Footprint and Distribution Strength
- 17.8 Mergers, Acquisitions and Strategic Alliances
- 17.9 New Entrants and Competitive Threats
- 17.10 Porter's Five Forces and Industry Attractiveness
- 17.11 Competitive Outlook, 2025-2035
Chapter 18 Company Profiles
- 18.1 Company Coverage and Selection Criteria
- 18.2 Ava Risk Group (Future Fibre Technologies)
- 18.2.1 Business Description
- 18.2.2 Company Ownership and Geographic Presence
- 18.2.3 Product and Service Portfolio
- 18.2.4 Manufacturing and Operating Footprint
- 18.2.5 Production Capacity and Expansion Plans
- 18.2.6 Financial Performance and Investment
- 18.2.7 Market Share and Competitive Position
- 18.2.8 Technology and Innovation Capabilities
- 18.2.9 Strategic Alliances or Partnerships
- 18.2.10 Recent Developments
- 18.2.11 Growth Strategy and Outlook
- 18.3 SLB
- 18.4 Halliburton
- 18.5 Baker Hughes
- 18.6 Silixa
- 18.7 OptaSense
- 18.8 AP Sensing
- 18.9 Omnisens
- 18.10 Terra15
- 18.11 Institute of Mine Seismology
- 18.12 Other Relevant Market Participants
Note: Every listed company is profiled on the structure shown under the first company. The company list is preliminary and may change based on research findings, market developments, data availability and client requirements.
Chapter 19 Disclaimer
- 19.1 Research and Forecast Disclaimer
- 19.2 Data Source and Estimation Limitations
Note: The depth of individual sections depends on data availability for this market. Volume, capacity, trade and other unit-based metrics are included where applicable.

