
Streaming video, retail data and creators reshape ad budgets
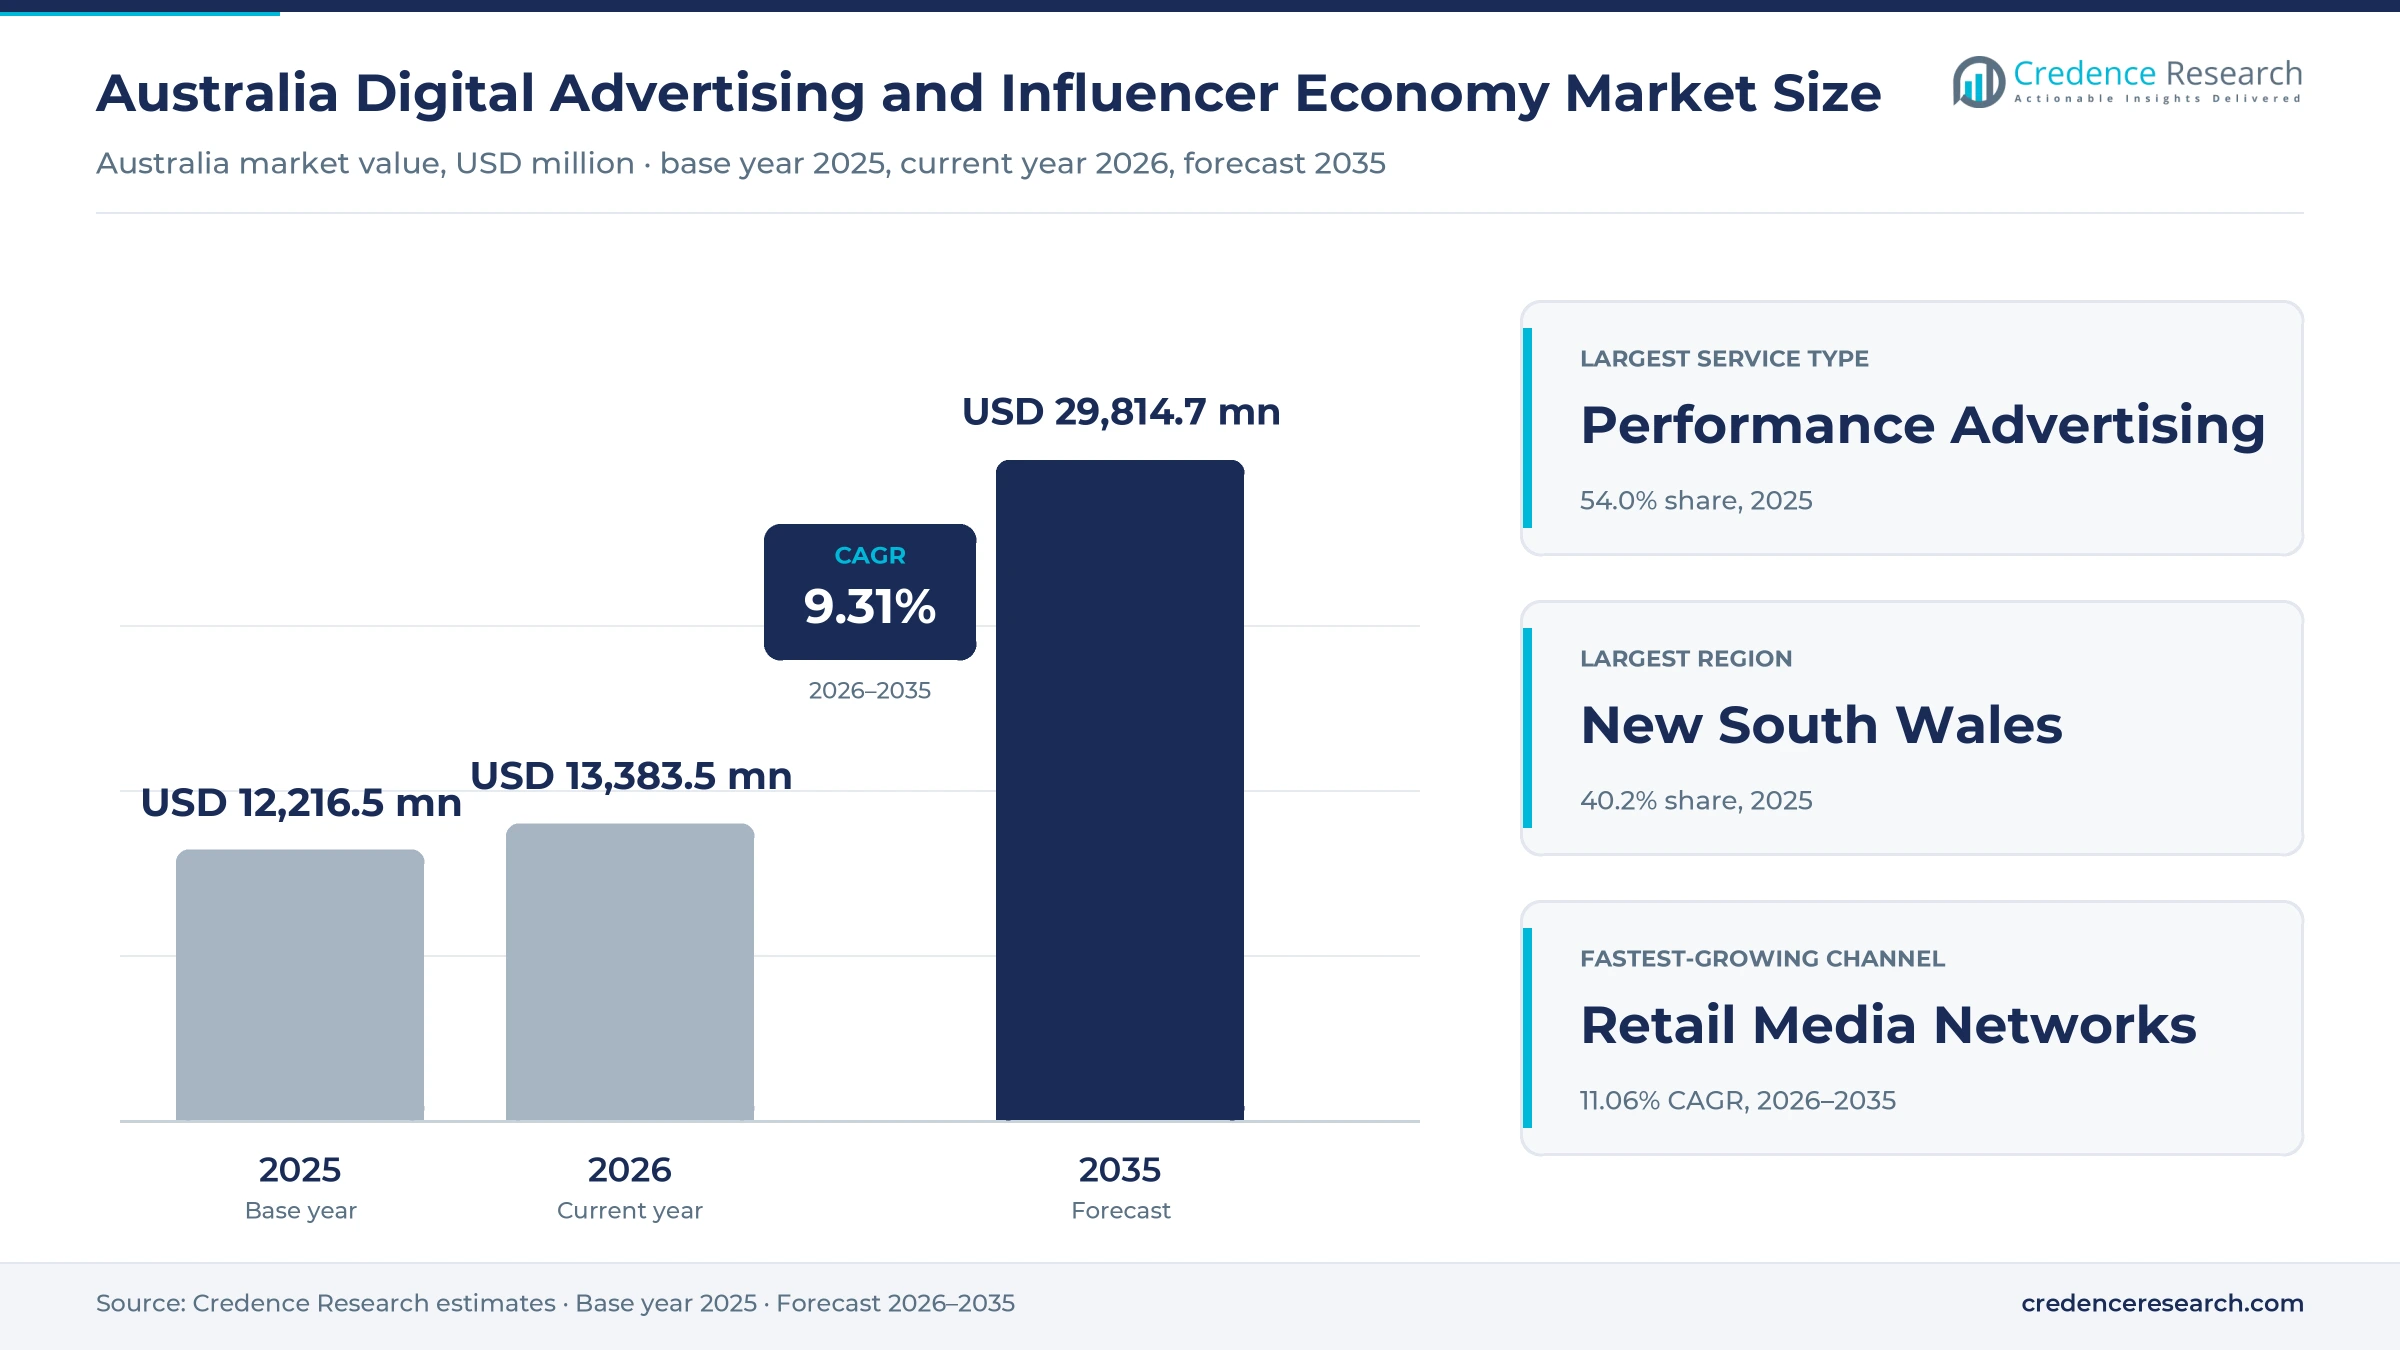
The Australia digital advertising and influencer economy market was valued at USD 12.22 billion in 2025 and is projected to increase from USD 13.38 billion in 2026 to USD 29.81 billion by 2035, registering a CAGR of 9.31% during 2026–2035. Demand comes from national brands, small businesses, property and car sellers, employers and public agencies that move budgets toward search, streaming video, social feeds, retailer sites and creators. New South Wales held the largest regional share, 40.2% in 2025, because Sydney concentrates brand head offices, media agencies and creator talent groups. Queensland is the fastest-growing region at 9.76% a year, supported by steady population gains in the south east of the state. In addition, age restrictions that took effect on Dec. 10, 2025, now stop most children under 16 from holding accounts on age-restricted social media platforms, which pushes advertisers toward older audiences and streaming services.
Which paid media and creator services fall inside the scope?
The estimate measures spending by advertisers in Australia on paid online media and on creator campaign services. It counts performance advertising such as search and cost-per-action placements, audience advertising such as streaming video, display and social reach, and fees for creator campaigns managed by agencies, talent groups or brands themselves, across the open web, social platforms and retail media networks.
The estimate excludes broadcast television airtime, print, outdoor posters and unpaid organic posts that carry no commercial fee. The value chain runs from advertisers and agencies through buying tools and platforms to publishers, marketplaces, retailers and creators, who earn income from placements, sponsorships and performance fees.
Australia Digital Advertising and Influencer Economy Market Insights
- The Australia digital advertising and influencer economy market was valued at USD 12.22 billion in 2025 and is projected to reach USD 29.81 billion by 2035, registering a CAGR of 9.31% during 2026–2035.
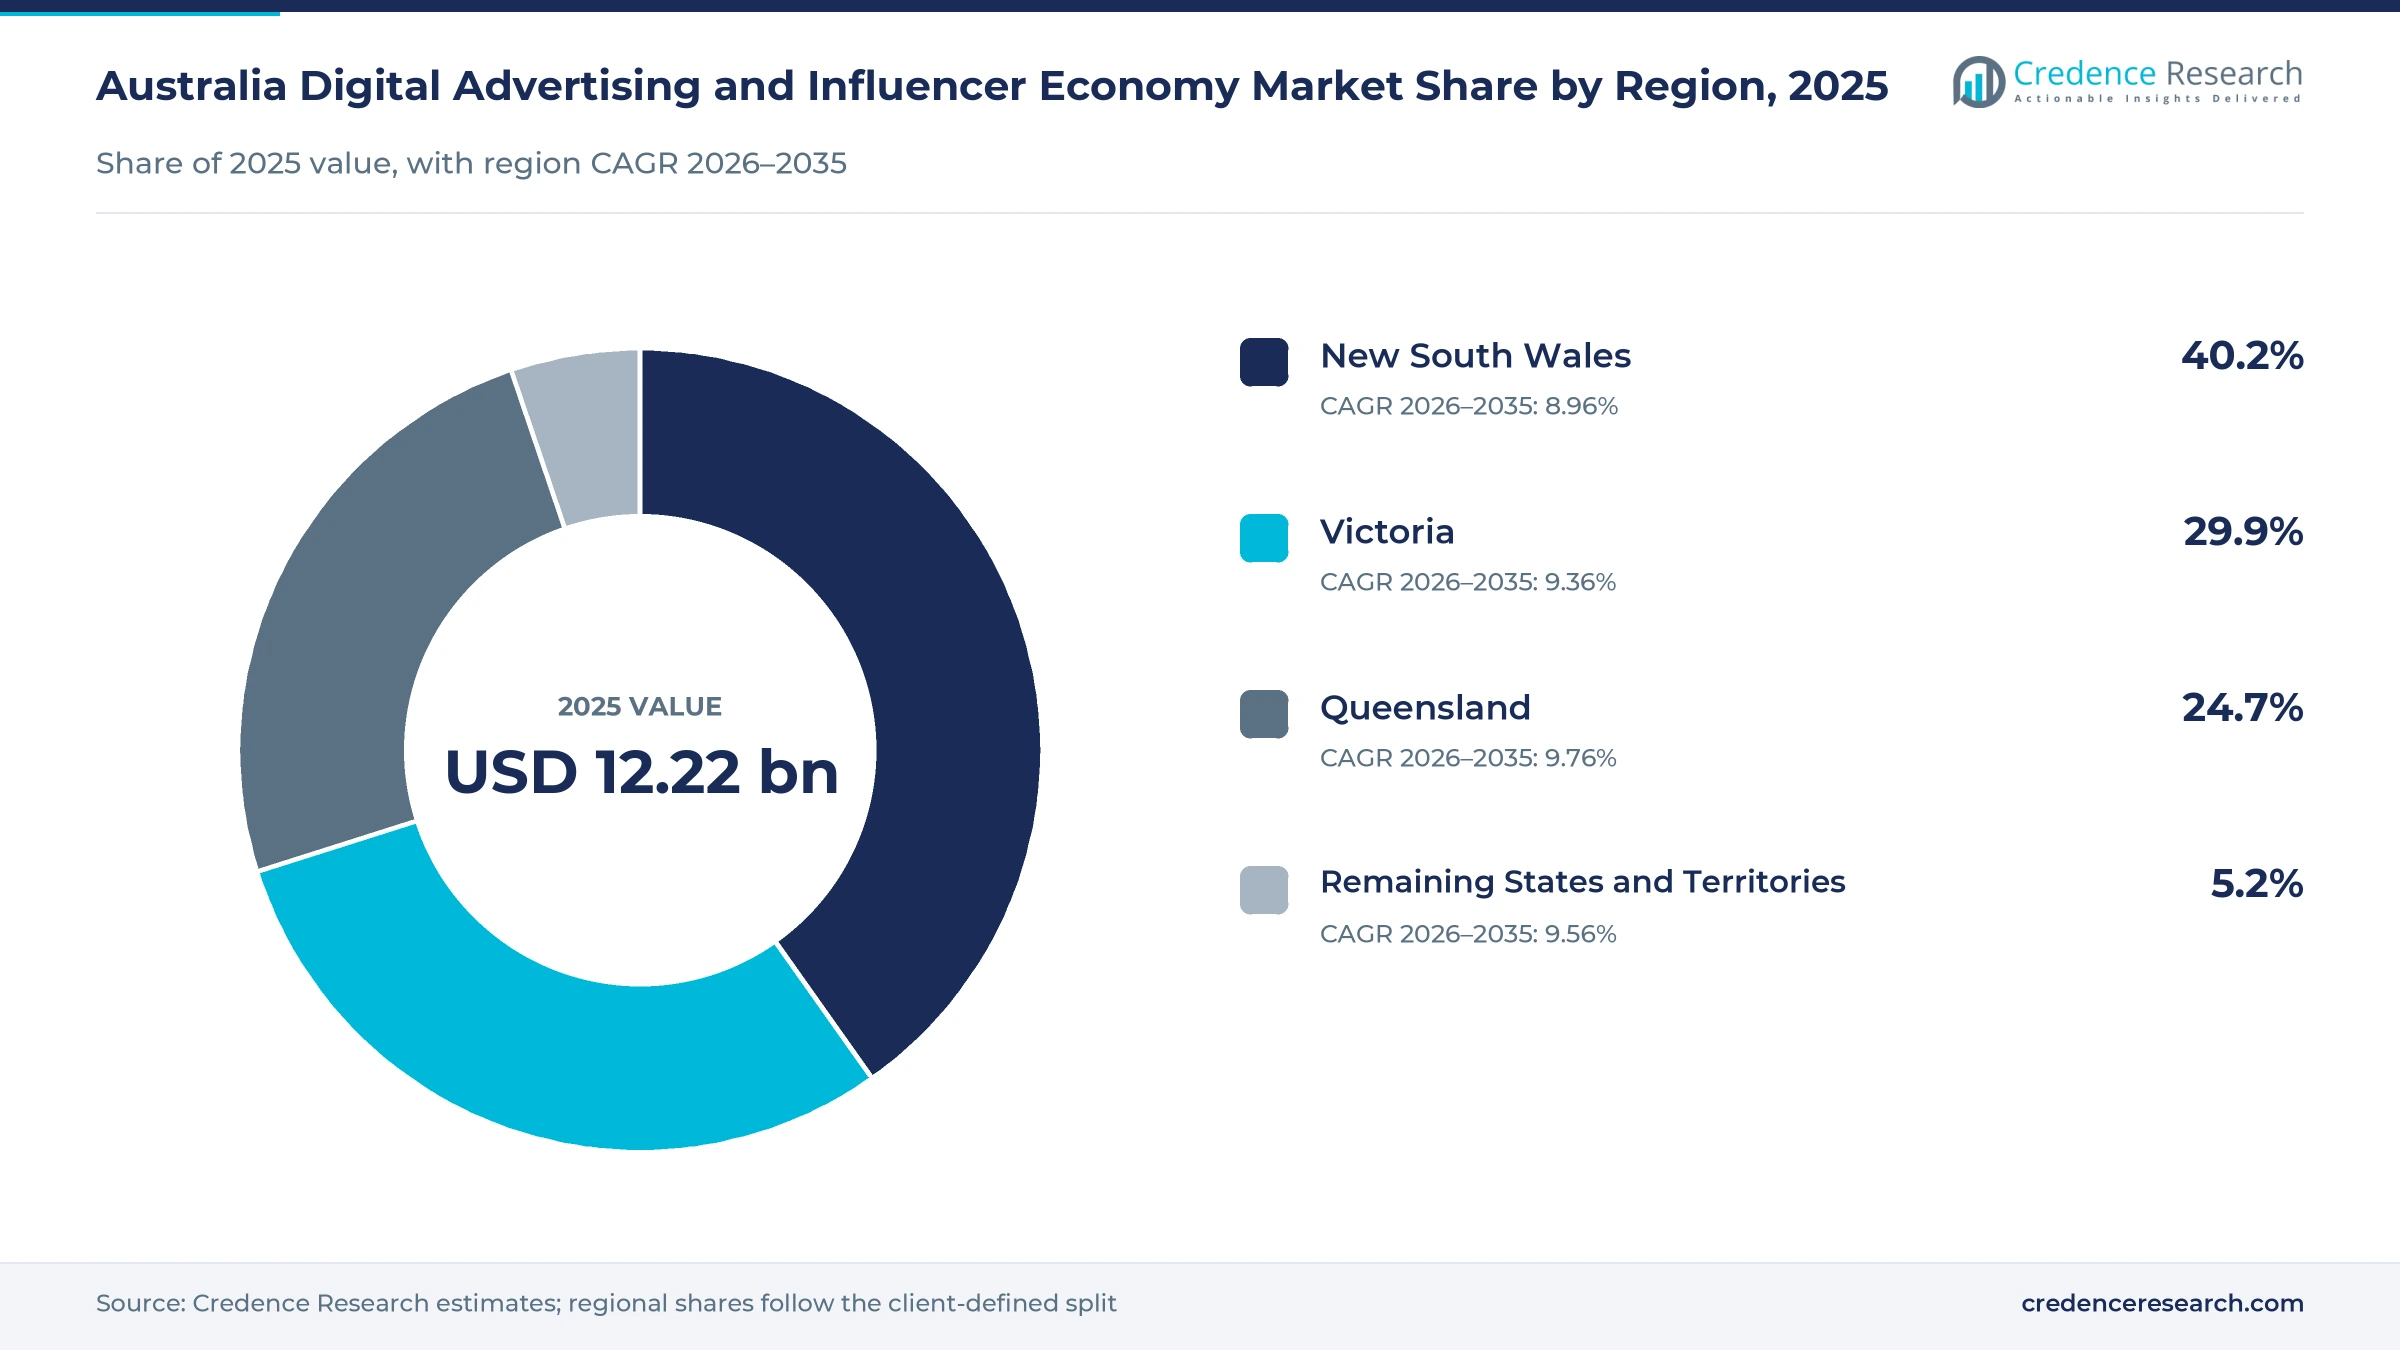
- New South Wales held a 40.2% share of 2025 value, as Sydney concentrates brand head offices, media agencies and creator talent groups.
- Performance Advertising led with a 54.0% share of 2025 value, because search and lead placements remain the base of most budgets.
- Connected TV took 60% of publisher video spending in the year to June 2026, up from 51% a year earlier, according to IAB Australia.
- Creator Campaign Services grow fastest at 11.60% a year during 2026–2035, as talent groups and discovery tools bring more brands to creators.
Performance ads lead while creator campaigns grow fastest
Why does performance buying hold the largest share?
Based on service type, the market is categorized into Performance Advertising, Audience Advertising and Creator Campaign Services. Performance Advertising led with a 54.0% share of 2025 value, because search, classified and lead placements tie spending directly to clicks and enquiries. Creator Campaign Services grows fastest at 11.60% a year, as brands pay agencies and talent groups to plan, brief and report sponsored creator content.
How do small businesses change the advertiser mix?
Based on customer type, the market is categorized into National Brand Advertisers, Independent Business Advertisers and Public Sector Advertisers. National Brand Advertisers led with a 52.0% share of 2025 value, because large retailers, banks, carmakers and telcos run national campaigns across many channels. Independent Business Advertisers grows fastest at 9.90% a year, as self-serve tools let local firms buy search, social and streaming ads with small budgets.
Which industries fund the most online advertising?
Based on end-use industry, the market is categorized into Retail and Consumer Goods, Property and Automotive, Financial and Business Services, and Consumer Services and Public Sector. Retail and Consumer Goods led with a 34.0% share of 2025 value, because retailers spend heavily on search, display and their own media networks. Retail and Consumer Goods also grows fastest at 9.77% a year, while property, car and online job classifieds keep listing fees steady.
Why are retail media networks gaining budget share?
Based on channel, the market is categorized into Open Web and Search, Social Platforms and Retail Media Networks. Open Web and Search led with a 52.0% share of 2025 value, because search results and publisher sites still capture most intent-driven spending. Retail Media Networks grows fastest at 11.06% a year, as retailers sell placements on their sites, apps and screens that link campaigns directly to sales.
| Segment Group | Leading Sub-segment | Share, 2025 | Fastest-growing Sub-segment | CAGR, 2026–2035 |
|---|---|---|---|---|
| By Service Type | Performance Advertising | 54.0% | Creator Campaign Services | 11.60% |
| By Customer Type | National Brand Advertisers | 52.0% | Independent Business Advertisers | 9.90% |
| By End-Use Industry | Retail and Consumer Goods | 34.0% | Retail and Consumer Goods | 9.77% |
| By Channel | Open Web and Search | 52.0% | Retail Media Networks | 11.06% |
Request a Free Sample
Fill in your details and we'll send you a free sample report.
- Sample data tables & charts
- Research methodology
Video, retail media and creator tools lift online budgets
How does video lift audience advertising budgets?
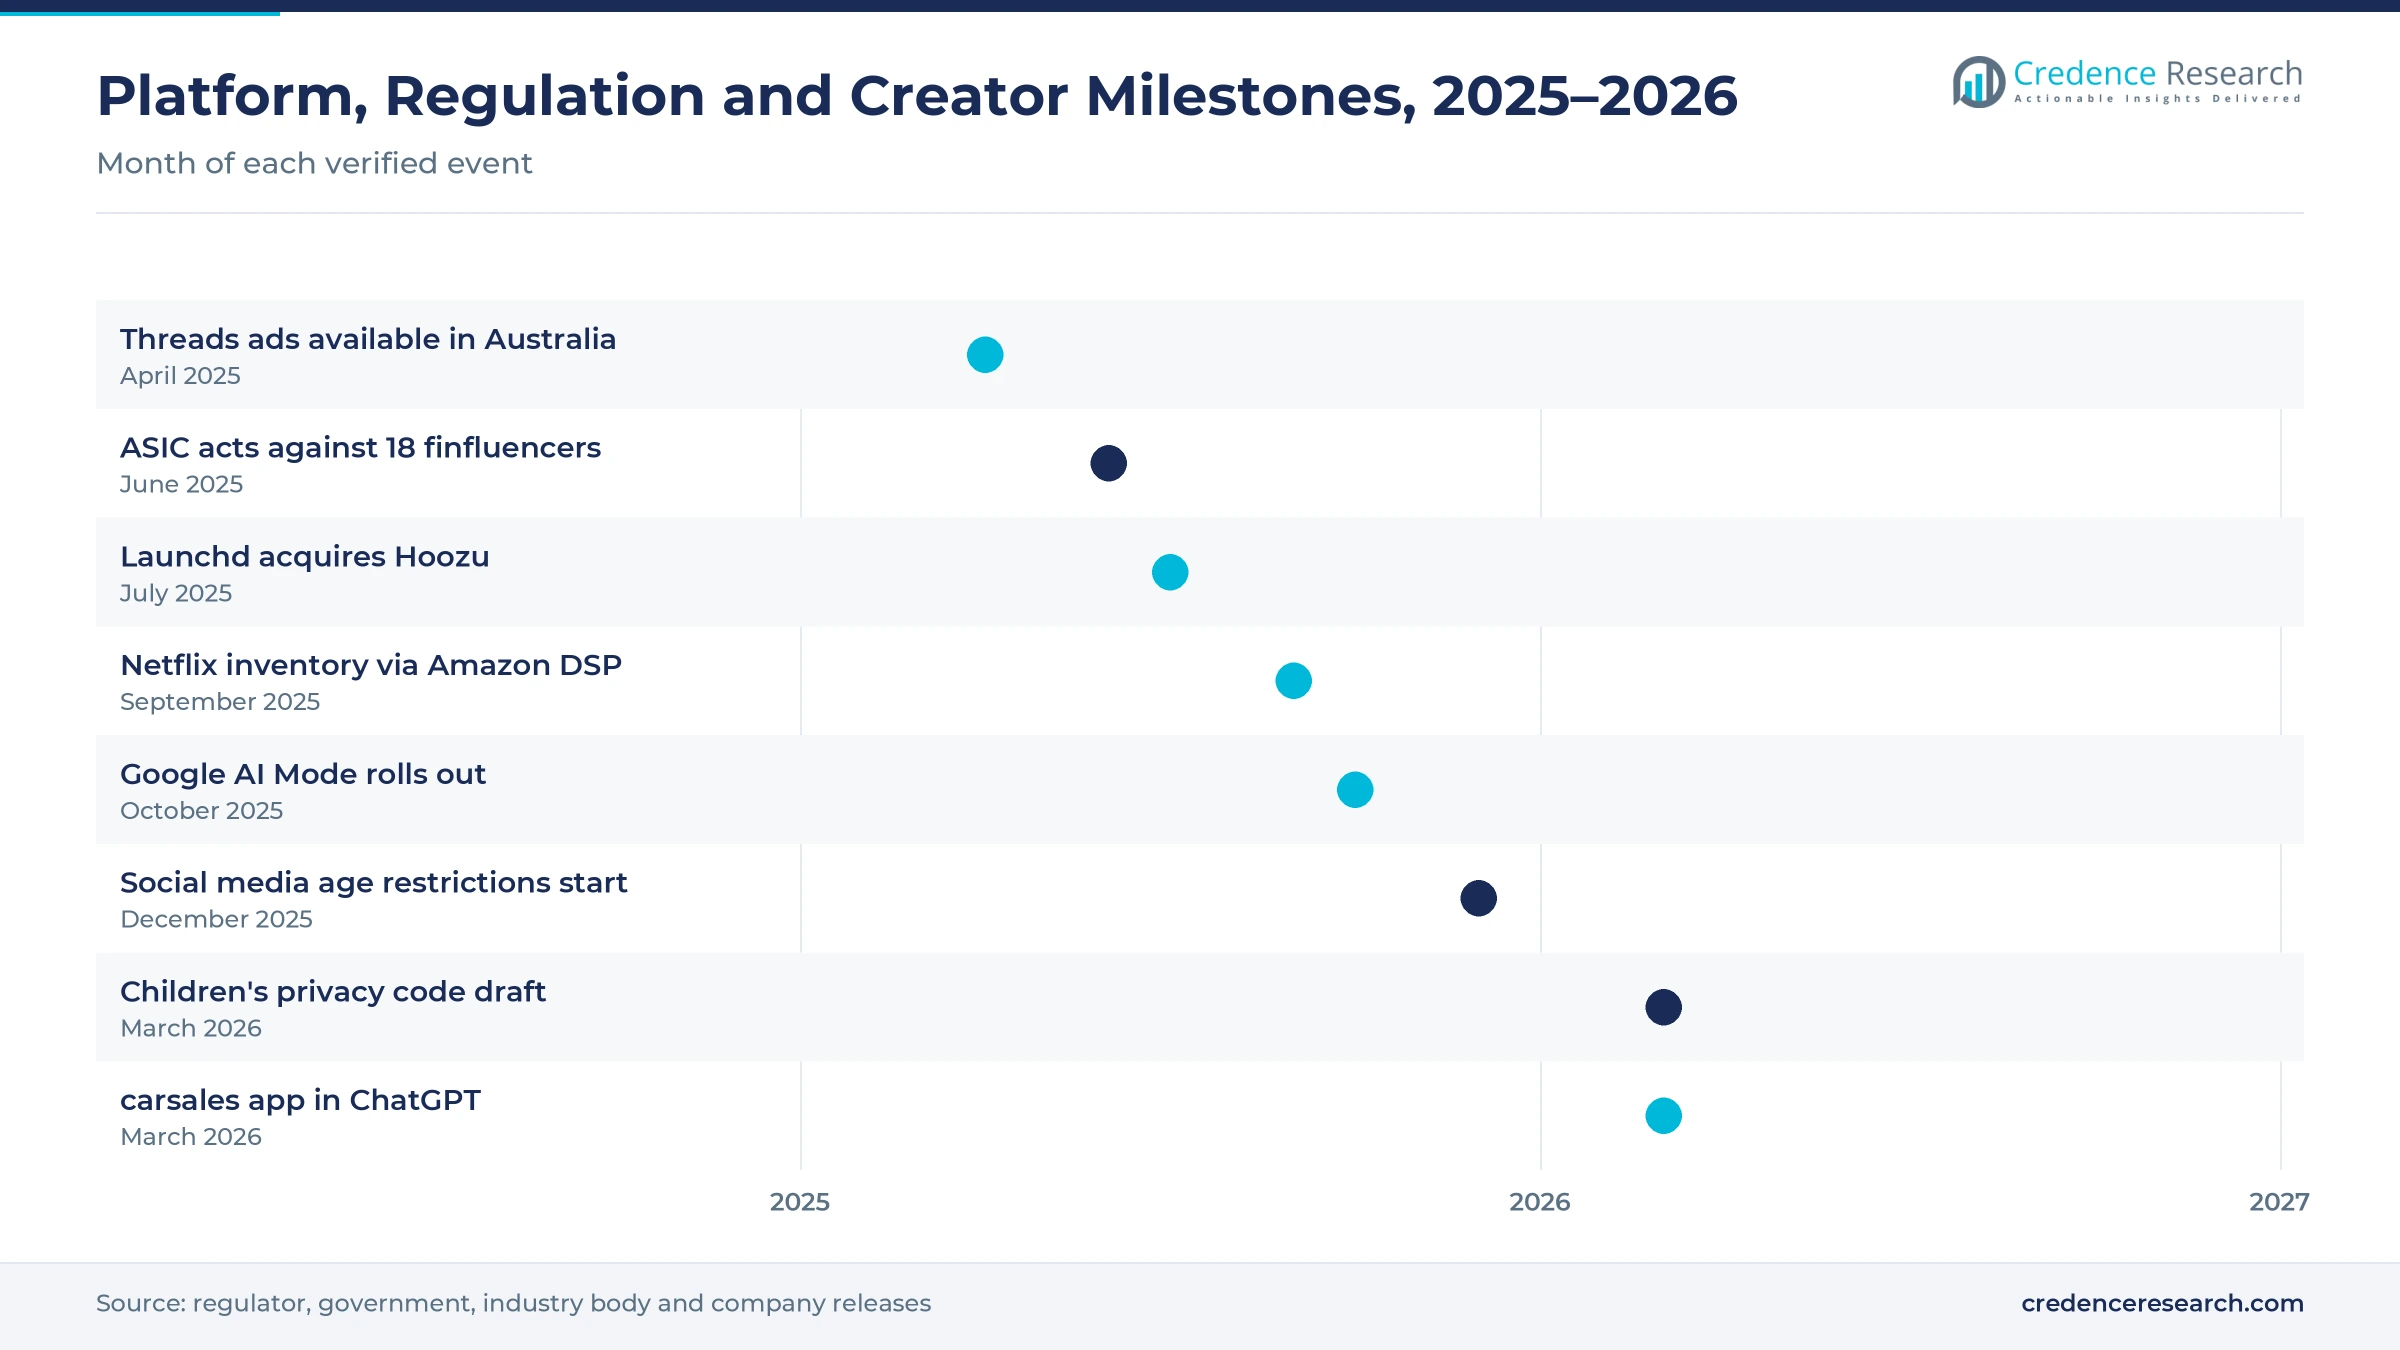
Video has become the main way publishers and platforms earn more from the same Australian audiences, because streaming and short-form formats command higher prices than static display. Video spending reached AUD 5.9 billion in the year to June 2026, up 18.8%, and made up 30% of online advertising, according to IAB Australia. Connected TV took 60% of publisher video expenditure in that year, up from 51% in the previous year. Amazon also said on Sept. 26, 2025, that Prime Video ads reach over 5 million ad-supported monthly viewers in Australia, according to Amazon Ads. The same release said Australian advertisers could buy Netflix inventory through the Amazon demand-side platform from the fourth quarter of 2025. As a result, audience advertising keeps taking budget from static display formats.
Why are retailers turning shopper data into ad revenue?
Retailers now sell advertising on their websites, apps, stores and partner sites, because shopper data links campaigns directly to sales. A June 2026 survey of 92 decision makers by IAB Australia found that 63% of active buyers increased spending on retailers' own sites and apps over the past year. The same study found that 65% increased spending on retailer-powered advertising outside owned channels. Retail was also the largest category of publisher general display at 17.8% in the year to June 2026, up from 17.2%. Amazon Ads adds another outlet, because banks and carmakers can buy Prime Video placements without selling on Amazon. In turn, Retail Media Networks grows fastest at 11.06% a year during 2026–2035.
How are creator tools widening the advertiser base?
Creator discovery tools and talent groups make it easier for brands of every size to find and pay local creators, which widens the pool of advertisers buying social campaigns. Social video spending reached AUD 2.4 billion in the year to June 2026, up 29.5%, and took 41% of video expenditure, according to IAB Australia. Launchd, an Australian talent and brand partnerships group, bought the influencer agency Hoozu on July 30, 2025, and made its Sydney office the creator marketing lead for the group, according to AdNews. Moneysmart research cited by ASIC found that 63% of Gen Z Australians rely on social media for financial information. As a result, Creator Campaign Services grows fastest at 11.60% a year during 2026–2035.
What keeps search budgets rising as AI changes queries?
Search remains the base of performance budgets, and AI features are adding longer, conversational queries that advertisers want to reach. About 96% of Australians used the internet in 2024, according to World Bank data. Search spending reached AUD 8.6 billion in the year to June 2026, up 13.2%, and held 43% of online advertising, according to IAB Australia. Google began rolling out AI Mode to Australians on Oct. 8, 2025, adding a conversational search format with longer queries. carsales launched an app inside ChatGPT in March 2026, while its 2026 car buyer report found that more than one in three buyers use AI in their search, according to B&T. As a result, Performance Advertising led with 54.0% of 2025 value, because search still captures most intent-driven budgets.
Connected TV, consent rules and marketplaces reshape spend
Why is connected TV buying shifting to automated tools?
Streaming television is shifting from fixed upfront deals toward automated buying across several services, which lets advertisers plan reach and frequency as they do online. Connected TV's 60% share of publisher video spending shows that the large screen now carries most premium video inventory. Amazon Ads said it will bring its Complete TV suite to Australia in 2026, so buyers can plan and measure streaming campaigns across Prime Video and other publishers. Nine also built Nine Ad Manager to sell 9Now video ads on connected TV, web and app through a self-serve tool, according to B&T. As a result, programmatic buying tools are gaining a larger role in streaming campaigns.
How are consent and age rules reshaping targeting?
Targeting is shifting toward consent-based first-party data, because new age and privacy rules limit how platforms reach younger users. Restrictions that took effect on Dec. 10, 2025, prevent most under-16s from holding accounts on age-restricted social media platforms, according to the federal youth portal. The OAIC released an exposure draft of its Children's Online Privacy Code on March 31, 2026, requiring explicit consent before children's data is used for direct marketing, according to The Lawyer Magazine. The OAIC is working toward registering the code on Dec. 10, 2026. In turn, advertisers rely more on logged-in retailer, streaming and marketplace audiences.
Can common measurement open more retail media budget?
Common measurement standards give retailers a clear opening, because buyers say inconsistent metrics hold back larger retail media commitments. In the IAB Australia retail media study of June 2026, 73% of active buyers named inconsistent metrics and definitions across networks as their top challenge. The study also found that 83% of buyers want incremental sales measurement, while only 64% of retailers offer it. About 80% of buyers said a retailer's IAB certification would make them more willing to work with that network. As a result, retailers that offer audited sales lift reporting can win budget shifted from trade promotions and other channels.
Can property, car and job marketplaces open new ad lines?
Property, car and job marketplaces have an opening to sell more advertising around their large logged-in audiences of buyers, sellers and job seekers. Classifieds spending reached AUD 3.1 billion in the year to June 2026, up 12.6%, its first double-digit financial-year growth since 2022, according to IAB Australia. realestate.com.au averaged a record 12.7 million monthly visitors in REA Group's 2026 financial year, with 146.4 million average monthly visits, according to Online Marketplaces. Automotive also lifted its share of publisher general display to 14.2% in the same year. In turn, marketplaces can sell brand placements to banks, insurers and carmakers beside listing products.
Age limits, disclosure rules and news levies test platforms
How do social media age limits shrink youth reach?
Age restrictions that began on Dec. 10, 2025, remove most under-16 users from age-restricted social media platforms. Brands selling snacks, games, fashion and entertainment lose a direct route to young audiences that once watched creator content on these apps. As a result, campaigns aimed at families must move to streaming, gaming and parent-focused media. Platforms respond with age assurance tools, while advertisers shift budgets to older creators, streaming services and adult audiences.
Why does disclosure enforcement raise influencer risk?
The ACCC reviewed 118 influencers across seven sectors and found that 81% had posts raising concerns about potentially misleading advertising, according to its December 2023 release. The sweep covered Instagram, TikTok, Snapchat, YouTube, Facebook and Twitch, which together carry most paid creator work. In turn, brands face legal risk when sponsored posts are not clearly labeled. Agencies respond with written briefs, disclosure checks and contract clauses before sponsored content goes live.
How do finfluencer rules limit financial promotions?
ASIC acted against 18 suspected unlawful finfluencers in 2025 and issued warning notices to four more in April 2026. Unlicensed finfluencers who give financial advice could face up to five years' imprisonment, according to the regulator. As a result, banks, brokers and trading apps must check that paid creators hold licenses or avoid personal advice. Many financial brands now restrict creator work to general education and use licensed presenters for product content.
Why does the news bargaining plan add platform costs?
Treasury released a consultation paper on Nov. 13, 2025, for a News Bargaining Incentive that covers large digital platforms with significant social media or search services in Australia. The measure gives a deduction for eligible deals with news publishers and cannot be avoided by removing news content. In turn, the largest platforms face higher local costs or new publisher payments. Platforms respond by negotiating content deals and reviewing how they price local advertising.
New South Wales leads while Queensland grows fastest
| Region | Value, 2025 (USD billion) | Share, 2025 | CAGR, 2026–2035 |
|---|---|---|---|
| New South Wales | 4.91 | 40.2% | 8.96% |
| Victoria | 3.65 | 29.9% | 9.36% |
| Queensland | 3.02 | 24.7% | 9.76% |
| Remaining States and Territories | 0.64 | 5.2% | 9.56% |
Sydney head offices anchor national campaign buying
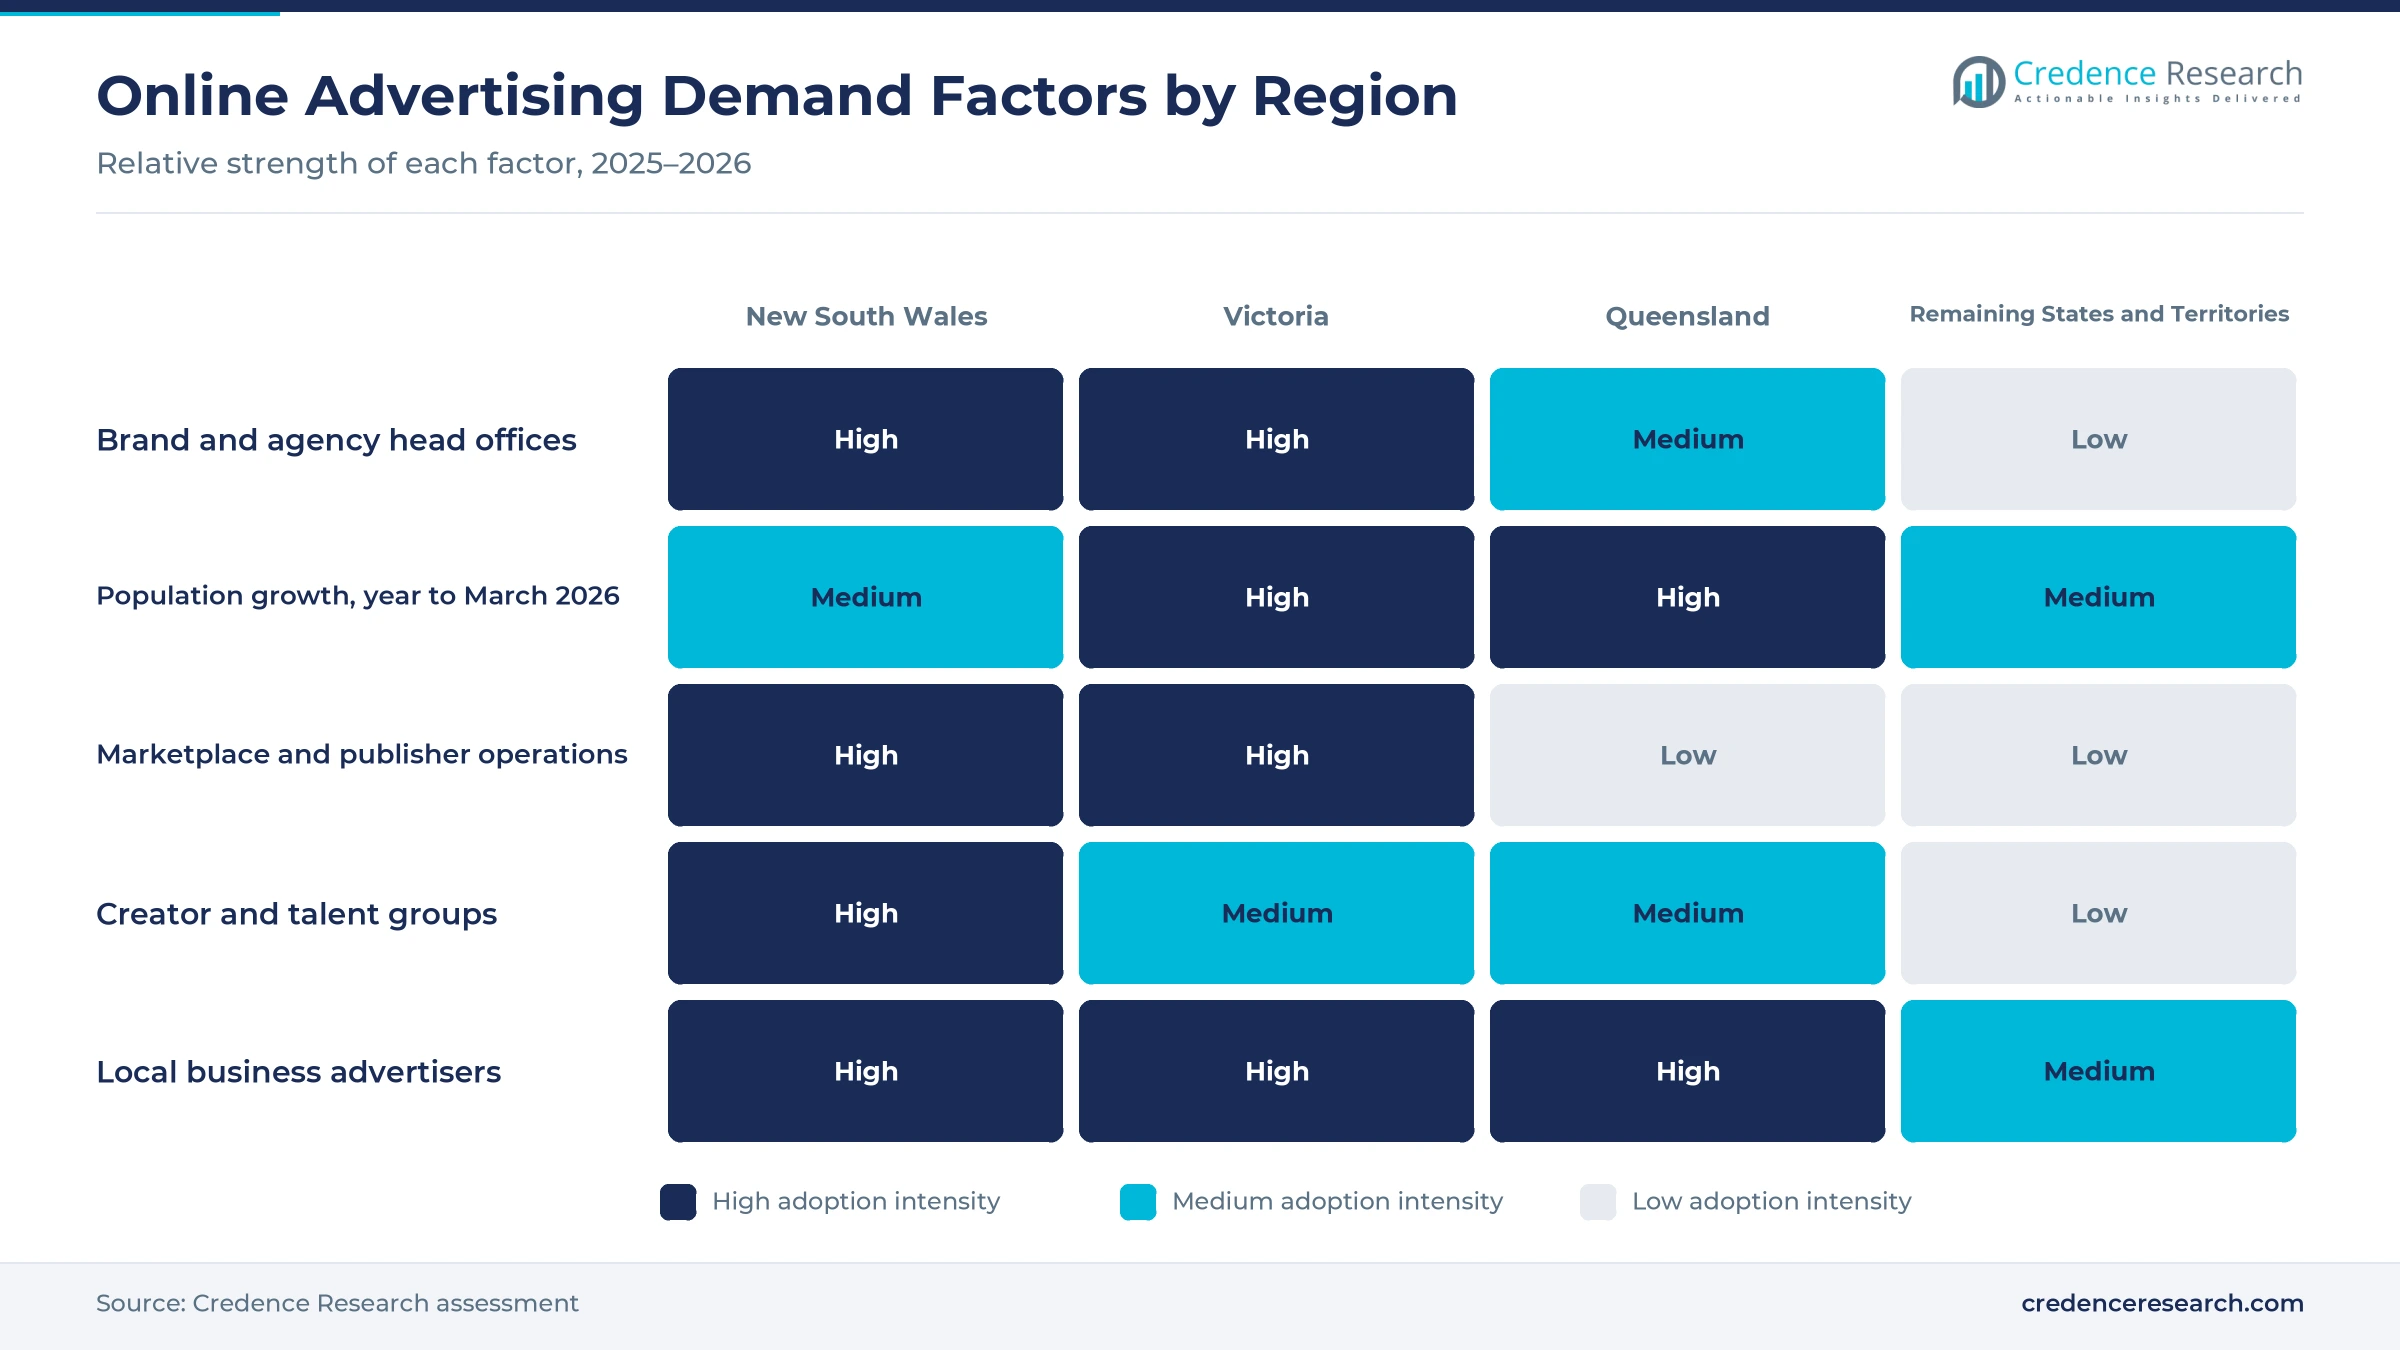
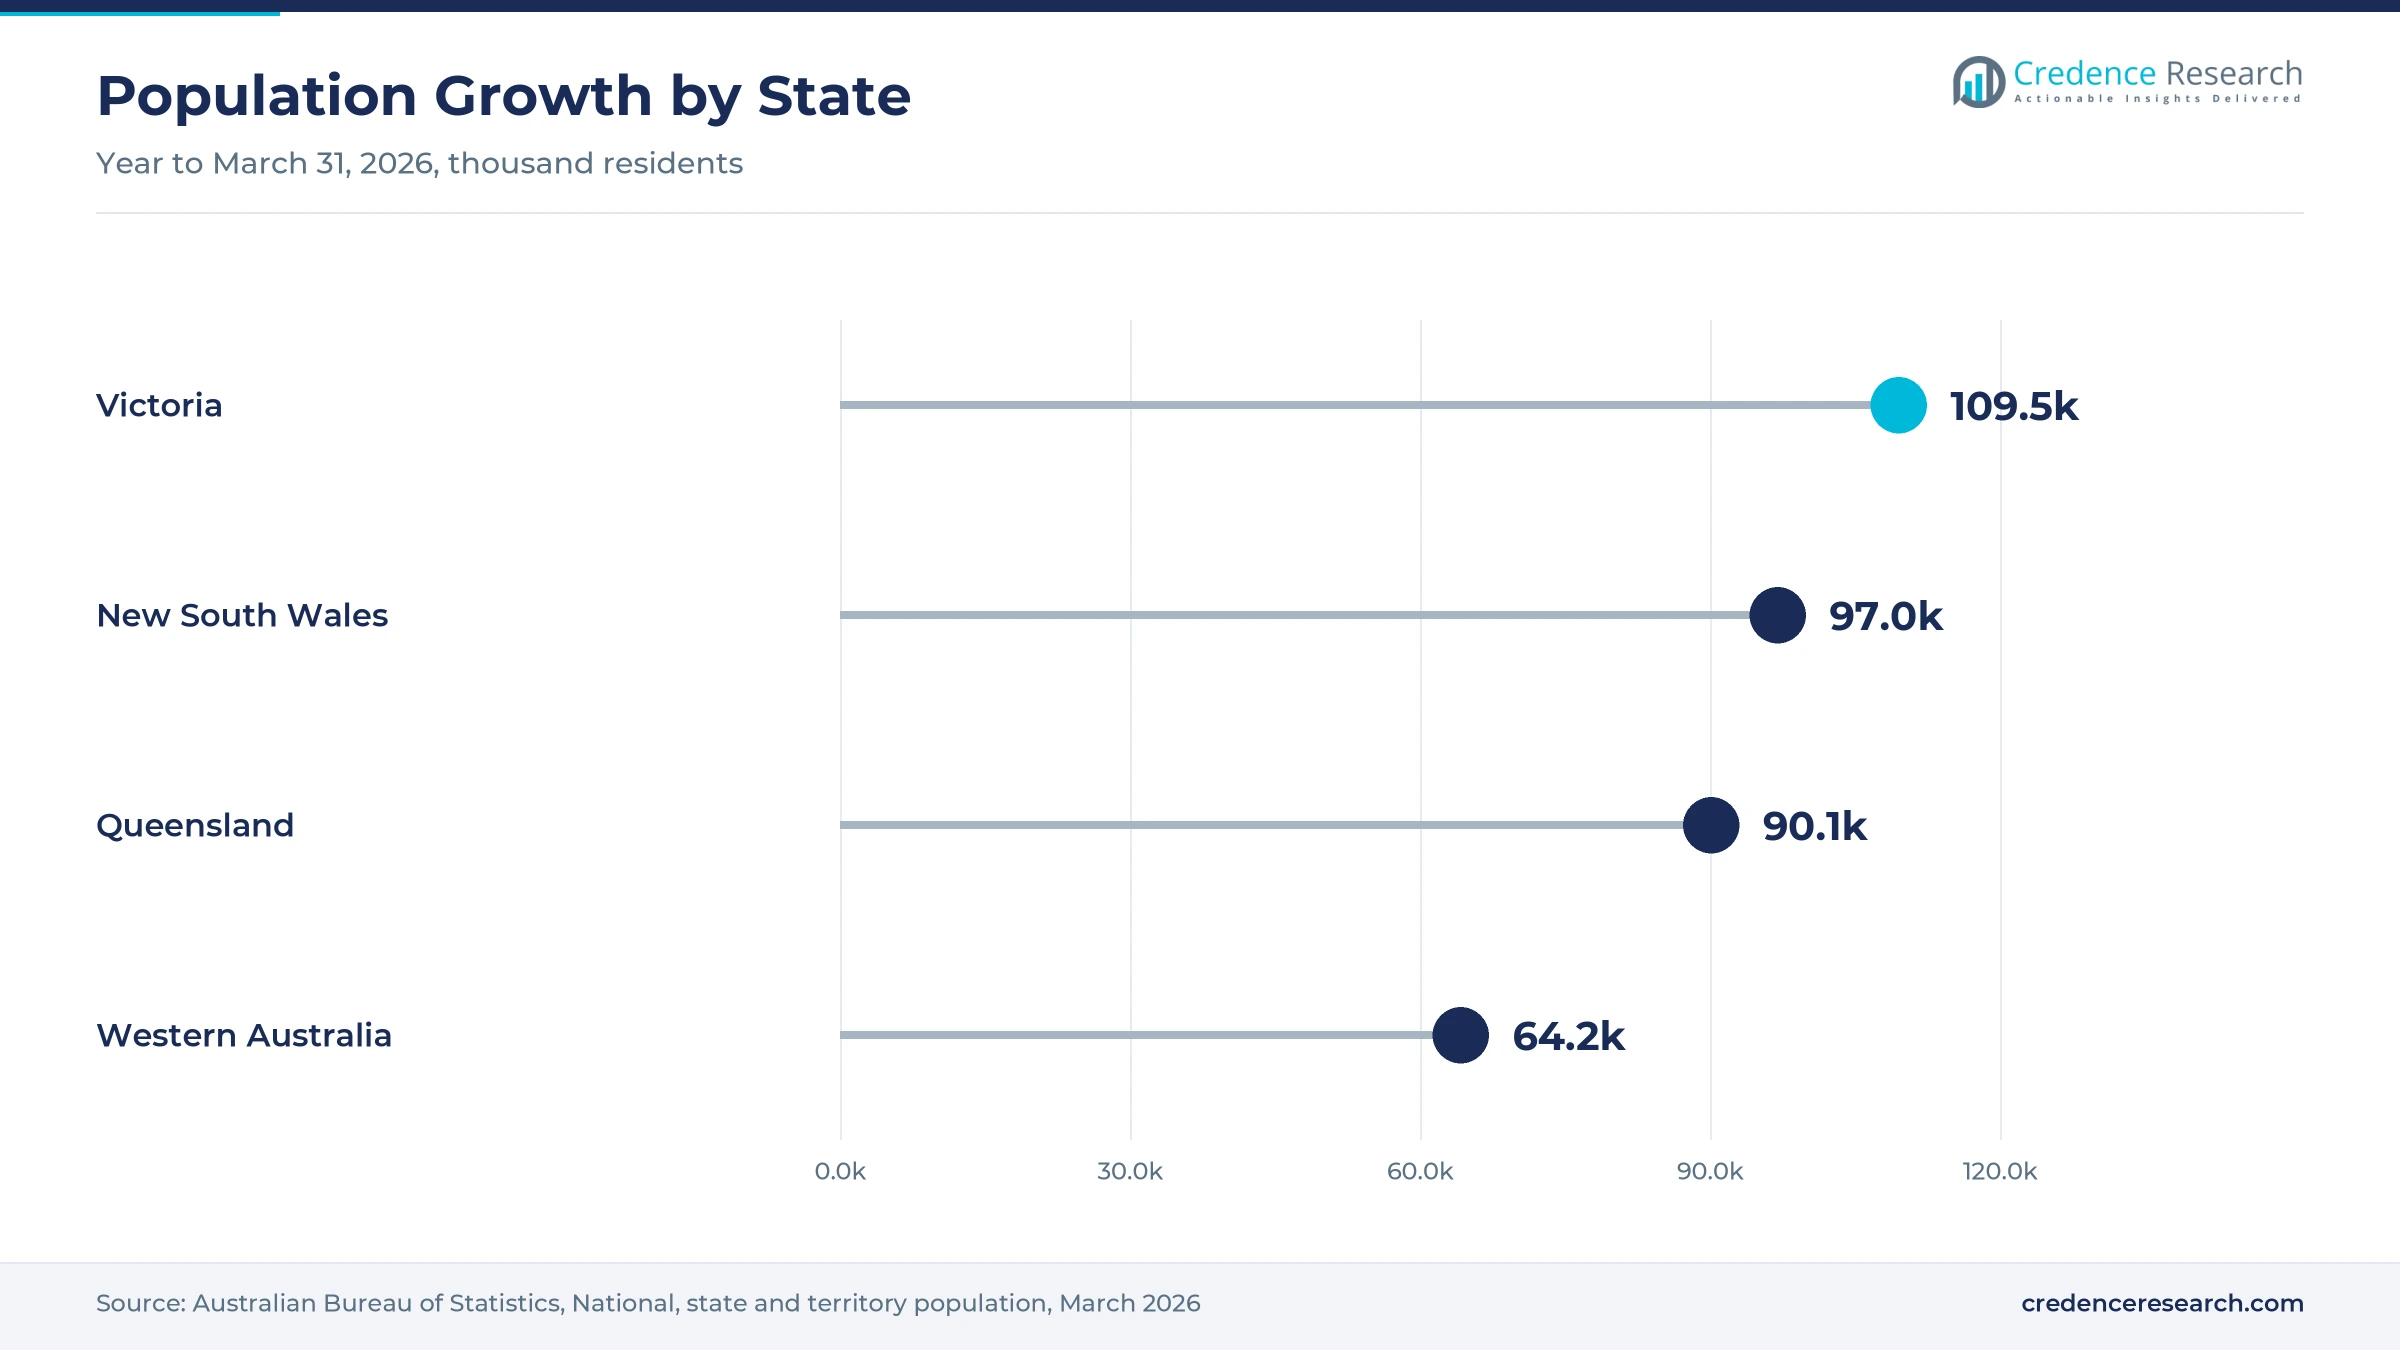
New South Wales held a 40.2% share of 2025 value and grows at 8.96% a year. The state had 8.67 million residents at March 31, 2026, the largest population in the country, according to the Australian Bureau of Statistics. Sydney also hosted TikTok's Spotlight event for advertisers in March 2026 and houses the Hoozu office that leads creator marketing for the Launchd group. As a result, national campaigns are often planned and bought from the state.
How do Melbourne marketplaces shape demand in Victoria?
Victoria held a 29.9% share of 2025 value and grows at 9.36% a year, supported by the fastest population increase in absolute terms. The state added 109,500 residents in the year to March 2026, more than any other state. SEEK is headquartered in Cremorne, Victoria and sells premium job ads that appear at the top of its search results to employers across the country. In turn, classifieds and retail advertising carry a large part of the state's online spending.
Why does Queensland grow fastest among the regions?
Queensland held a 24.7% share of 2025 value and grows fastest at 9.76% a year. The state added 90,100 residents in the year to March 2026, a 1.6% rise that matched Victoria's growth rate. New households in the south east lift demand for property, car, retail and service advertising. As a result, local businesses in Brisbane, the Gold Coast and the Sunshine Coast increase spending on search, social and streaming placements.
Western Australia growth lifts the smaller jurisdictions
Remaining States and Territories held a 5.2% share of 2025 value and grow at 9.56% a year. Western Australia recorded the fastest population growth of any state at 2.1% in the year to March 2026, which lifts local retail and property demand. Most national campaigns that reach these areas are planned and billed from Sydney or Melbourne. In turn, regional spending is led by local retailers, councils and service businesses buying search and social placements.
Streaming deals, AI search and creator agency moves
| Development | Status and market relevance |
|---|---|
| In July 2025, Launchd acquired the influencer agency Hoozu, which kept its own brand and leadership. | Sydney office now leads creator marketing for the group |
| In September 2025, Amazon Ads said Australian advertisers could buy Netflix inventory through Amazon DSP from the fourth quarter. | Widens automated access to premium streaming inventory |
| In October 2025, Google began rolling out AI Mode in Search to users in Australia. | Adds conversational queries that advertisers aim to reach |
| In March 2026, carsales launched a dedicated app inside ChatGPT for car shoppers. | Brings dealer and private listings into an AI assistant |
| In April 2026, ASIC issued warning notices to four finfluencers during a global week of action. | Raises compliance checks on paid financial creator content |
AI search, streaming ad tools and creator software lead
- AI search formats answer longer, conversational queries and show sponsored results beside summaries, which changes how performance budgets are planned.
- Streaming ad platforms let buyers plan, buy and measure connected TV campaigns across several services, which brings online-style targeting to the large screen.
- Retail media tools use loyalty and purchase data to target shoppers on retailer sites and in stores, which links placements to measured sales.
- Creator management software helps brands find, brief, pay and track creators, which supports social commerce campaigns and disclosure checks.
Need a Custom Version of This Report?
Tailor the scope, geography, or segments to your exact requirements.
- Custom geography or segment scope
- Direct access to our analyst team
Global platforms and local marketplaces compete for budgets
Competition is split between global platforms that sell search, social and video reach and local marketplaces and media groups that own logged-in audiences. Google adds AI Mode to search, while Meta has sold Threads ads in Australia since April 2025 alongside Facebook and Instagram. TikTok sells short-video campaigns to Australian brands and hosted its Spotlight event for advertisers in Sydney in March 2026. Microsoft Advertising brought display, native and video inventory on MSN, Outlook and Microsoft Casual Games in Australia in-house from March 1, 2025. Amazon Ads offers Prime Video reach and Netflix inventory, while Nine sells 9Now video through a self-serve tool. REA Group, SEEK and CAR Group sell listings and brand placements on property, job and car marketplaces. Hoozu runs creator campaigns from Sydney within the Launchd group. Rivals compete on audience data, measurement and automated buying, which favors firms with first-party logins.
Which companies sell online ads and creator services?
| Company | Type | Role in the market |
|---|---|---|
| Search and video platform | AI Mode rollout in Australia, October 2025 | |
| Meta | Social platform | Threads ads in Australia since April 2025 |
| TikTok | Short-video platform | Short-video ads, Spotlight advertiser event in Sydney, March 2026 |
| Microsoft Advertising | Search and display network | In-house sales of MSN and Outlook inventory, March 2025 |
| Amazon Ads | Retail and streaming media | Prime Video ads and Netflix inventory via Amazon DSP |
| Nine Entertainment | Broadcaster and streaming publisher | Self-serve Nine Ad Manager for 9Now video |
| REA Group | Property marketplace | 12.7 million monthly visitors on realestate.com.au, FY2026 |
| SEEK | Job marketplace | Premium job ads, headquartered in Cremorne, Victoria |
| CAR Group | Car marketplace | carsales app inside ChatGPT, March 2026 |
| Hoozu | Influencer agency | Creator marketing lead for the Launchd group, 2025 |
Video and retail data keep online budgets rising
Credence Research's view is that the Australia digital advertising and influencer economy market will keep growing faster than overall media spending, because video, retail data and creators give advertisers measurable reach. Performance Advertising remains the largest value pool, but Creator Campaign Services and Retail Media Networks add the fastest growth. Firms that own logged-in audiences and offer audited measurement should gain share. Age limits, disclosure rules and news bargaining costs will raise compliance work, especially for social platforms and creator agencies.
Model built from industry spend data and official statistics
The report uses 2025 as the base year on a calendar basis, and market values come from the Credence Research model. That model draws on industry spend data published by IAB Australia, official population and internet use statistics, regulator releases and company announcements on launches, deals and products. Segment splits and regional growth rates are Credence Research estimates, while regional shares follow the client-defined split. Sources used are industry body releases, official statistics, regulator and government releases, trade press and company releases, and no interviews or surveys were used.
Streaming, retail media and creators carry growth to 2035
The Australia digital advertising and influencer economy market is expected to reach USD 29.81 billion by 2035, a 9.31% CAGR during 2026–2035, as streaming video, retail media and creator campaigns take a larger share of budgets. Growth should be strongest through 2029 while connected TV buying automates and retailers improve measurement. After that, AI search formats and marketplace advertising will carry more of the value. Stricter age and privacy rules would slow social targeting, while faster retail media adoption would lift spending.
Frequently Asked Questions
How big is the Australia digital advertising and influencer economy market?
Which service type leads Australian online ad spending?
Which region leads the Australian market?
How fast is video advertising growing in Australia?
Why are retail media networks growing fastest?
How do the social media age limits affect advertisers?
Who are the leading companies in Australian online advertising?
What are the main challenges for the market?
Table of Content
Chapter 1 Market Segmentation
- 1.1 Segmentation Framework
- 1.1.1 Product and Service Classification
- 1.1.2 Application and End-Use Classification
- 1.1.3 Technology and Solution Classification
- 1.1.4 Customer and Distribution Channel Classification
- 1.1.5 Geographic Segmentation
- 1.1.6 Market Segment Definitions and Boundaries
- 1.2 By Service Type
- 1.2.1 Performance Advertising
- 1.2.2 Audience Advertising
- 1.2.3 Creator Campaign Services
- 1.3 By Customer Type
- 1.3.1 National Brand Advertisers
- 1.3.2 Independent Business Advertisers
- 1.3.3 Public Sector Advertisers
- 1.4 By End-Use Industry
- 1.4.1 Retail and Consumer Goods
- 1.4.2 Property and Automotive
- 1.4.3 Financial and Business Services
- 1.4.4 Consumer Services and Public Sector
- 1.5 By Channel
- 1.5.1 Open Web and Search
- 1.5.2 Social Platforms
- 1.5.3 Retail Media Networks
Chapter 2 Introduction
- 2.1 Report Objectives and Scope
- 2.2 Product Definition and Industry Terminology
- 2.3 Market Inclusions and Exclusions
- 2.4 Research Process
- 2.4.1 Primary Research and Expert Interviews
- 2.4.2 Secondary Research and Source Review
- 2.4.3 Top-Down and Bottom-Up Estimation
- 2.4.4 Data Triangulation and Verification
- 2.5 Market Size Measurement Basis
- 2.5.1 2025: USD 12.22 billion → 2035: USD 29.81 billion
- 2.6 Historical and Forecast Reference Periods
- 2.6.1 Historical Period: 2018-2025
- 2.6.2 Base Year: 2025
- 2.6.3 Forecast Period: 2025-2035
- 2.7 Research Assumptions and Limitations
Chapter 3 Executive Summary
- 3.1 Market Snapshot and Key Findings
- 3.2 Base-Year Market Size, 2025
- 3.3 Forecast Market Size, 2035
- 3.4 Revenue and Volume Growth Outlook
- 3.5 Key Demand and Supply Indicators
- 3.6 Leading Market Segments
- 3.7 Fastest-Growing Market Opportunities
- 3.8 Regional Performance Highlights
- 3.9 Technology and Industry Transformation
- 3.10 Competitive Landscape Summary
- 3.11 Analyst View and Strategic Implications
Chapter 4 Australia Digital Advertising and Influencer Economy Market Trends and Developments
- 4.1 Historical Industry Development, 2018-2025
- 4.2 Recent Market Trends and Developments
- 4.3 Demand and Customer Behavior Trends
- 4.4 Technology and Product Innovation
- 4.5 Artificial Intelligence, Automation and Digitalization
- 4.6 Local Manufacturing and Supply Chain Realignment
- 4.7 Industry Partnerships, Mergers and Acquisitions
- 4.8 Sustainability and Circular Economy Developments
- 4.9 Government and Private Sector Investment Trends
- 4.10 Emerging Business Models and Commercialization
- 4.11 Industry Developments and Announcements
Chapter 5 Australia Digital Advertising and Influencer Economy Market Production, Supply and Demand Analysis
- 5.1 Demand Trend and Consumption Analysis, 2018-2025
- 5.2 Demand Forecast, 2025-2035
- 5.3 Production and Output Trend, 2018-2025
- 5.4 Production and Output Forecast, 2025-2035
- 5.5 Installed Capacity and Capacity Utilization
- 5.6 Company-Wise Production Plants and Statistics
- 5.6.1 Installed Production Capacity
- 5.6.2 Actual Production
- 5.6.3 Planned Capacity and Expansion Targets
- 5.7 Supply Chain Structure and Procurement Trends
- 5.8 Supply-Demand Gap and Bottlenecks
- 5.9 Import Dependence and Sourcing Structure
- 5.10 Contract Manufacturing and Outsourcing
- 5.11 Regional Supply and Demand Concentration
Chapter 6 Australia Digital Advertising and Influencer Economy Market Pricing Analysis
- 6.1 Pricing Structure and Measurement
- 6.2 Historical Pricing Trends, 2018-2025
- 6.3 Pricing Outlook, 2025-2035
- 6.4 Average Selling Price and Unit Economics
- 6.5 Pricing by Product and Market Segment
- 6.6 Geographic Pricing Differences
- 6.7 Key Input, Energy, Labor and Logistics Costs
- 6.8 Contract Pricing and Purchasing Models
- 6.9 Pricing Sensitivity and Competitive Positioning
- 6.10 Price, Margin and Profitability Implications
Chapter 7 Australia Digital Advertising and Influencer Economy Market Dynamics
- 7.1 Market Growth Drivers
- 7.1.1 Demand-Side Drivers
- 7.1.2 Technology and Innovation Drivers
- 7.1.3 Infrastructure and Investment Drivers
- 7.1.4 Regulatory and Policy Drivers
- 7.2 Market Restraints
- 7.2.1 Cost and Affordability Constraints
- 7.2.2 Technology and Adoption Barriers
- 7.2.3 Supply Chain and Operational Constraints
- 7.3 Market Challenges
- 7.3.1 Competitive Pressure and Margin Erosion
- 7.3.2 Skills, Infrastructure and Implementation Gaps
- 7.4 Emerging Market Opportunities
- 7.5 Market Dynamics Impact and Time-Horizon Assessment
Chapter 8 Australia Digital Advertising and Influencer Economy Value Chain Analysis
- 8.1 Industry Value Chain Overview
- 8.2 Upstream Suppliers and Critical Inputs
- 8.3 Technology and Component Providers
- 8.4 Manufacturing or Service Delivery
- 8.5 Distribution, Channel Partners and Integrators
- 8.6 Downstream Applications and End Users
- 8.7 Value Addition and Profit Pools
- 8.8 Vertical Integration and Outsourcing
- 8.9 Supplier Concentration and Risk
- 8.10 Supply Chain Localization and Resilience
Chapter 9 Australia Digital Advertising and Influencer Economy Market Regulations and Policies
- 9.1 Relevant Laws, Standards and Compliance Frameworks
- 9.2 Product, Service, Safety and Quality Requirements
- 9.3 Government Policies, Incentives and Subsidies
- 9.4 Imports, Exports and Trade Barriers
- 9.5 Public Procurement and Local Content Requirements
- 9.6 Environmental and Sustainability Compliance
- 9.7 Data Protection, AI and Cybersecurity Compliance
- 9.8 Upcoming Policy Changes and Market Implications
Chapter 10 Australia Digital Advertising and Influencer Economy Market Hotspots and Opportunities
- 10.1 Market Opportunity Mapping and Growth Hotspots
- 10.2 High-Growth Applications and Customer Groups
- 10.3 Underserved Markets and White-Space Opportunities
- 10.4 Emerging Technology and Product Opportunities
- 10.5 New Capacity and Investment Hotspots
- 10.6 Market Entry and Expansion Opportunities
- 10.7 Distribution and Partnership Opportunities
- 10.8 Near-Term and Long-Term Commercial Potential
- 10.9 Opportunity Attractiveness and Execution Risks
Chapter 11 Australia Digital Advertising and Influencer Economy Market Outlook, 2025-2035
- 11.1 Market Size and Analysis
- 11.1.1 Revenue (Market Measurement: 2025: USD 12.22 billion → 2035: USD 29.81 billion)
- 11.1.2 Market Volume and Quantity Sold
- 11.1.3 Historical Market Size, 2018-2025
- 11.1.4 Base-Year Market Size, 2025
- 11.2 Market Forecast, 2025-2035
- 11.2.1 Revenue Forecast to 2035
- 11.2.2 Volume Forecast to 2035
- 11.2.3 CAGR and Year-on-Year Growth
- 11.2.4 Incremental Revenue Opportunity
- 11.3 Forecast Assumptions and Scenario Analysis
- 11.3.1 Base-Case Forecast
- 11.3.2 Optimistic and Conservative Scenarios
- 11.3.3 Technology, Pricing and Policy Sensitivities
- 11.4 Market Attractiveness and Growth Outlook
Chapter 12 Australia Digital Advertising and Influencer Economy Market Segmentation and Outlook
- 12.1 Segmentation Summary and Market Shares, 2025
- 12.2 Largest and Fastest-Growing Segments
- 12.3 By Service Type - Market Size and Forecast, 2025-2035
- 12.3.1 Segment Definition and Scope
- 12.3.2 Historical Market Size, 2018-2025
- 12.3.3 Revenue Forecast, 2025-2035
- 12.3.4 Volume Forecast, 2025-2035
- 12.3.5 Base-Year Market Share, 2025
- 12.3.6 Segment CAGR and Growth Drivers
- 12.3.7 Subsegment Market Size and Forecast
- 12.3.7.1 Performance Advertising
- 12.3.7.2 Audience Advertising
- 12.3.7.3 Creator Campaign Services
- 12.3.8 Subsegment Pricing and Adoption Trends
- 12.3.9 Leading Suppliers and Competition
- 12.3.10 Regional Demand and Opportunities
- 12.4 By Customer Type - Market Size and Forecast, 2025-2035
- 12.4.1 Segment Definition and Scope
- 12.4.2 Historical Market Size, 2018-2025
- 12.4.3 Revenue Forecast, 2025-2035
- 12.4.4 Volume Forecast, 2025-2035
- 12.4.5 Base-Year Market Share, 2025
- 12.4.6 Segment CAGR and Growth Drivers
- 12.4.7 Subsegment Market Size and Forecast
- 12.4.7.1 National Brand Advertisers
- 12.4.7.2 Independent Business Advertisers
- 12.4.7.3 Public Sector Advertisers
- 12.4.8 Subsegment Pricing and Adoption Trends
- 12.4.9 Leading Suppliers and Competition
- 12.4.10 Regional Demand and Opportunities
- 12.5 By End-Use Industry - Market Size and Forecast, 2025-2035
- 12.5.1 Segment Definition and Scope
- 12.5.2 Historical Market Size, 2018-2025
- 12.5.3 Revenue Forecast, 2025-2035
- 12.5.4 Volume Forecast, 2025-2035
- 12.5.5 Base-Year Market Share, 2025
- 12.5.6 Segment CAGR and Growth Drivers
- 12.5.7 Subsegment Market Size and Forecast
- 12.5.7.1 Retail and Consumer Goods
- 12.5.7.2 Property and Automotive
- 12.5.7.3 Financial and Business Services
- 12.5.7.4 Consumer Services and Public Sector
- 12.5.8 Subsegment Pricing and Adoption Trends
- 12.5.9 Leading Suppliers and Competition
- 12.5.10 Regional Demand and Opportunities
- 12.6 By Channel - Market Size and Forecast, 2025-2035
- 12.6.1 Segment Definition and Scope
- 12.6.2 Historical Market Size, 2018-2025
- 12.6.3 Revenue Forecast, 2025-2035
- 12.6.4 Volume Forecast, 2025-2035
- 12.6.5 Base-Year Market Share, 2025
- 12.6.6 Segment CAGR and Growth Drivers
- 12.6.7 Subsegment Market Size and Forecast
- 12.6.7.1 Open Web and Search
- 12.6.7.2 Social Platforms
- 12.6.7.3 Retail Media Networks
- 12.6.8 Subsegment Pricing and Adoption Trends
- 12.6.9 Leading Suppliers and Competition
- 12.6.10 Regional Demand and Opportunities
- 12.7 Segment Growth Comparison
- 12.8 Segment Attractiveness and Priority Matrix
Chapter 13 Australia Digital Advertising and Influencer Economy End-Use and Application Market Outlook
- 13.1 End-Use Industry and Customer Demand Structure
- 13.2 Leading Applications and Customer Groups
- 13.3 End-Use Market Size, Share and Forecast
- 13.4 Major End-Use Industry Deep Dives
- 13.4.1 Customer Requirements and Use Cases
- 13.4.2 Demand and Replacement Cycles
- 13.4.3 Technical and Regulatory Considerations
- 13.4.4 Purchasing and Procurement Models
- 13.4.5 Leading Vendors and Distribution Channels
- 13.4.6 Forecast and Commercial Opportunities
- 13.5 Emerging Applications and Cross-Segment Demand
- 13.6 End-Use Industry Investment Priorities
Chapter 14 Australia Digital Advertising and Influencer Economy Geographic Market Outlook, 2025-2035
- 14.1 Domestic Market Distribution and Demand Clusters
- 14.2 State- or Province-Wise Market Size and Forecast, 2025-2035
- 14.3 City and Metropolitan Market Outlook
- 14.4 Industrial, Manufacturing and Commercial Clusters
- 14.5 Geographic Concentration of Key End Users
- 14.6 Local Pricing and Purchasing Differences
- 14.7 Domestic Production Facilities and Capacity Map
- 14.8 Local Infrastructure and Project Pipeline
- 14.9 State-Level Policy and Incentive Differences
- 14.10 Subnational Investment Hotspots and Opportunities
- 14.11 Distribution and Logistics Networks
- 14.12 Domestic Competitive Footprint
Chapter 15 Australia Digital Advertising and Influencer Economy Technology, Innovation and Sustainability Outlook
- 15.1 Technology Landscape and Maturity
- 15.2 Product, Process and Service Innovation
- 15.3 AI, Automation and Digital Tools in the Industry
- 15.4 Technology Adoption and Performance Benchmarking
- 15.5 Innovation Pipeline and R&D Investment
- 15.6 Patent and Intellectual Property Trends
- 15.7 Energy Efficiency and Resource Management
- 15.8 Sustainability, Recycling and Circularity
- 15.9 Technology Roadmap, 2025-2035
- 15.10 Risks of Obsolescence and Technology Substitution
Chapter 16 Australia Digital Advertising and Influencer Economy Market Key Strategic Imperatives
- 16.1 Growth and Market Entry Priorities
- 16.2 High-Return Products and Segments
- 16.3 Pricing, Profitability and Cost Optimization
- 16.4 Technology Investment and Product Differentiation
- 16.5 Supply Chain Localization and Resilience
- 16.6 Distribution and Customer Acquisition
- 16.7 Partnership, Acquisition and Capacity Strategy
- 16.8 Regional Expansion Priorities
- 16.9 Short-, Medium- and Long-Term Actions
Chapter 17 Competition Outlook
- 17.1 Industry Competition Characteristics
- 17.2 Market Structure and Concentration
- 17.3 Market Share and Competitive Positioning, 2025
- 17.4 Company-Wise Revenue and Product Benchmarking
- 17.5 Production and Service Capacity Benchmarking
- 17.6 Technology, Pricing and Differentiation
- 17.7 Regional Footprint and Distribution Strength
- 17.8 Mergers, Acquisitions and Strategic Alliances
- 17.9 New Entrants and Competitive Threats
- 17.10 Porter's Five Forces and Industry Attractiveness
- 17.11 Competitive Outlook, 2025-2035
Chapter 18 Company Profiles
- 18.1 Company Coverage and Selection Criteria
- 18.2 Google
- 18.2.1 Business Description
- 18.2.2 Company Ownership and Geographic Presence
- 18.2.3 Product and Service Portfolio
- 18.2.4 Manufacturing and Operating Footprint
- 18.2.5 Production Capacity and Expansion Plans
- 18.2.6 Financial Performance and Investment
- 18.2.7 Market Share and Competitive Position
- 18.2.8 Technology and Innovation Capabilities
- 18.2.9 Strategic Alliances or Partnerships
- 18.2.10 Recent Developments
- 18.2.11 Growth Strategy and Outlook
- 18.3 Meta
- 18.4 TikTok
- 18.5 REA Group
- 18.6 Nine Entertainment
- 18.7 SEEK
- 18.8 CAR Group
- 18.9 Microsoft Advertising
- 18.10 Amazon Ads
- 18.11 Hoozu
- 18.12 Other Relevant Market Participants
Note: Every listed company is profiled on the structure shown under the first company. The company list is preliminary and may change based on research findings, market developments, data availability and client requirements.
Chapter 19 Disclaimer
- 19.1 Research and Forecast Disclaimer
- 19.2 Data Source and Estimation Limitations
Note: The depth of individual sections depends on data availability for this market. Volume, capacity, trade and other unit-based metrics are included where applicable.

