
Search, social, video and retail media win Indian budgets
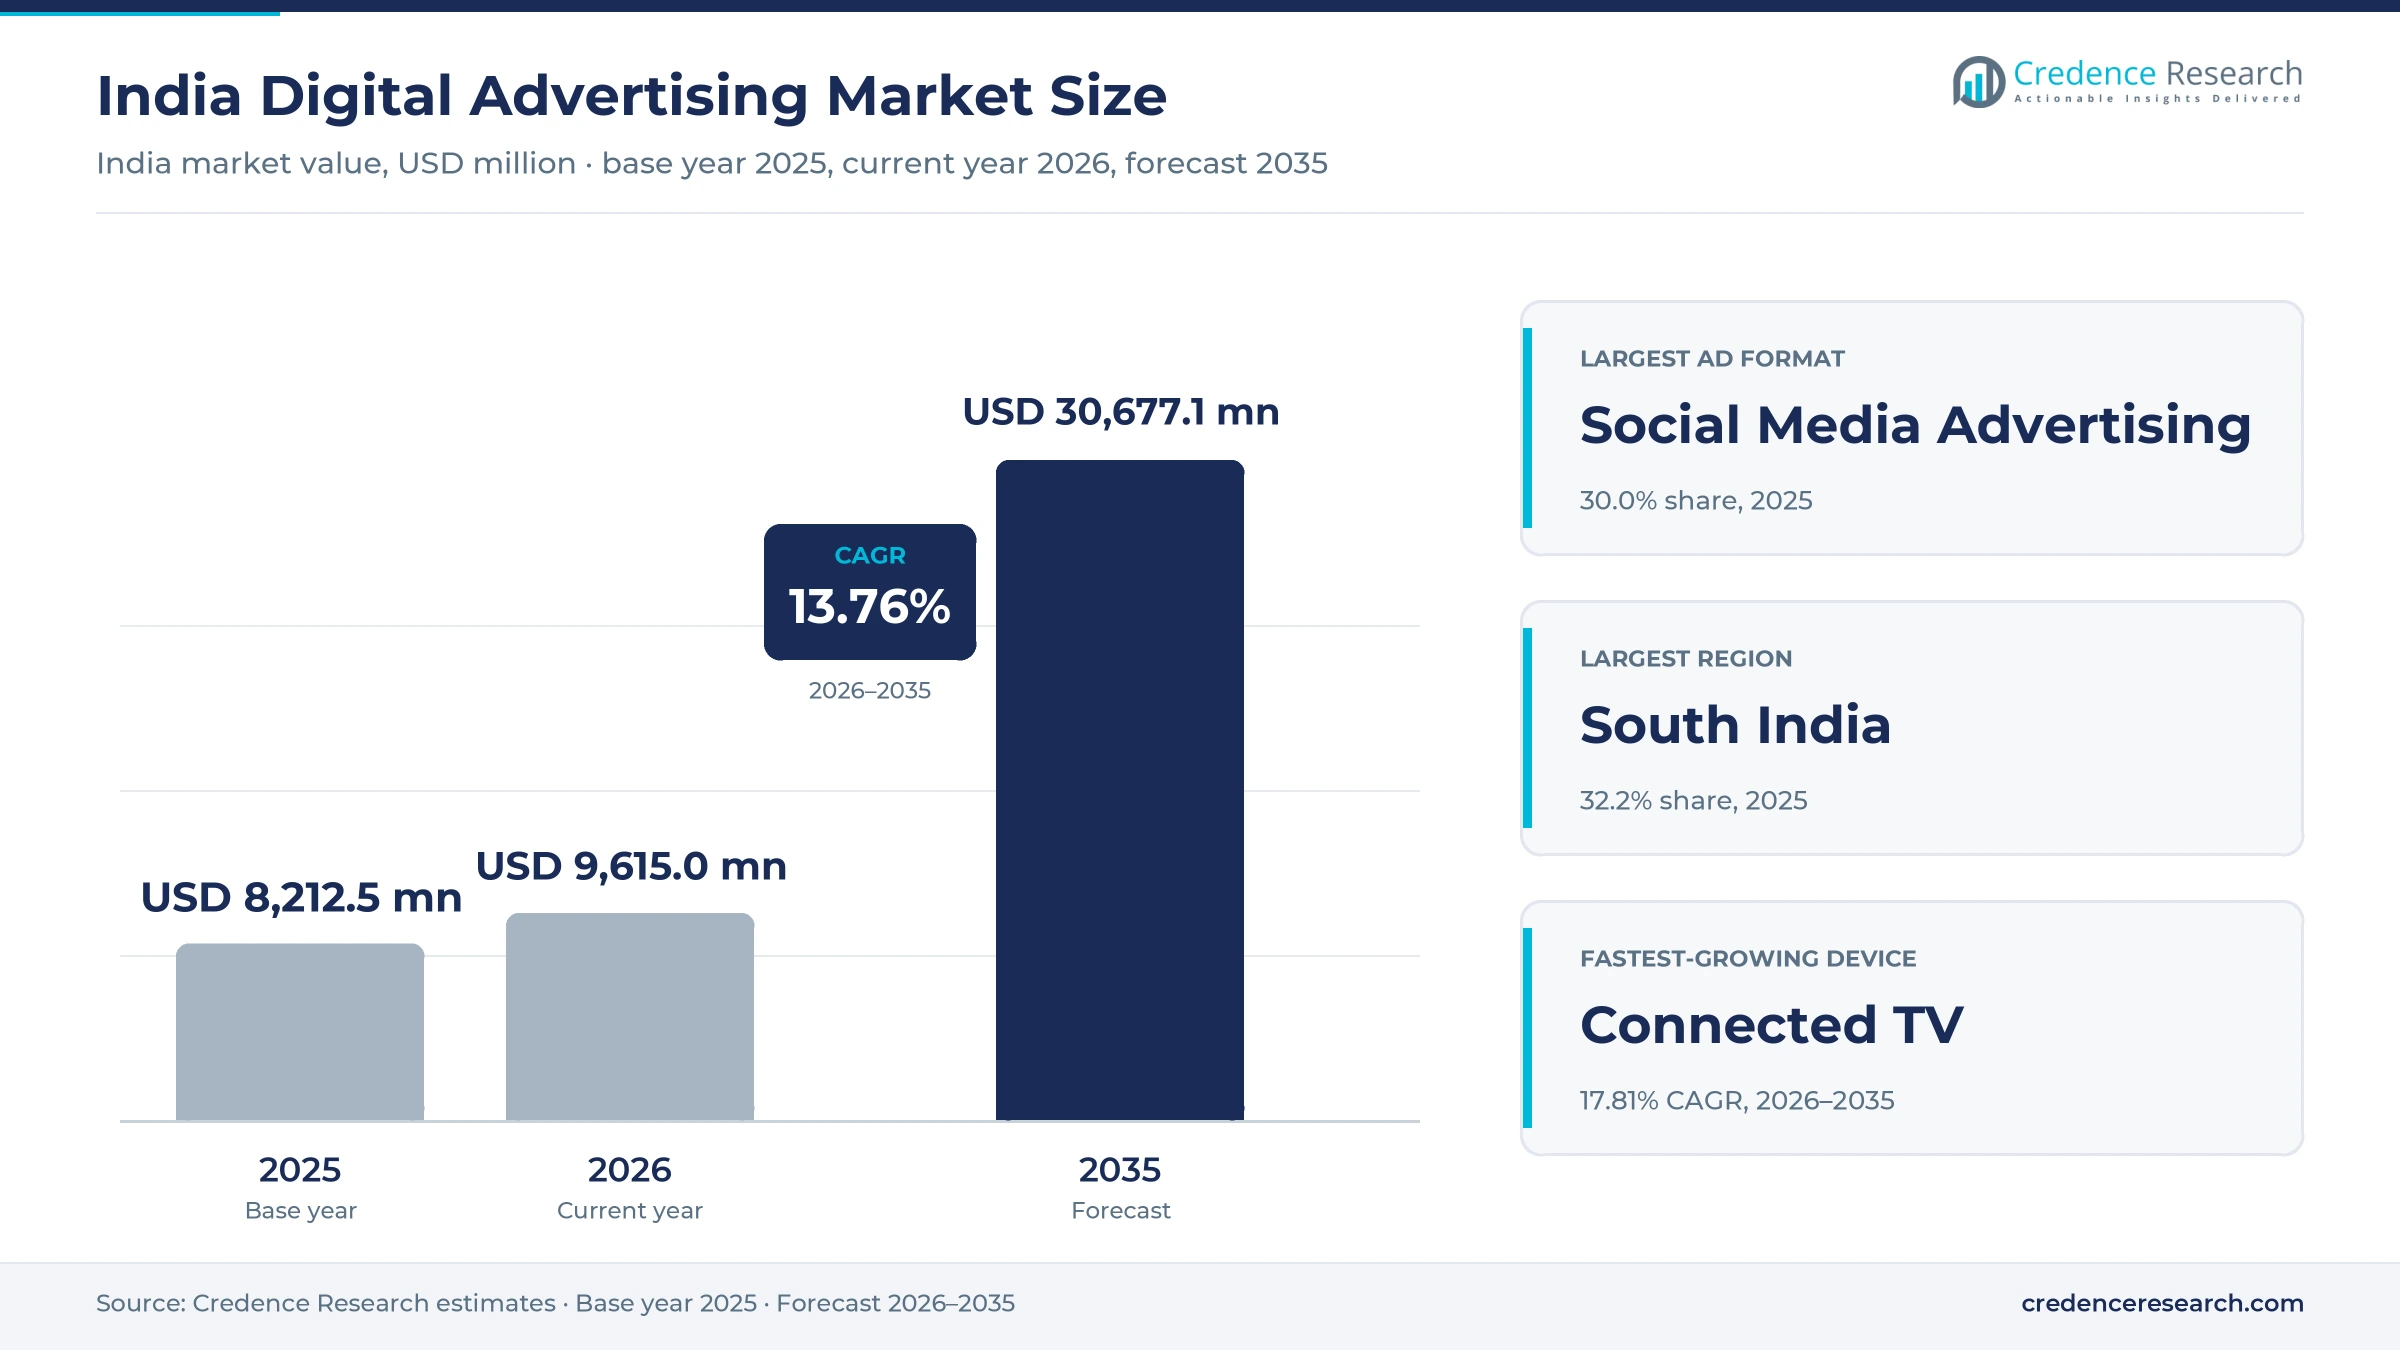
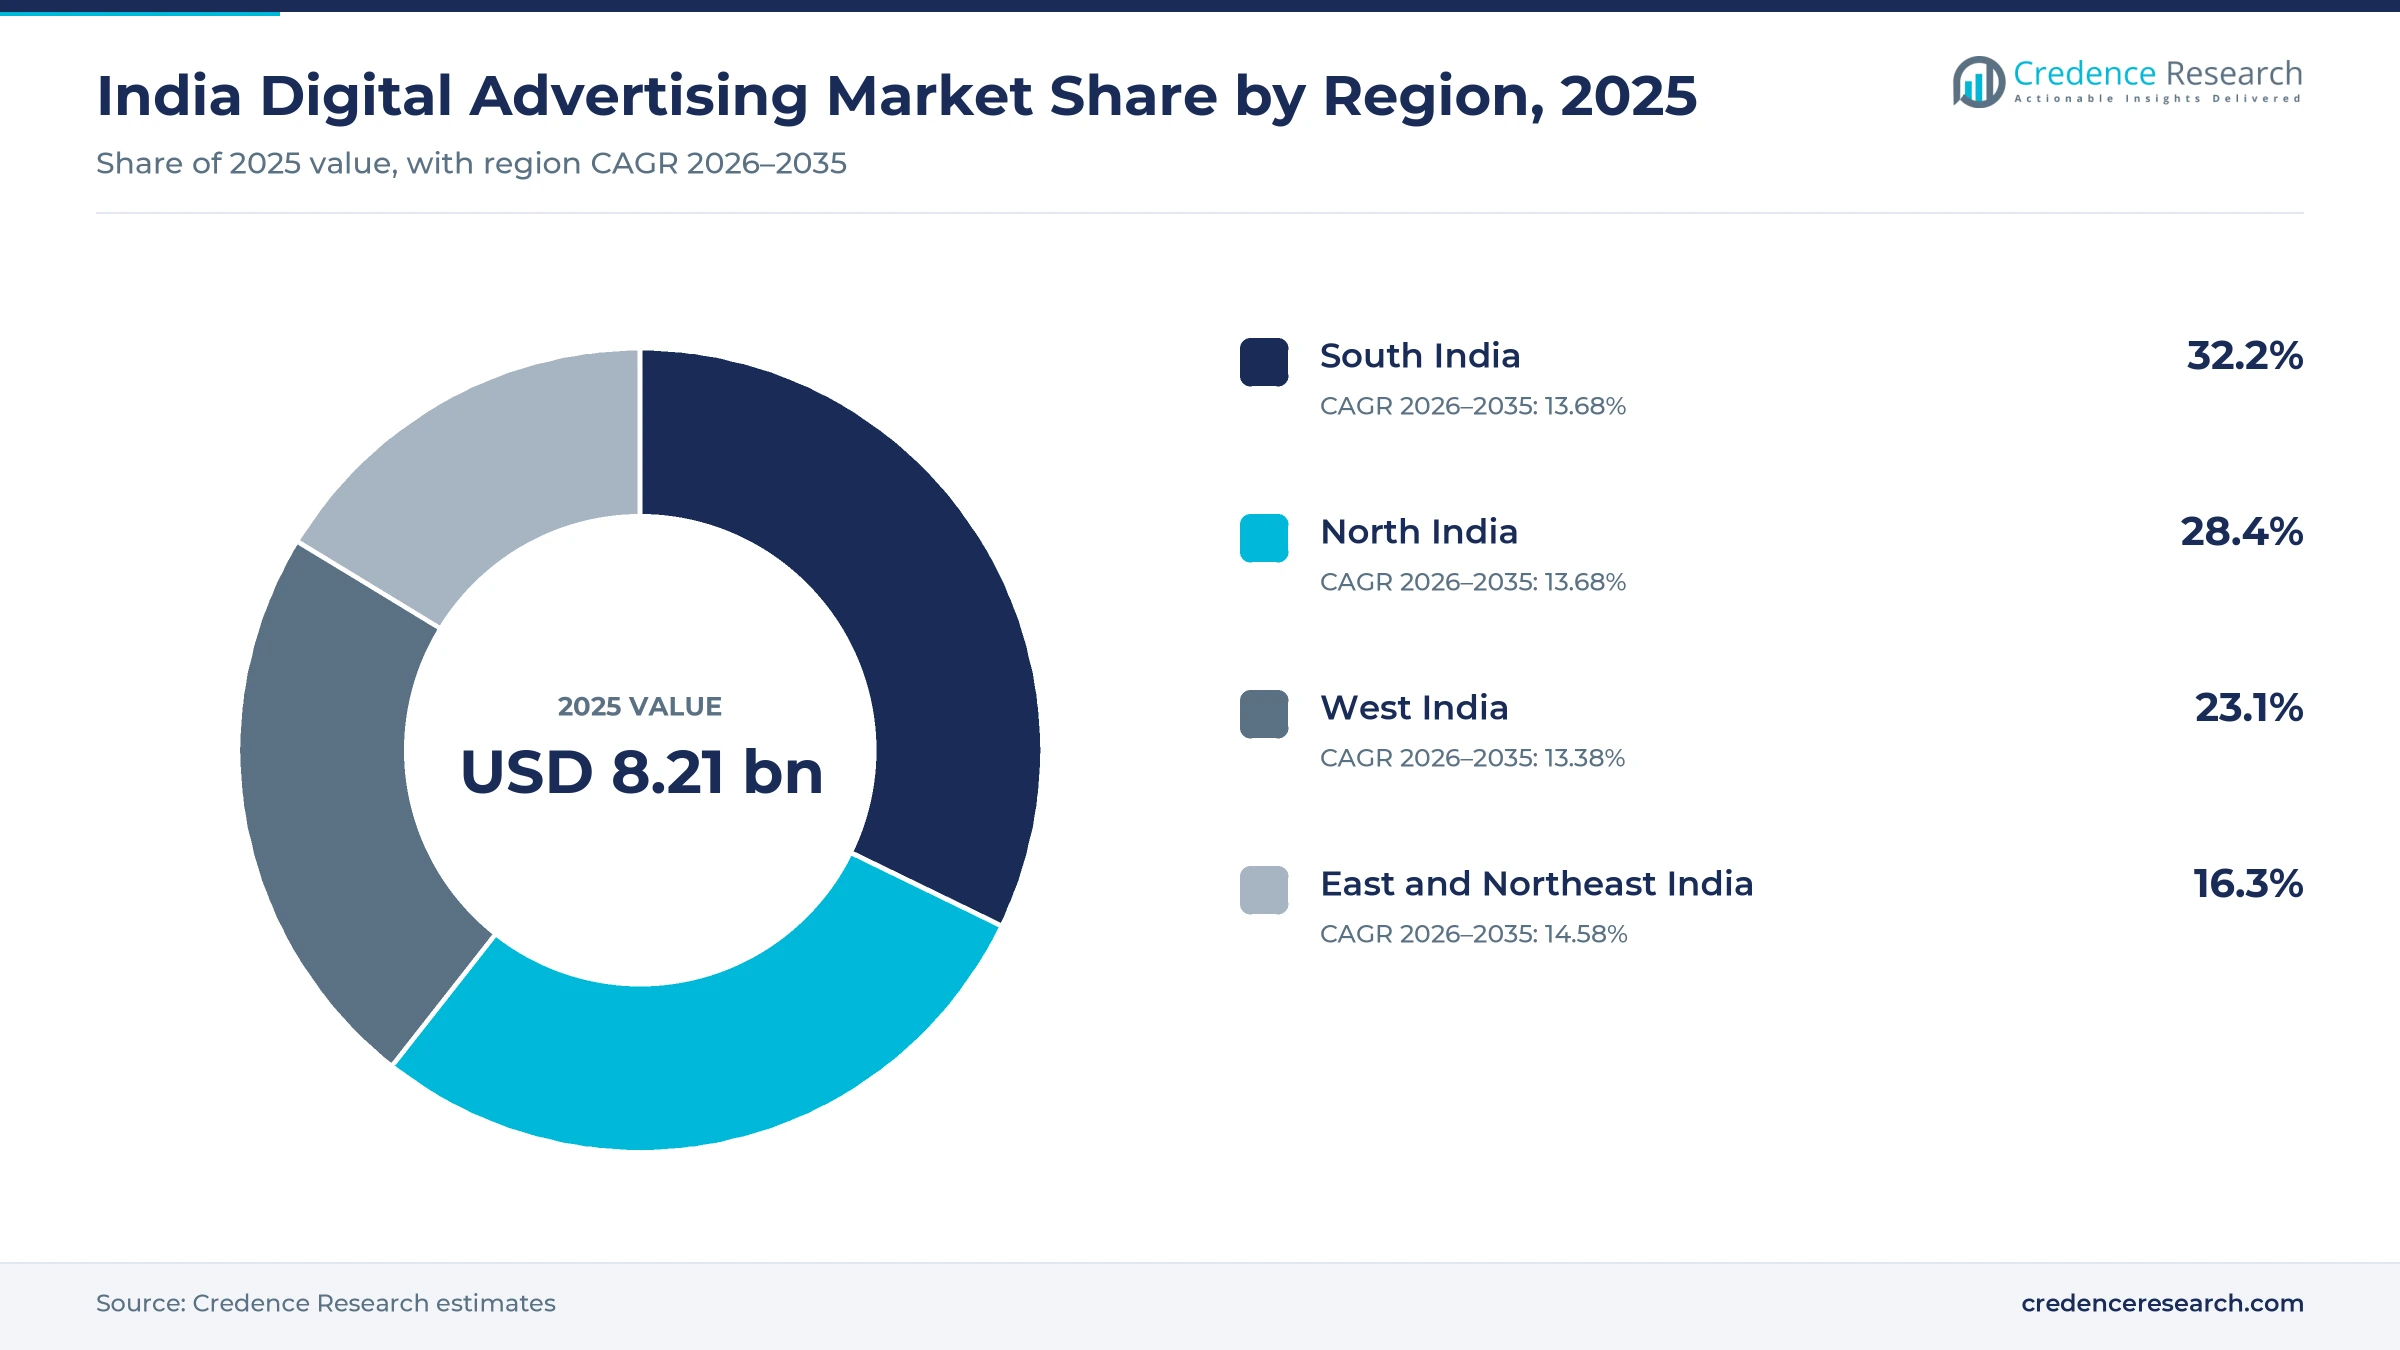
The India digital advertising market was valued at USD 8.21 billion in 2025 and is projected to increase from USD 9.62 billion in 2026 to USD 30.68 billion by 2035, registering a CAGR of 13.76% during 2026–2035. Demand comes from brands, online sellers and app developers that move budgets from print and linear TV toward search, social feeds, streaming video and marketplace listings. South India held the largest regional share, 32.2% in 2025, because its technology hubs and dense smartphone base support heavy performance spending. East and Northeast India is the fastest-growing region at 14.58% a year, as broadband and 5G reach more homes in Bihar, West Bengal, Odisha and Assam. The commercial setting has also changed, because India abolished the 6% equalization levy on online ads from April 1, 2025, and banned the advertising of online money games in August 2025.
Which paid online formats and devices does the estimate count?
The estimate measures the value of paid advertising bought to reach audiences in India through search engines, social platforms, online video and streaming services, display and programmatic networks, and retail marketplaces. It covers campaigns served on smartphones, connected TVs, desktops, laptops, tablets and other connected devices, priced per click, per thousand impressions, per action or per view.
The estimate excludes linear TV, print, radio and outdoor media, agency fees, unpaid organic social posts and payments made directly to creators outside platform ad systems. The value chain runs from advertisers and their agencies through ad platforms, marketplaces and publishers to the people who see and respond to each ad.
India Digital Advertising Market Insights
- The India digital advertising market was valued at USD 8.21 billion in 2025 and is projected to reach USD 30.68 billion by 2035, registering a CAGR of 13.76% during 2026–2035.
- South India held a 32.2% share of 2025 value, because its technology hubs and large smartphone base support heavy performance spending.
- Social media advertising led with a 30.0% share of 2025 value, while retail media grows fastest at 16.20% a year.
- JioHotstar reported 652 million digital viewers for IPL 2025, and 235 million of them watched on connected TV screens.
- India had 1,094.48 million broadband subscribers at the end of July 2026, which widens the audience that advertisers can reach.
Social formats lead as retail media grows fastest
Why do social media formats hold the largest share?
Based on ad format, the market is categorized into paid search, social media advertising, online video advertising, display and programmatic, and retail media. Social Media Advertising led with a 30.0% share of 2025 value, because feeds, reels and stories reach most smartphone users every day. Retail Media grows fastest at 16.20% a year, as marketplaces sell sponsored listings that link spending directly to orders.
How do smartphones and connected TVs split ad budgets?
Based on device, the market is categorized into smartphone, connected TV, desktop and laptop, and tablet and other connected devices. Smartphone led with a 72.0% share of 2025 value, because most Indian users go online only through mobile phones. Connected TV grows fastest at 17.81% a year, as streaming apps move live cricket and shows onto large home screens.
Which industries spend the most on paid online media?
Based on end-use industry, the market is categorized into e-commerce and retail, FMCG and consumer durables, BFSI and fintech, automotive and mobility, media, entertainment and gaming, and others. E-Commerce and Retail led with a 26.0% share of 2025 value, because marketplaces and brands buy ads around every sale. BFSI and Fintech grows fastest at 14.97% a year, as lenders and payment apps target new users.
How do large firms and small sellers compare in spending?
Based on enterprise size, the market is categorized into large enterprises, mid-market enterprises and small businesses and MSMEs. Large Enterprises led with a 52.0% share of 2025 value, because national brands run large search, video and streaming budgets. Small Businesses and MSMEs grow fastest at 15.09% a year, as self-serve tools let shops and regional brands advertise with small budgets.
| Segment Group | Leading Sub-segment | Share, 2025 | Fastest-growing Sub-segment | CAGR, 2026–2035 |
|---|---|---|---|---|
| By Ad Format | Social Media Advertising | 30.0% | Retail Media | 16.20% |
| By Device | Smartphone | 72.0% | Connected TV | 17.81% |
| By End-Use Industry | E-Commerce and Retail | 26.0% | BFSI and Fintech | 14.97% |
| By Enterprise Size | Large Enterprises | 52.0% | Small Businesses and MSMEs | 15.09% |
Request a Free Sample
Fill in your details and we'll send you a free sample report.
- Sample data tables & charts
- Research methodology
Mass reach, payments and streaming lift Indian ad spend
Why does a vast mobile audience widen campaign scope?
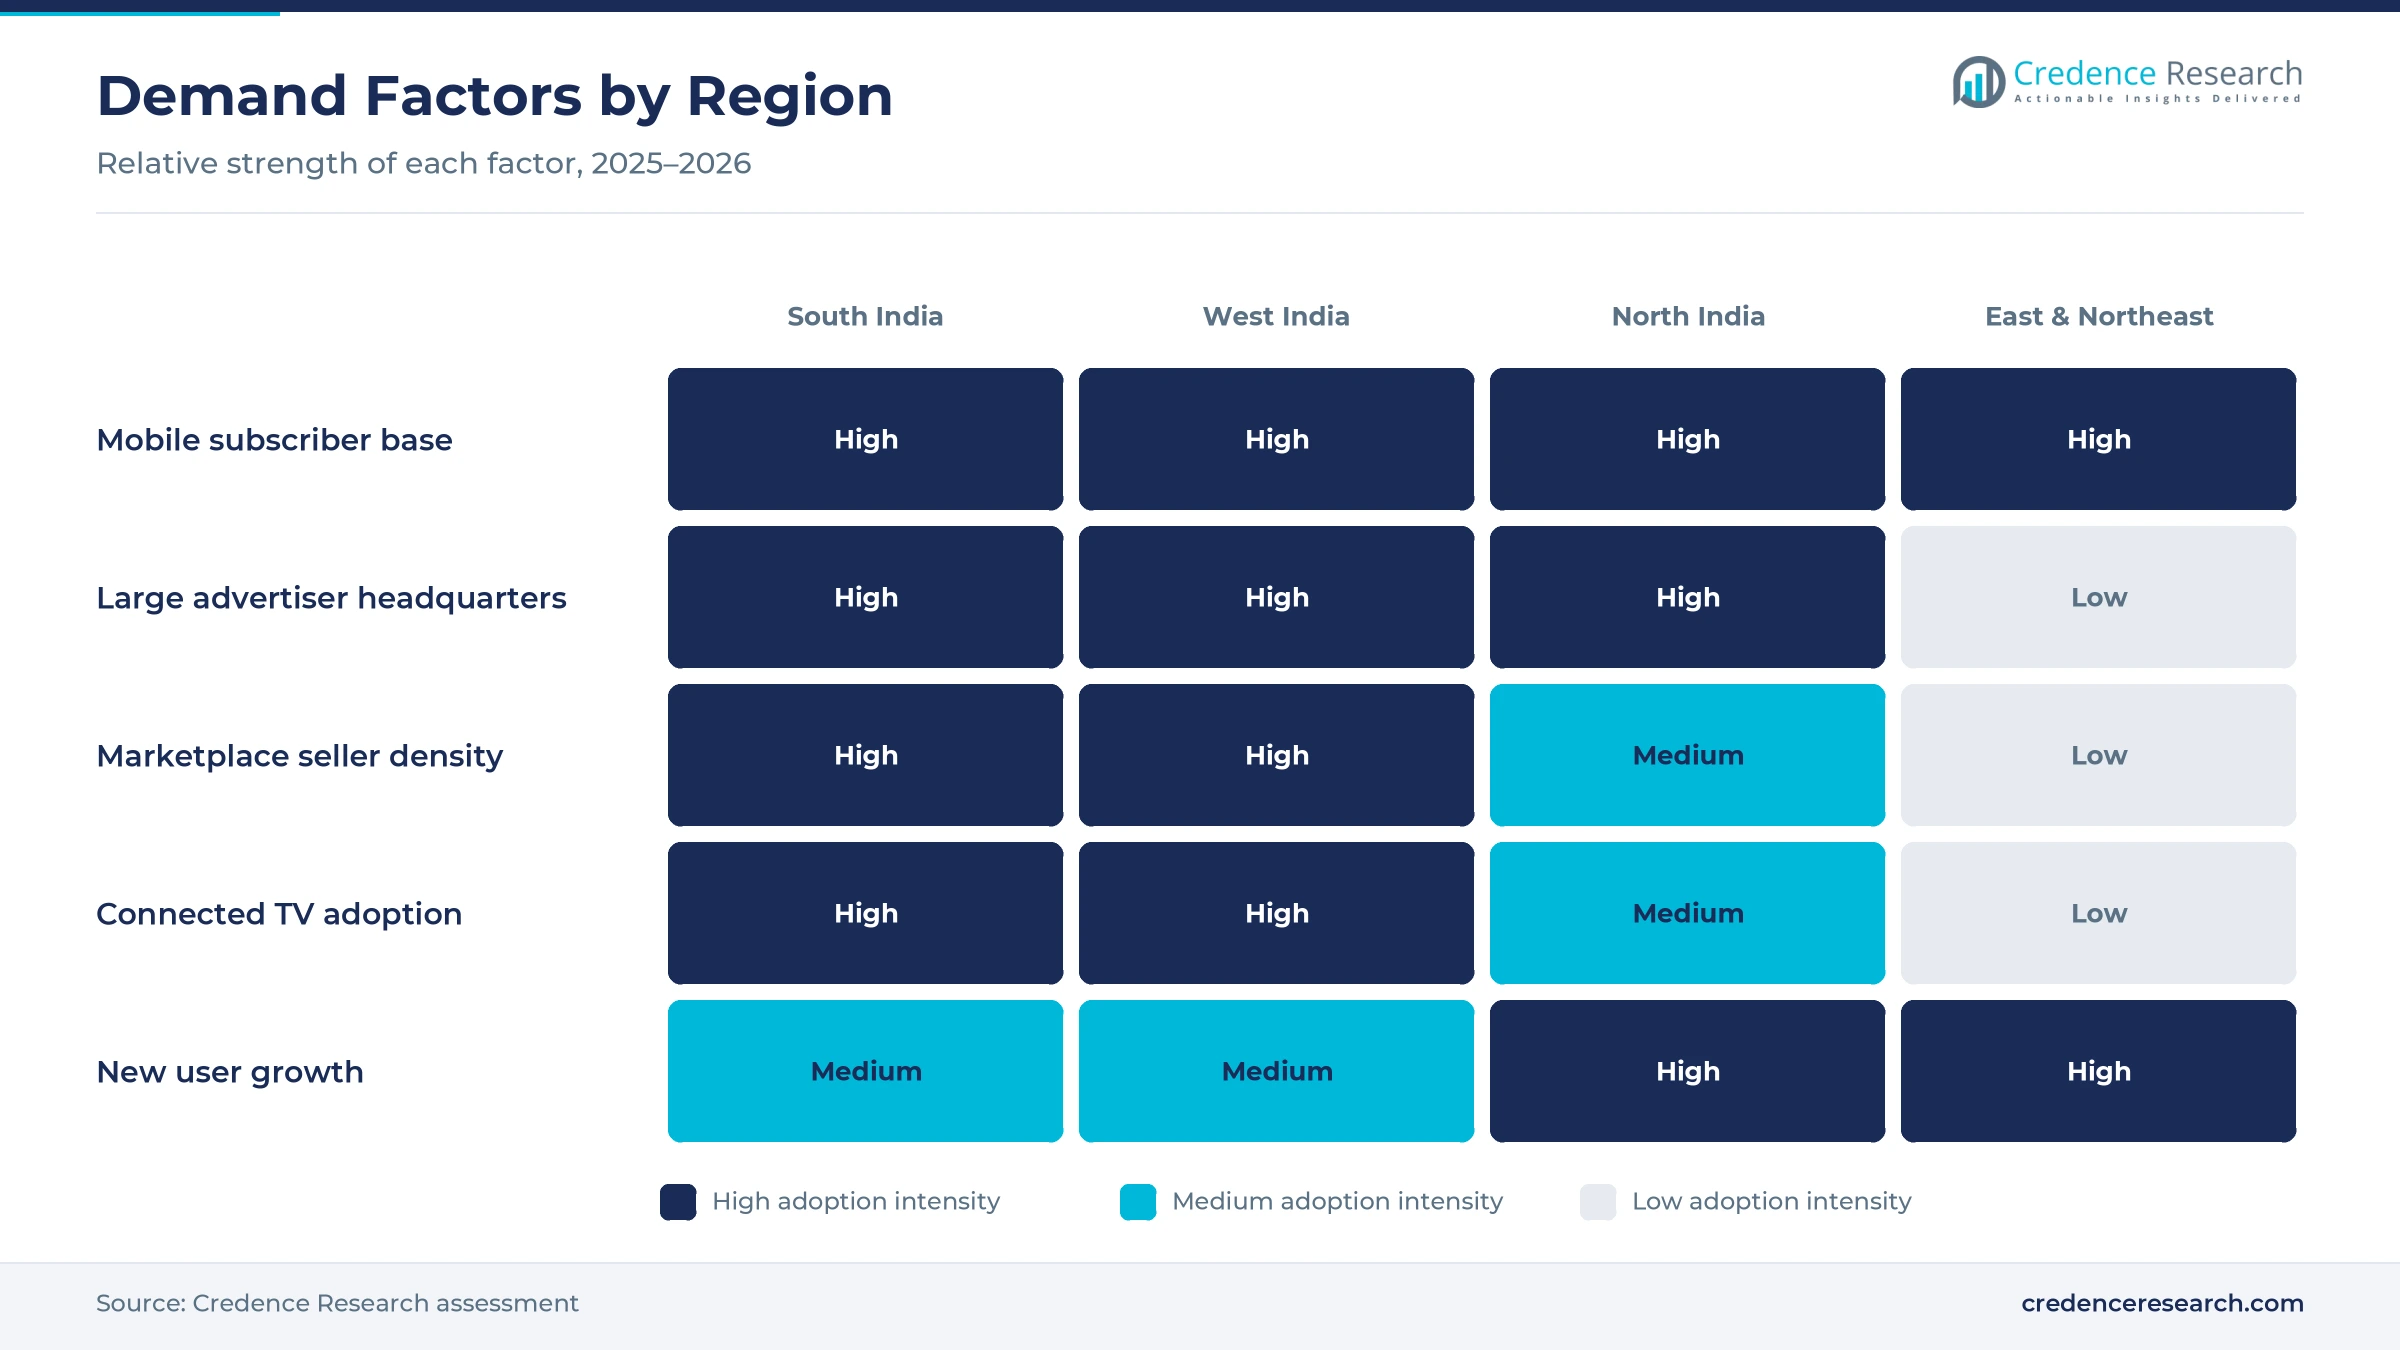
Near-billion user reach and rural expansion lift demand, because advertisers can now find buyers in villages and small towns through the same phone screens they use in metros. India had 1,094.48 million broadband subscribers at the end of July 2026, according to TRAI subscription data, up 0.64% from June. Rural wireless teledensity stood at 59.59% at the end of July 2026, against 143.86% in urban areas, which leaves wide room for rural growth. Rural users also held 6.64 million of the 13.21 million 5G fixed wireless connections in July 2026. As a result, smartphones carried 72.0% of 2025 value, the largest share of any device, because most new users come online through a phone.
How do UPI and marketplaces make ads measurable?
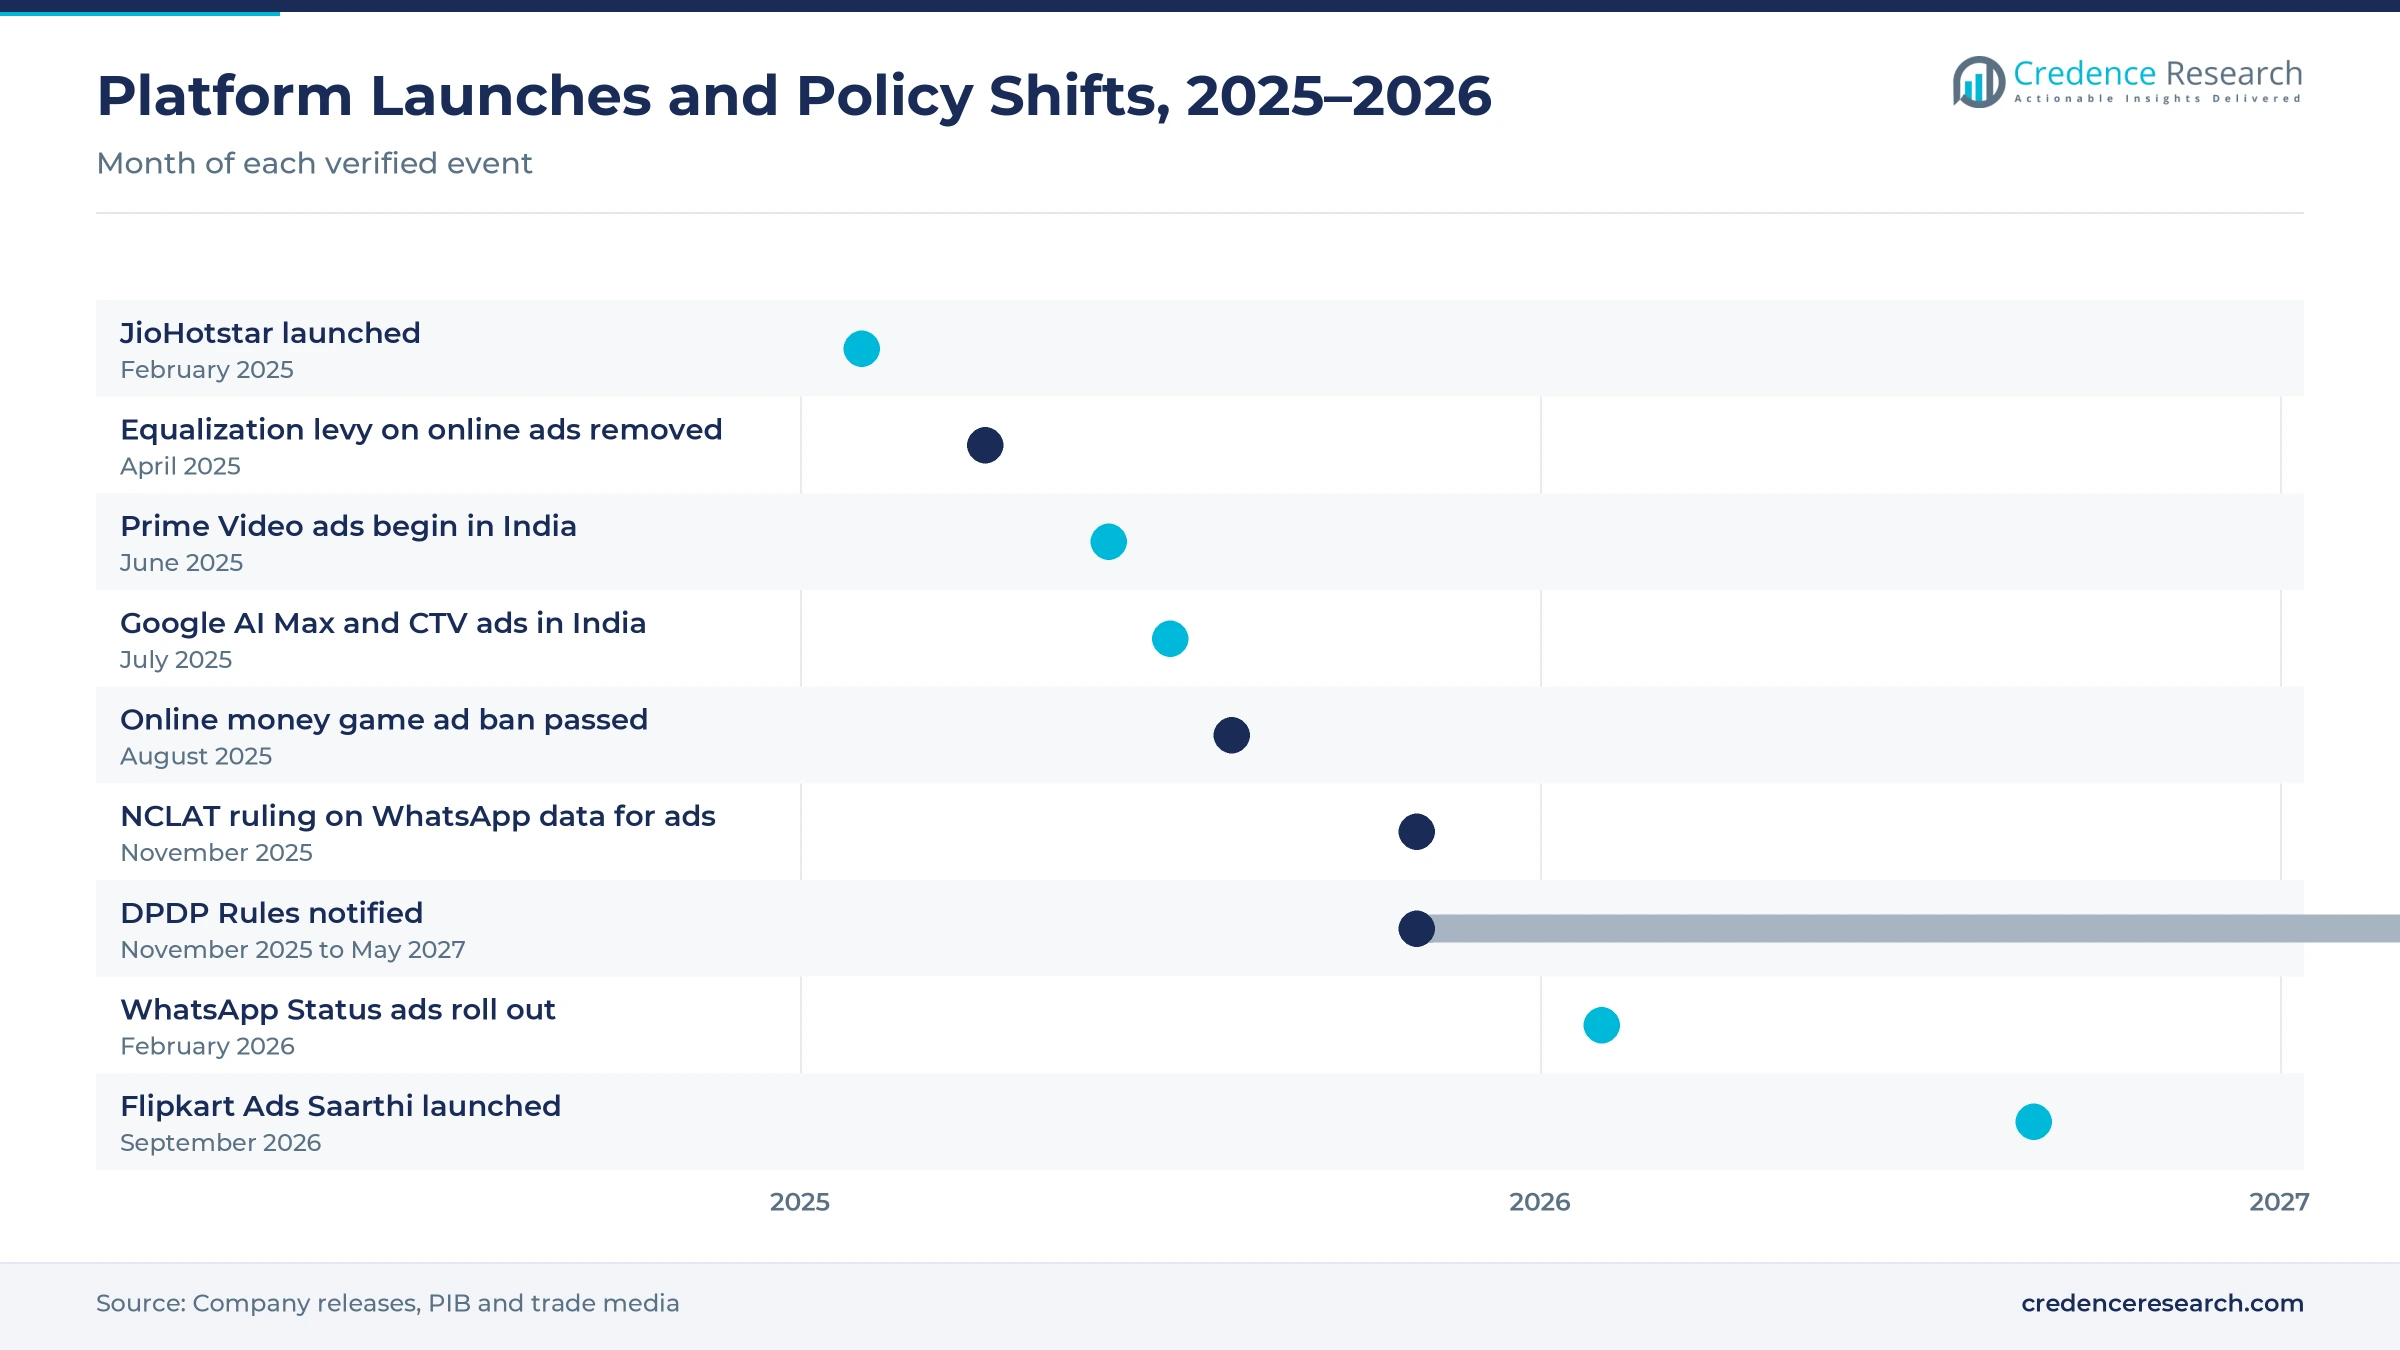
Commerce and digital payment integration converts ad spend into measurable sales, because shoppers can click, pay and receive goods inside one app journey. UPI processed 24.07 billion transactions worth Rs 29.37 lakh crore in September 2026, according to Outlook Money, up 23% in volume from a year earlier. Flipkart Ads launched its Saarthi program in September 2026 with a free AI campaign tool for more than 1.4 million sellers, including Shopsy sellers. Amazon also began showing ads on Prime Video in India on June 17, 2025, which links streaming audiences to its shopping data. In turn, retail media grows at 16.20% a year, the fastest ad format, as the e-commerce sector adds sponsored listings.
Why are streaming screens drawing brand budgets?
Video, CTV and creator-led consumption reshape audience reach, because viewers now spend prime time on streaming apps and short clips rather than linear channels. JioHotstar, launched on Feb. 14, 2025, reported 652 million digital viewers for IPL 2025, and 235 million of them watched on connected TV screens. The same season drew more than 425 brands, including 270 first-time advertisers from 40 sectors. Google also brought shoppable connected TV ads and the YouTube mobile masthead to Indian advertisers in July 2025, and it said 87% of Indian consumers watch YouTube or Shorts while shopping. As a result, connected TV grows at 17.81% a year, while online video formats keep drawing brand budgets.
How did levy removal and automation cut buying costs?
Tax relief and AI tools lower the cost of buying media, because advertisers pay less on cross-border platform invoices and spend less time managing campaigns. India abolished the 6% equalization levy on online advertisements from April 1, 2025, after collecting it since June 1, 2016. Google launched AI Max for paid search campaigns and Smart Bidding Exploration in India in July 2025. Early AI Max testing by Cashify raised conversions by 15% and cut customer acquisition costs by 12%, according to Google. In turn, large enterprises held 52.0% of 2025 value, because they run the biggest automated search and video budgets and gain most from lower buying costs.
AI buying, messaging ads and small sellers gain ground
Why is the shift toward automated planning gaining pace?
The shift to AI-run campaigns is changing media buying, because platforms now pick audiences, bids and creative with less manual work from brand teams. Flipkart's Saarthi dashboard, built with AtTheRate.ai, flags weak campaigns, applies day-parting rules and suggests fixes through conversational AI. InMobi launched Glance AI on May 22, 2025, as a shopping platform built with Google's Gemini and Imagen models in 140 countries. Affle told the National Stock Exchange of India on June 13, 2026, that a subsidiary would buy the AdColony SDK and platform assets for USD 4.70 million. As a result, programmatic buying gains depth, because more inventory is priced and placed by software.
How is the rise of chat app formats changing reach?
The rise of messaging-led ads is significant, because chat apps hold daily attention that brands have long reached only through search and social feeds. WhatsApp began rolling out labeled Status ads and promoted channels in its Updates tab worldwide in February 2026. On Nov. 4, 2025, the National Company Law Appellate Tribunal set aside a Competition Commission of India direction that barred WhatsApp from sharing user data with Meta for advertising. The tribunal still upheld the Rs 213.14 crore penalty from the November 2024 order. In turn, social media advertising led with 30.0% of 2025 value, because Meta can plan campaigns across feeds, reels and messaging surfaces.
Is self-serve buying an opening for long-tail merchants?
Small sellers and MSMEs can become the next growth pool, because self-serve tools now let a shop or a regional brand launch campaigns with a small daily budget. Flipkart Ads matches sellers with certified agency partners at zero cost through Saarthi, based on business stage, growth goals and advertising readiness. Flipkart Group lists more than 500 million registered users and over 150 million products, which gives sellers a large audience. UPI averaged about 802 million transactions a day in September 2026, which gives small merchants a payment trail that ads can be measured against. Google also added state-level urban and rural audience filters for Indian media planning in July 2025. As a result, small businesses and MSMEs grow at 15.09% a year, the fastest of all enterprise sizes.
Can first-time users in large states open new demand?
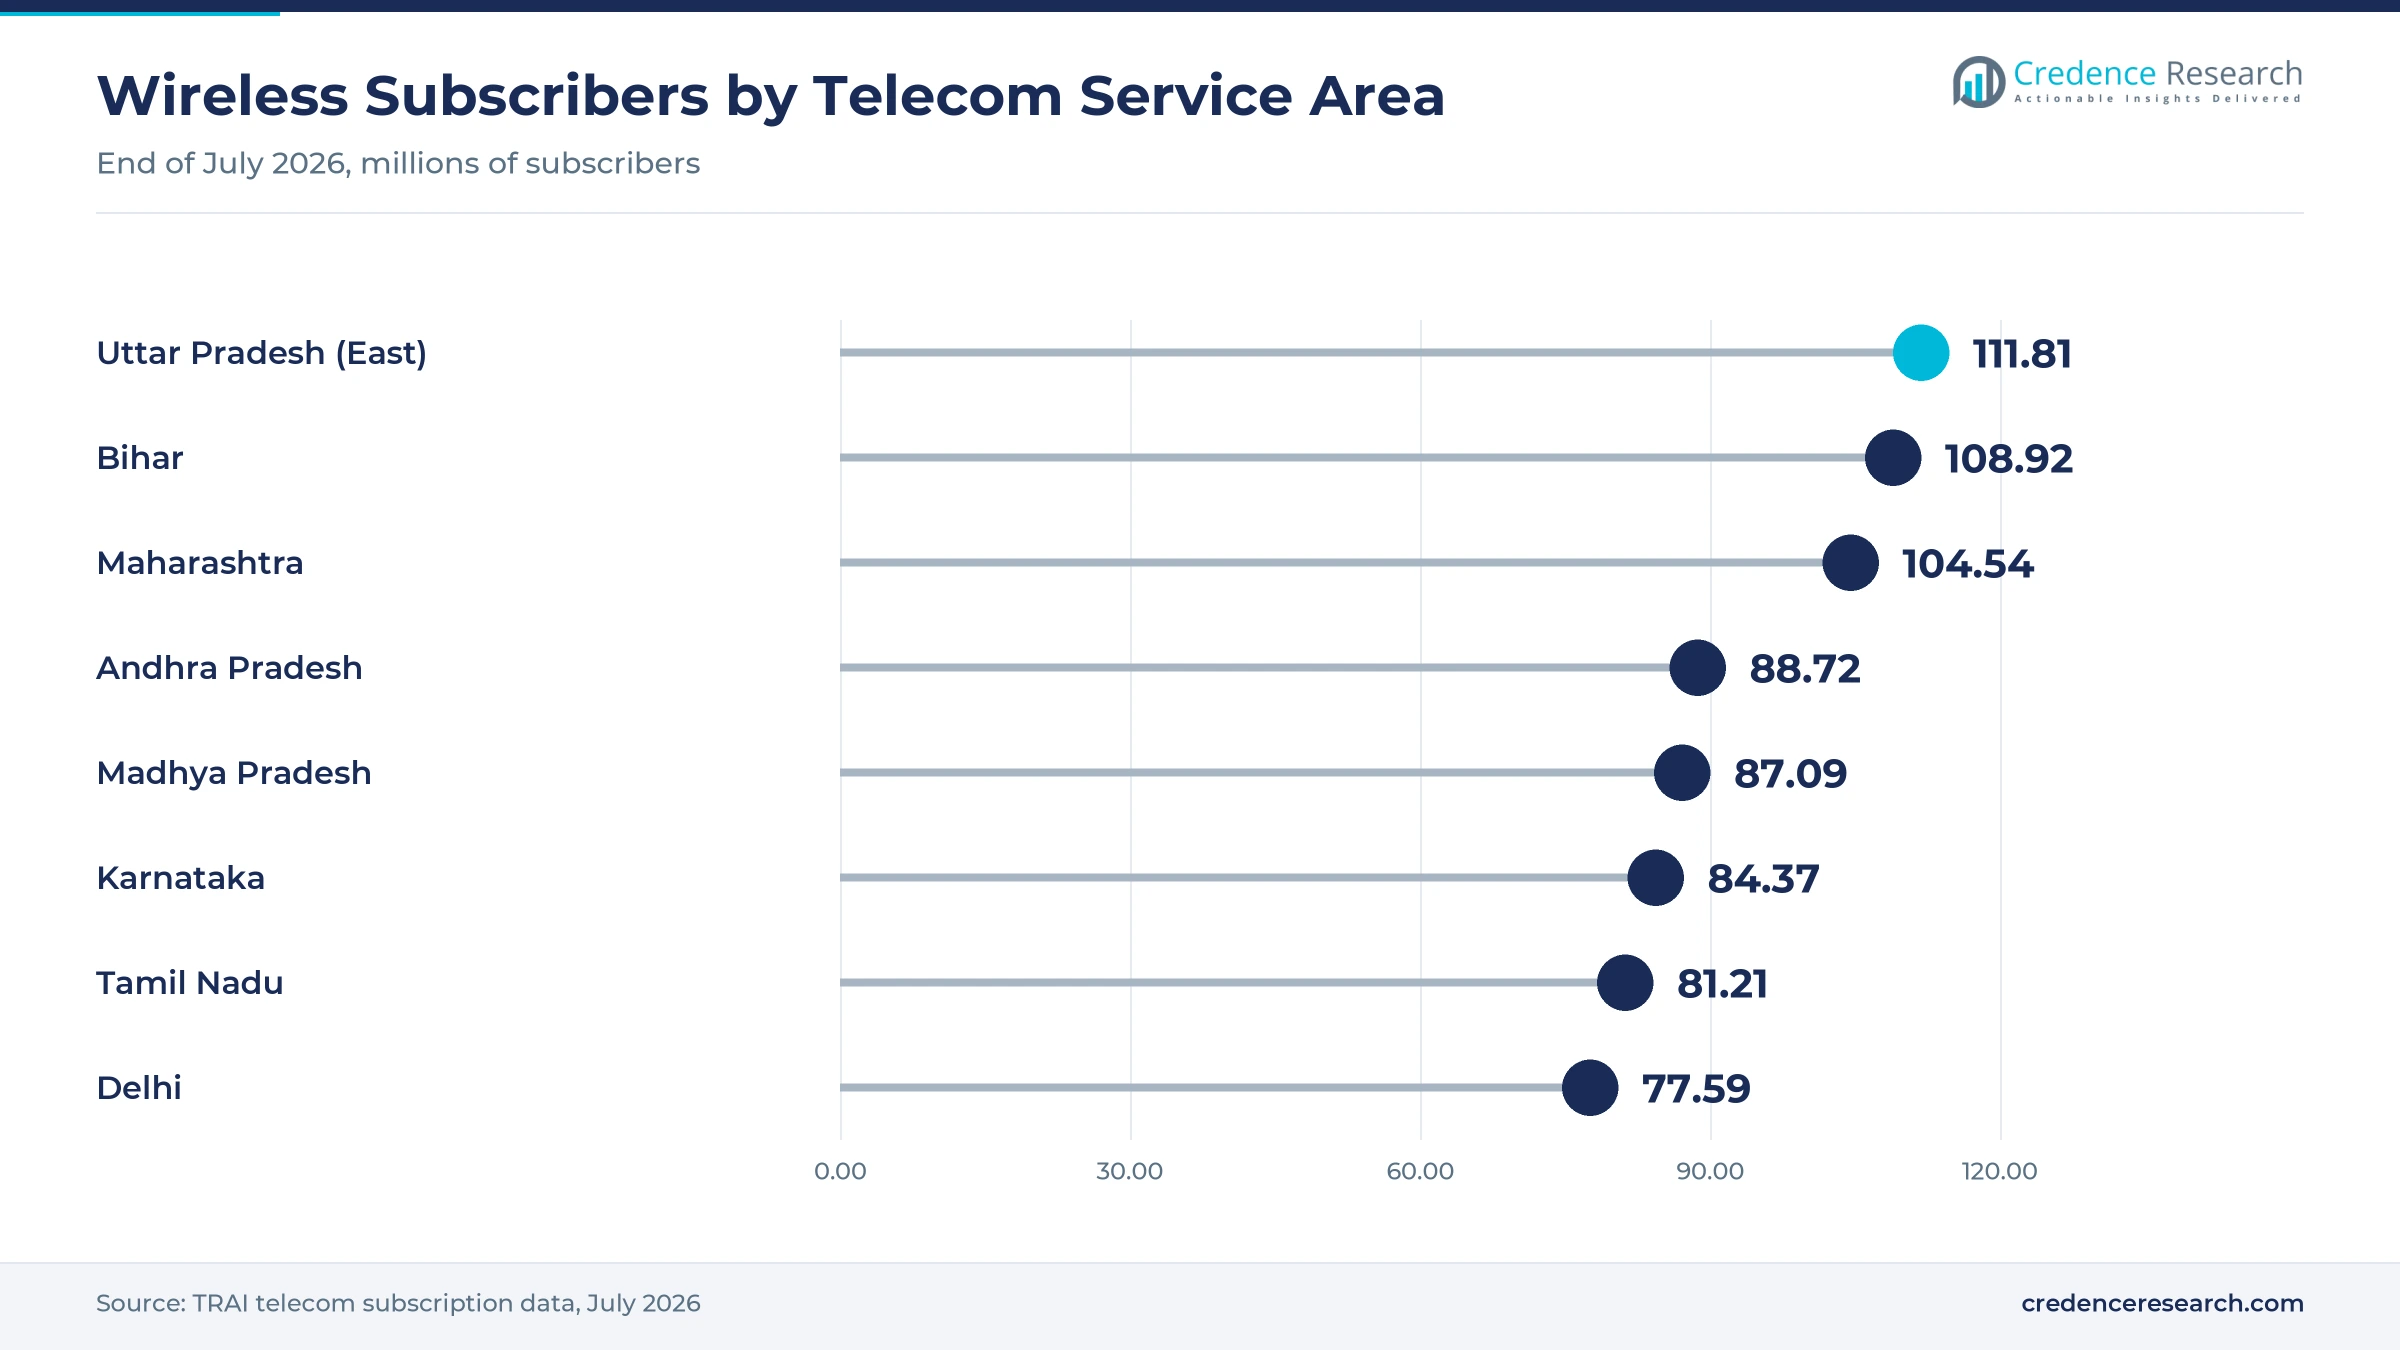
Regional and rural audience growth is an opening, because many new internet users come from states where national brands still advertise lightly. Uttar Pradesh East had 111.81 million wireless subscribers and Bihar had 108.92 million at the end of July 2026, more than Maharashtra at 104.54 million. India had almost 450 million 5G connections and about 1.2 billion active mobile connections in October 2026, according to GSMA. Regional creators and influencer marketing campaigns help brands speak to these users in their own languages. As a result, East and Northeast India becomes the fastest-growing region over the forecast period.
Gaming ad ban, consent rules and fraud test advertisers
Why did the money gaming law cut a key ad category?
The real-money gaming ad ban removes a large spender, because online money games had bought heavy volumes of sports, video and creator inventory. Parliament passed the Promotion and Regulation of Online Gaming Bill on Aug. 21, 2025, and the government's explainer says advertising and promotion of such games is strictly prohibited. Advertising them can bring up to two years in jail and a fine of up to Rs 50 lakh. As a result, publishers must refill that demand with e-sports, social games and other categories.
How do data protection duties change audience targeting?
New consent rules raise the cost of targeting, because advertisers and publishers must show clear consent before using personal data. The government notified the Digital Personal Data Protection Rules on Nov. 14, 2025, with an 18-month window for phased compliance. Processing a child's data needs verifiable parental consent, and the Act bars targeted advertising directed at children under 18. In turn, platforms invest in consent managers and first-party data, which favors large platforms over smaller ad networks.
Why do fake offers make users wary of ads?
Scams and ad fraud weaken user trust, because users who meet fake offers become wary of clicking on genuine ads. In a GSMA consumer survey released in October 2026, 12% of Indian respondents said they had been scammed in the previous year, and 72% said scam risk changed their behavior. As a result, brands demand verified inventory and fraud checks, which adds cost to each campaign. Platforms respond with advertiser verification, seller checks and stricter review of financial ads.
How do creator disclosure lapses slow campaigns?
Influencer compliance remains a weak spot, because creator content often blurs the line between opinion and paid promotion. The Advertising Standards Council of India scrutinized 9,841 ads in FY2025-26, and 97.3% of them appeared on digital media, according to Manifest. Of the 1,609 influencer ads it processed, 97.3% required modification, while offshore betting was the most violative sector with 6,933 cases. In turn, brands add disclosure checks and creator contracts that slow campaign launches.
Southern tech hubs lead while Bihar and Bengal add users
| Region | Value, 2025 (USD billion) | Share, 2025 | CAGR, 2026–2035 |
|---|---|---|---|
| South India | 2.64 | 32.2% | 13.68% |
| North India | 2.33 | 28.4% | 13.68% |
| West India | 1.90 | 23.1% | 13.38% |
| East and Northeast India | 1.34 | 16.3% | 14.58% |
Why do southern technology hubs lead online ad budgets?
South India held a 32.2% share of 2025 value and grows at 13.68% a year, because its technology hubs, startups and online sellers buy large volumes of search, app and marketplace media. The Andhra Pradesh telecom circle, which includes Telangana, had 88.72 million wireless subscribers at the end of July 2026, while Karnataka had 84.37 million and Tamil Nadu had 81.21 million. Flipkart announced its Saarthi seller program from Bengaluru in September 2026. As a result, the region keeps the largest share of performance and retail media spending.
How does the northern belt add mass-market reach?
North India held a 28.4% share of 2025 value and grows at 13.68% a year, because it combines the Delhi capital region with the most populous telecom circles. Uttar Pradesh East had 111.81 million wireless subscribers at the end of July 2026, while Delhi had 77.59 million, Rajasthan 68.98 million and Uttar Pradesh West 67.19 million. In turn, FMCG, auto and fintech brands use Hindi-language video and social campaigns to reach this large audience.
Why do western commercial centers favor video and commerce ads?
West India held a 23.1% share of 2025 value and grows at 13.38% a year, because Mumbai, Pune and Gujarat combine dense urban audiences with large consumer, financial and media advertisers. Maharashtra had 104.54 million wireless subscribers at the end of July 2026, Gujarat had 73.22 million and the Mumbai circle had 40.65 million. As a result, the region supports high spending on streaming video, connected TV and marketplace campaigns.
How are eastern and northeastern states adding new audiences?
East and Northeast India held a 16.3% share of 2025 value and grows fastest at 14.58% a year, because mobile broadband is reaching many first-time users. Bihar had 108.92 million wireless subscribers at the end of July 2026, West Bengal had 58.75 million, Odisha 39.01 million and Assam 29.78 million. In turn, regional-language video, social and creator campaigns gain share from a smaller base.
Platform launches and policy shifts in 2025–2026
| Development | Status and market relevance |
|---|---|
| In February 2025, JioStar launched JioHotstar, combining JioCinema and Disney+ Hotstar into one streaming platform. | Created a large ad-supported streaming audience |
| In June 2025, Amazon began showing ads on Prime Video in India, with an ad-free add-on at Rs 129 a month. | Added a new streaming ad channel tied to retail data |
| In July 2025, Google launched AI Max for Search, Smart Bidding Exploration and shoppable connected TV ads in India. | Expanded AI buying and CTV formats for advertisers |
| In June 2026, Affle disclosed that a subsidiary would buy the AdColony SDK and platform assets from Digital Turbine. | Adds mobile app inventory to an Indian adtech firm |
| In September 2026, Flipkart Ads launched Saarthi, an AI campaign tool and agency program for more than 1.4 million sellers. | Opens retail media to more small sellers |
AI bidding, shoppable CTV and consent tools
- AI bidding tools set bids, find new search queries and generate creative, which cuts manual work for brand and agency teams.
- Retail media platforms place sponsored listings next to products and tie each campaign to orders, which gives sellers closed-loop measurement.
- Shoppable CTV formats let viewers act on ads shown on home screens, which links streaming reach with product discovery.
- Consent management systems record and update user consent under the new data rules, which keeps targeting lawful as the 18-month window closes.
Need a Custom Version of This Report?
Tailor the scope, geography, or segments to your exact requirements.
- Custom geography or segment scope
- Direct access to our analyst team
Global platforms, marketplaces and streamers compete
Competition is shaped by global platforms, Indian marketplaces, streamers and adtech firms. Google sells search, YouTube and connected TV inventory and brought AI Max and shoppable CTV ads to India in July 2025. Meta competes across Facebook, Instagram and WhatsApp, where Status ads and promoted channels began rolling out in February 2026. Amazon and Flipkart sell retail media tied to purchase data, with Amazon adding Prime Video ads in June 2025 and Flipkart launching Saarthi for sellers in September 2026. JioStar sells IPL cricket and entertainment inventory on its JioHotstar streaming platform. InMobi and Affle compete in mobile and programmatic media, while Times Internet, VerSe Innovation and ShareChat are also tracked in news, short video and regional-language feeds. Rivals compete on reach, first-party data, measurement, AI tools and price, and platforms that link ads with purchases usually win the largest budgets.
Which companies sell online ad inventory and tools in India?
| Company | Type | Role in the market |
|---|---|---|
| Google India | Search and video platform | Launched AI Max and shoppable CTV ads in India in July 2025 |
| Meta Platforms India | Social and messaging platform | Rolling out WhatsApp Status ads and promoted channels since February 2026 |
| Amazon Ads India | Retail media and streaming | Began Prime Video ads in India on June 17, 2025 |
| Flipkart Ads | Retail media platform | Launched the Saarthi seller program in September 2026 |
| JioStar | Streaming and broadcast | Launched JioHotstar in February 2025 and drew 425-plus IPL 2025 brands |
| InMobi | Mobile adtech and commerce | Launched Glance AI shopping platform in May 2025 |
| Affle | Mobile adtech | Agreed in June 2026 to buy AdColony SDK and platform assets |
Credence Research view on Indian online ad spending
Credence Research's view is that Indian online ad spending will keep growing far faster than traditional media, because reach, payments and streaming now meet on the same phone and TV screens. Social media remains the largest format, while retail media, connected TV and small sellers add the fastest growth. The removal of the equalization levy lowered buying costs, but the gaming ad ban and the new consent rules force advertisers to rebuild some demand and targeting. Platforms that join first-party data, AI buying and commerce should gain the most.
How the Indian online ad spending estimate was built
The report uses 2025 as the base year on a calendar basis, and market values come from the Credence Research model. That model combines TRAI subscriber data, GSMA connection data, UPI payment statistics, government notices on gaming and data protection, and company releases on launches and acquisitions. Regional shares, segment splits and growth rates are Credence Research estimates built from TRAI subscriber data by telecom circle, broadband reach and the location of large advertisers. Sources used are official statistics, government documents, industry association data and company releases reported in trade media, and no interviews or surveys were used.
Commerce-linked and CTV formats carry growth to 2035
The India digital advertising market is expected to reach USD 30.68 billion by 2035, a 13.76% CAGR during 2026–2035, as brands move more budget to commerce-linked, video and messaging formats. Growth should be strongest in retail media, connected TV, small businesses and East and Northeast India, because these areas gain most from wider broadband, UPI payments and self-serve tools. AI buying will raise efficiency for large and small advertisers, while the gaming ad ban, consent rules, scams and influencer compliance could slow some publishers.
Frequently Asked Questions
How big is the India digital advertising market?
Which ad format leads Indian online ad spending?
Which region spends the most on online ads in India?
Why is connected TV growing so quickly?
How did the online gaming law affect advertising?
How do the new data protection rules affect targeting?
Which companies sell the most online ad inventory in India?
Which enterprise size is growing fastest?
Table of Content
Chapter 1 Market Segmentation
- 1.1 Segmentation Framework
- 1.1.1 Product and Service Classification
- 1.1.2 Application and End-Use Classification
- 1.1.3 Technology and Solution Classification
- 1.1.4 Customer and Distribution Channel Classification
- 1.1.5 Geographic Segmentation
- 1.1.6 Market Segment Definitions and Boundaries
- 1.2 By Ad Format
- 1.2.1 Paid Search
- 1.2.2 Social Media Advertising
- 1.2.3 Online Video Advertising
- 1.2.4 Display and Programmatic
- 1.2.5 Retail Media
- 1.3 By Device
- 1.3.1 Smartphone
- 1.3.2 Connected TV
- 1.3.3 Desktop and Laptop
- 1.3.4 Tablet and Other Connected Devices
- 1.4 By End-Use Industry
- 1.4.1 E-Commerce and Retail
- 1.4.2 FMCG and Consumer Durables
- 1.4.3 BFSI and Fintech
- 1.4.4 Automotive and Mobility
- 1.4.5 Media, Entertainment and Gaming
- 1.4.6 Others
- 1.5 By Enterprise Size
- 1.5.1 Large Enterprises
- 1.5.2 Mid-Market Enterprises
- 1.5.3 Small Businesses and MSMEs
Chapter 2 Introduction
- 2.1 Report Objectives and Scope
- 2.2 Product Definition and Industry Terminology
- 2.3 Market Inclusions and Exclusions
- 2.4 Research Process
- 2.4.1 Primary Research and Expert Interviews
- 2.4.2 Secondary Research and Source Review
- 2.4.3 Top-Down and Bottom-Up Estimation
- 2.4.4 Data Triangulation and Verification
- 2.5 Market Size Measurement Basis
- 2.5.1 2025: USD 8.21 billion → 2035: USD 30.68 billion
- 2.6 Historical and Forecast Reference Periods
- 2.6.1 Historical Period: 2018-2025
- 2.6.2 Base Year: 2025
- 2.6.3 Forecast Period: 2025-2035
- 2.7 Research Assumptions and Limitations
Chapter 3 Executive Summary
- 3.1 Market Snapshot and Key Findings
- 3.2 Base-Year Market Size, 2025
- 3.3 Forecast Market Size, 2035
- 3.4 Revenue and Volume Growth Outlook
- 3.5 Key Demand and Supply Indicators
- 3.6 Leading Market Segments
- 3.7 Fastest-Growing Market Opportunities
- 3.8 Regional Performance Highlights
- 3.9 Technology and Industry Transformation
- 3.10 Competitive Landscape Summary
- 3.11 Analyst View and Strategic Implications
Chapter 4 India Digital Advertising Market Trends and Developments
- 4.1 Historical Industry Development, 2018-2025
- 4.2 Recent Market Trends and Developments
- 4.3 Demand and Customer Behavior Trends
- 4.4 Technology and Product Innovation
- 4.5 Artificial Intelligence, Automation and Digitalization
- 4.6 Local Manufacturing and Supply Chain Realignment
- 4.7 Industry Partnerships, Mergers and Acquisitions
- 4.8 Sustainability and Circular Economy Developments
- 4.9 Government and Private Sector Investment Trends
- 4.10 Emerging Business Models and Commercialization
- 4.11 Industry Developments and Announcements
Chapter 5 India Digital Advertising Market Production, Supply and Demand Analysis
- 5.1 Demand Trend and Consumption Analysis, 2018-2025
- 5.2 Demand Forecast, 2025-2035
- 5.3 Production and Output Trend, 2018-2025
- 5.4 Production and Output Forecast, 2025-2035
- 5.5 Installed Capacity and Capacity Utilization
- 5.6 Company-Wise Production Plants and Statistics
- 5.6.1 Installed Production Capacity
- 5.6.2 Actual Production
- 5.6.3 Planned Capacity and Expansion Targets
- 5.7 Supply Chain Structure and Procurement Trends
- 5.8 Supply-Demand Gap and Bottlenecks
- 5.9 Import Dependence and Sourcing Structure
- 5.10 Contract Manufacturing and Outsourcing
- 5.11 Regional Supply and Demand Concentration
Chapter 6 India Digital Advertising Market Pricing Analysis
- 6.1 Pricing Structure and Measurement
- 6.2 Historical Pricing Trends, 2018-2025
- 6.3 Pricing Outlook, 2025-2035
- 6.4 Average Selling Price and Unit Economics
- 6.5 Pricing by Product and Market Segment
- 6.6 Geographic Pricing Differences
- 6.7 Key Input, Energy, Labor and Logistics Costs
- 6.8 Contract Pricing and Purchasing Models
- 6.9 Pricing Sensitivity and Competitive Positioning
- 6.10 Price, Margin and Profitability Implications
Chapter 7 India Digital Advertising Market Dynamics
- 7.1 Market Growth Drivers
- 7.1.1 Demand-Side Drivers
- 7.1.2 Technology and Innovation Drivers
- 7.1.3 Infrastructure and Investment Drivers
- 7.1.4 Regulatory and Policy Drivers
- 7.2 Market Restraints
- 7.2.1 Cost and Affordability Constraints
- 7.2.2 Technology and Adoption Barriers
- 7.2.3 Supply Chain and Operational Constraints
- 7.3 Market Challenges
- 7.3.1 Competitive Pressure and Margin Erosion
- 7.3.2 Skills, Infrastructure and Implementation Gaps
- 7.4 Emerging Market Opportunities
- 7.5 Market Dynamics Impact and Time-Horizon Assessment
Chapter 8 India Digital Advertising Value Chain Analysis
- 8.1 Industry Value Chain Overview
- 8.2 Upstream Suppliers and Critical Inputs
- 8.3 Technology and Component Providers
- 8.4 Manufacturing or Service Delivery
- 8.5 Distribution, Channel Partners and Integrators
- 8.6 Downstream Applications and End Users
- 8.7 Value Addition and Profit Pools
- 8.8 Vertical Integration and Outsourcing
- 8.9 Supplier Concentration and Risk
- 8.10 Supply Chain Localization and Resilience
Chapter 9 India Digital Advertising Market Regulations and Policies
- 9.1 Relevant Laws, Standards and Compliance Frameworks
- 9.2 Product, Service, Safety and Quality Requirements
- 9.3 Government Policies, Incentives and Subsidies
- 9.4 Imports, Exports and Trade Barriers
- 9.5 Public Procurement and Local Content Requirements
- 9.6 Environmental and Sustainability Compliance
- 9.7 Data Protection, AI and Cybersecurity Compliance
- 9.8 Upcoming Policy Changes and Market Implications
Chapter 10 India Digital Advertising Market Hotspots and Opportunities
- 10.1 Market Opportunity Mapping and Growth Hotspots
- 10.2 High-Growth Applications and Customer Groups
- 10.3 Underserved Markets and White-Space Opportunities
- 10.4 Emerging Technology and Product Opportunities
- 10.5 New Capacity and Investment Hotspots
- 10.6 Market Entry and Expansion Opportunities
- 10.7 Distribution and Partnership Opportunities
- 10.8 Near-Term and Long-Term Commercial Potential
- 10.9 Opportunity Attractiveness and Execution Risks
Chapter 11 India Digital Advertising Market Outlook, 2025-2035
- 11.1 Market Size and Analysis
- 11.1.1 Revenue (Market Measurement: 2025: USD 8.21 billion → 2035: USD 30.68 billion)
- 11.1.2 Market Volume and Quantity Sold
- 11.1.3 Historical Market Size, 2018-2025
- 11.1.4 Base-Year Market Size, 2025
- 11.2 Market Forecast, 2025-2035
- 11.2.1 Revenue Forecast to 2035
- 11.2.2 Volume Forecast to 2035
- 11.2.3 CAGR and Year-on-Year Growth
- 11.2.4 Incremental Revenue Opportunity
- 11.3 Forecast Assumptions and Scenario Analysis
- 11.3.1 Base-Case Forecast
- 11.3.2 Optimistic and Conservative Scenarios
- 11.3.3 Technology, Pricing and Policy Sensitivities
- 11.4 Market Attractiveness and Growth Outlook
Chapter 12 India Digital Advertising Market Segmentation and Outlook
- 12.1 Segmentation Summary and Market Shares, 2025
- 12.2 Largest and Fastest-Growing Segments
- 12.3 By Ad Format - Market Size and Forecast, 2025-2035
- 12.3.1 Segment Definition and Scope
- 12.3.2 Historical Market Size, 2018-2025
- 12.3.3 Revenue Forecast, 2025-2035
- 12.3.4 Volume Forecast, 2025-2035
- 12.3.5 Base-Year Market Share, 2025
- 12.3.6 Segment CAGR and Growth Drivers
- 12.3.7 Subsegment Market Size and Forecast
- 12.3.7.1 Paid Search
- 12.3.7.2 Social Media Advertising
- 12.3.7.3 Online Video Advertising
- 12.3.7.4 Display and Programmatic
- 12.3.7.5 Retail Media
- 12.3.8 Subsegment Pricing and Adoption Trends
- 12.3.9 Leading Suppliers and Competition
- 12.3.10 Regional Demand and Opportunities
- 12.4 By Device - Market Size and Forecast, 2025-2035
- 12.4.1 Segment Definition and Scope
- 12.4.2 Historical Market Size, 2018-2025
- 12.4.3 Revenue Forecast, 2025-2035
- 12.4.4 Volume Forecast, 2025-2035
- 12.4.5 Base-Year Market Share, 2025
- 12.4.6 Segment CAGR and Growth Drivers
- 12.4.7 Subsegment Market Size and Forecast
- 12.4.7.1 Smartphone
- 12.4.7.2 Connected TV
- 12.4.7.3 Desktop and Laptop
- 12.4.7.4 Tablet and Other Connected Devices
- 12.4.8 Subsegment Pricing and Adoption Trends
- 12.4.9 Leading Suppliers and Competition
- 12.4.10 Regional Demand and Opportunities
- 12.5 By End-Use Industry - Market Size and Forecast, 2025-2035
- 12.5.1 Segment Definition and Scope
- 12.5.2 Historical Market Size, 2018-2025
- 12.5.3 Revenue Forecast, 2025-2035
- 12.5.4 Volume Forecast, 2025-2035
- 12.5.5 Base-Year Market Share, 2025
- 12.5.6 Segment CAGR and Growth Drivers
- 12.5.7 Subsegment Market Size and Forecast
- 12.5.7.1 E-Commerce and Retail
- 12.5.7.2 FMCG and Consumer Durables
- 12.5.7.3 BFSI and Fintech
- 12.5.7.4 Automotive and Mobility
- 12.5.7.5 Media, Entertainment and Gaming
- 12.5.7.6 Others
- 12.5.8 Subsegment Pricing and Adoption Trends
- 12.5.9 Leading Suppliers and Competition
- 12.5.10 Regional Demand and Opportunities
- 12.6 By Enterprise Size - Market Size and Forecast, 2025-2035
- 12.6.1 Segment Definition and Scope
- 12.6.2 Historical Market Size, 2018-2025
- 12.6.3 Revenue Forecast, 2025-2035
- 12.6.4 Volume Forecast, 2025-2035
- 12.6.5 Base-Year Market Share, 2025
- 12.6.6 Segment CAGR and Growth Drivers
- 12.6.7 Subsegment Market Size and Forecast
- 12.6.7.1 Large Enterprises
- 12.6.7.2 Mid-Market Enterprises
- 12.6.7.3 Small Businesses and MSMEs
- 12.6.8 Subsegment Pricing and Adoption Trends
- 12.6.9 Leading Suppliers and Competition
- 12.6.10 Regional Demand and Opportunities
- 12.7 Segment Growth Comparison
- 12.8 Segment Attractiveness and Priority Matrix
Chapter 13 India Digital Advertising End-Use and Application Market Outlook
- 13.1 End-Use Industry and Customer Demand Structure
- 13.2 Leading Applications and Customer Groups
- 13.3 End-Use Market Size, Share and Forecast
- 13.4 Major End-Use Industry Deep Dives
- 13.4.1 Customer Requirements and Use Cases
- 13.4.2 Demand and Replacement Cycles
- 13.4.3 Technical and Regulatory Considerations
- 13.4.4 Purchasing and Procurement Models
- 13.4.5 Leading Vendors and Distribution Channels
- 13.4.6 Forecast and Commercial Opportunities
- 13.5 Emerging Applications and Cross-Segment Demand
- 13.6 End-Use Industry Investment Priorities
Chapter 14 India Digital Advertising Geographic Market Outlook, 2025-2035
- 14.1 Domestic Market Distribution and Demand Clusters
- 14.2 State- or Province-Wise Market Size and Forecast, 2025-2035
- 14.3 City and Metropolitan Market Outlook
- 14.4 Industrial, Manufacturing and Commercial Clusters
- 14.5 Geographic Concentration of Key End Users
- 14.6 Local Pricing and Purchasing Differences
- 14.7 Domestic Production Facilities and Capacity Map
- 14.8 Local Infrastructure and Project Pipeline
- 14.9 State-Level Policy and Incentive Differences
- 14.10 Subnational Investment Hotspots and Opportunities
- 14.11 Distribution and Logistics Networks
- 14.12 Domestic Competitive Footprint
Chapter 15 India Digital Advertising Technology, Innovation and Sustainability Outlook
- 15.1 Technology Landscape and Maturity
- 15.2 Product, Process and Service Innovation
- 15.3 AI, Automation and Digital Tools in the Industry
- 15.4 Technology Adoption and Performance Benchmarking
- 15.5 Innovation Pipeline and R&D Investment
- 15.6 Patent and Intellectual Property Trends
- 15.7 Energy Efficiency and Resource Management
- 15.8 Sustainability, Recycling and Circularity
- 15.9 Technology Roadmap, 2025-2035
- 15.10 Risks of Obsolescence and Technology Substitution
Chapter 16 India Digital Advertising Market Key Strategic Imperatives
- 16.1 Growth and Market Entry Priorities
- 16.2 High-Return Products and Segments
- 16.3 Pricing, Profitability and Cost Optimization
- 16.4 Technology Investment and Product Differentiation
- 16.5 Supply Chain Localization and Resilience
- 16.6 Distribution and Customer Acquisition
- 16.7 Partnership, Acquisition and Capacity Strategy
- 16.8 Regional Expansion Priorities
- 16.9 Short-, Medium- and Long-Term Actions
Chapter 17 Competition Outlook
- 17.1 Industry Competition Characteristics
- 17.2 Market Structure and Concentration
- 17.3 Market Share and Competitive Positioning, 2025
- 17.4 Company-Wise Revenue and Product Benchmarking
- 17.5 Production and Service Capacity Benchmarking
- 17.6 Technology, Pricing and Differentiation
- 17.7 Regional Footprint and Distribution Strength
- 17.8 Mergers, Acquisitions and Strategic Alliances
- 17.9 New Entrants and Competitive Threats
- 17.10 Porter's Five Forces and Industry Attractiveness
- 17.11 Competitive Outlook, 2025-2035
Chapter 18 Company Profiles
- 18.1 Company Coverage and Selection Criteria
- 18.2 Google India
- 18.2.1 Business Description
- 18.2.2 Company Ownership and Geographic Presence
- 18.2.3 Product and Service Portfolio
- 18.2.4 Manufacturing and Operating Footprint
- 18.2.5 Production Capacity and Expansion Plans
- 18.2.6 Financial Performance and Investment
- 18.2.7 Market Share and Competitive Position
- 18.2.8 Technology and Innovation Capabilities
- 18.2.9 Strategic Alliances or Partnerships
- 18.2.10 Recent Developments
- 18.2.11 Growth Strategy and Outlook
- 18.3 Meta Platforms India
- 18.4 Amazon Ads India
- 18.5 Flipkart Ads
- 18.6 JioStar
- 18.7 InMobi
- 18.8 Affle
- 18.9 Times Internet
- 18.10 VerSe Innovation
- 18.11 ShareChat
- 18.12 Other Relevant Market Participants
Note: Every listed company is profiled on the structure shown under the first company. The company list is preliminary and may change based on research findings, market developments, data availability and client requirements.
Chapter 19 Disclaimer
- 19.1 Research and Forecast Disclaimer
- 19.2 Data Source and Estimation Limitations
Note: The depth of individual sections depends on data availability for this market. Volume, capacity, trade and other unit-based metrics are included where applicable.

