Home » Automation & Process Control » Temperature Monitoring Systems Market

Temperature Monitoring Systems Market By Product Type (Contact-based Temperature Monitoring Systems & Non-contact-based Temperature Monitoring Systems), By End-use Vertical (Food & Beverage, Healthcare, Semiconductor & Electronics, Automotive, Transportation & Logistics, Oil & Gas, and Others) – Growth, Future Prospects, and Competitive Landscape, 2018 – 2026

Price: $3699

Published: | Report ID: 11089 | Report Format : PDF

Market Insights

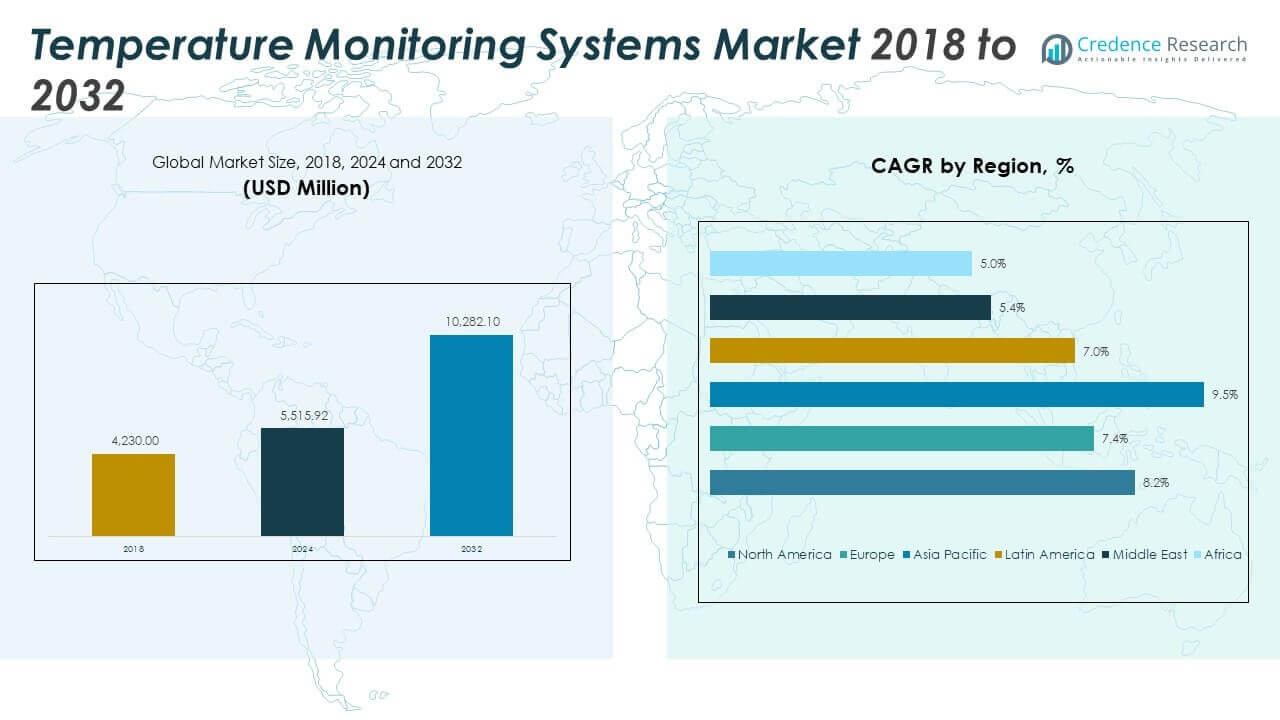
The global temperature monitoring systems market was valued at US$ 3,976.2 Mn in 2017 and is expected to grow at a CAGR of 4.2% from 2018 to 2026.

North America is the market leader, with Asia Pacific expected to grow faster during the forecast period.

In 2017, North America led the global market for temperature monitoring systems in terms of value contribution. The region accounted for over 35% of the global temperature monitoring systems market in the same year. The dominance is largely credited to a combination of factors, including the growing adoption of wireless variants among the pharmaceutical and food and beverage industries, stringent regulatory requirements for ensuring product quality across these industry verticals, and technological advances leading to the replacement of existing units with state-of-the-art variants.

On the other hand, Asia Pacific is poised to register relatively superior growth during the forecast period from 2018 to 2026. The anticipated demand will be driven by steady growth in the industrial sector and an increasing number of healthcare facilities in the region.

Design Element 2

Access crucial information at unmatched prices!

Request your free sample report today & start making informed decisions powered by Credence Research!

Download Free Sample

CTA Design Element 3

Rise in adoption of non-contact-based units to complement market growth during the forecast period

Contact-based temperature monitoring systems contributed the most value to global temperature monitoring systems in 2017. These systems, being the conventional and most widely recognized monitoring solutions across industry verticals, account for the majority of the market share. The trend is expected to continue, and the segment is expected to register steady growth through 2026.

On the other hand, non-contact-based temperature monitoring solutions are estimated to register a relatively higher adoption rate during the forecast period from 2018 to 2026. The demand for non-contact-based monitoring units will be driven by the growing emphasis on continuous temperature monitoring across temperature-sensitive applications such as patient care, cold storage, and server room maintenance, among others.

Key Players:

Some of the leading manufacturers profiled in the research study include 3M Company, ABB Ltd., Emerson Electric, Honeywell International Inc., Deltatrack, Siemens AG, Thermo Fisher Scientific, Testo AG, Fluke Corporation (a subsidiary of Fortive Corporation), Kelsius, Ltd., Rees Scientific, Omega Engineering (a subsidiary of Spectris), and Monnit Corporation, among others.

Periods of History and Forecast

This research study provides qualitative as well as quantitative insights for each segment and sub-segment from 2016 to 2026, considering 2017as the base year for the research. The CAGR (compound annual growth rate) for each segment and sub-segment is calculated for the forecast period from 2018 to 2026.

Shape Your Report to Specific Countries or Regions & Enjoy 30% Off!

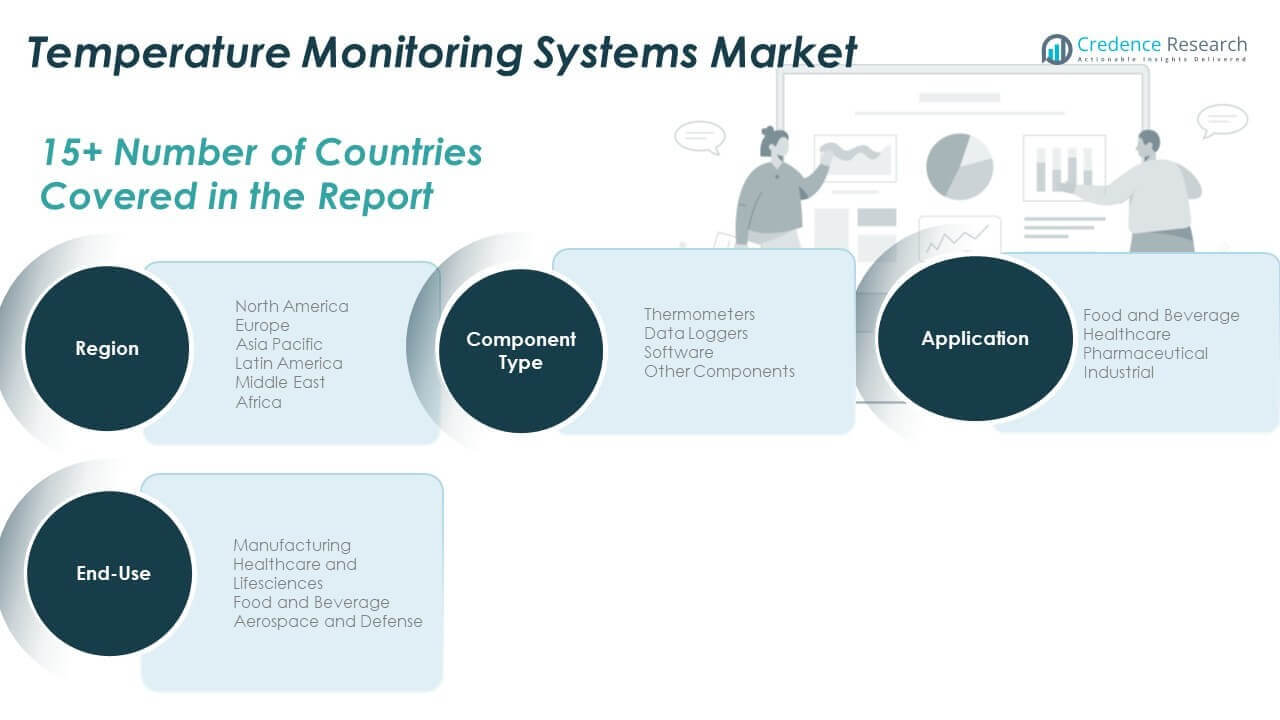
Report Scope by Segments

Key questions are answered in this report.

  • In 2016 and 2017, how big was the global market for temperature monitoring systems?
  • What are the estimated forecasts and market projections from 2018 up to 2026?
  • Which is the largest regional market for temperature monitoring systems?
  • Which product variant contributes the largest revenue worldwide?
  • Which end-use segment (industry vertical) has the highest penetration of temperature monitoring systems worldwide?
  • Predominant trends shaping the global market for temperature monitoring systems worldwide
  • Who are the leading manufacturers in the global temperature monitoring systems market worldwide?
  • What are the key strategies adopted by the leading manufacturers in the global temperature monitoring systems market?

1. Preface
1.1. Report Scope and Description
1.2. Research Methodology
1.2.1. Phase I-Secondary Research
1.2.2. Phase II-Primary Research
1.2.3. Phase III-Expert Panel Review
1.2.4. Assumptions
1.2.5. Approach Adopted

2. Executive Summary
2.1. Global TMS Market Snapshot
2.2. Global TMS Market, by Product Type, 2017 (US$ Mn)
2.3. Global TMS Market, by End-use Vertical, 2017 (US$ Mn)
2.4. Global TMS Market, by Geography, 2017 (US$ Mn)

3. Global Temperature Monitoring Systems (TMS) Market Analysis
3.1. Global TMS Market Overview
3.2. Market Inclination Insights
3.2.1. Recent Trends
3.2.2. Future Outlook
3.3. Market Dynamics
3.3.1. Market Drivers
3.3.2. Market Challenges
3.4. Attractive Investment Proposition
3.5. Market Positioning of Leading Manufacturers
3.5.1. Major Strategies Adopted
3.5.2. Analyst Recommendations

4. Global Temperature Monitoring Systems (TMS) Market Revenue, By Product Type, 2016 – 2026 (US$ Mn)
4.1. Market Analysis
4.2. Contact-based TMS
4.3. Non-contact-based TMS

5. Global Temperature Monitoring Systems (TMS) Market Revenue, By End-use Vertical , 2016 – 2026 (US$ Mn)
5.1. Market Analysis
5.2. Food & Beverage
5.3. Semiconductors & Electronics
5.4. Automotive
5.5. Healthcare
5.6. Transportation & Logistics
5.7. Oil & Gas
5.8. Others (Power & Energy, IT & Telecom, etc.)

6. North America Temperature Monitoring Systems (TMS) Market Analysis, 2016 – 2026 (US$ Mn)
6.1. North America TMS Market Revenue, By Product Type, 2016 – 2026 (US$ Mn)
6.1.1. Contact-based TMS
6.1.2. Non-contact-based TMS
6.2. North America TMS Market Revenue, By End-use Vertical, 2016 – 2026 (US$ Mn)
6.2.1. Food & Beverage
6.2.2. Semiconductors & Electronics
6.2.3. Automotive
6.2.4. Healthcare
6.2.5. Transportation & Logistics
6.2.6. Oil & Gas
6.2.7. Others (Power & Energy, IT & Telecom, etc.)
6.3. North America TMS Market Revenue, By Country, 2016 – 2026 (US$ Mn)
6.3.1. U.S.
6.3.1.1. U.S. TMS Market Revenue, By Product Type, 2016 – 2026 (US$ Mn)
6.3.1.2. U.S. TMS Market Revenue, By End-use Vertical, 2016 – 2026 (US$ Mn)
6.3.2. Rest of North America
6.3.2.1. Rest of North America TMS Market Revenue, By Product Type, 2016 – 2026 (US$ Mn)
6.3.2.2. Rest of North America TMS Market Revenue, By End-use Vertical, 2016 – 2026 (US$ Mn)

7. Europe Temperature Monitoring Systems (TMS) Market Analysis, 2016 – 2026 (US$ Mn)
7.1. Europe TMS Market Revenue, By Product Type, 2016 – 2026 (US$ Mn)
7.1.1. Contact-based TMS
7.1.2. Non-contact-based TMS
7.2. Europe TMS Market Revenue, By End-use Vertical, 2016 – 2026 (US$ Mn)
7.2.1. Food & Beverage
7.2.2. Semiconductors & Electronics
7.2.3. Automotive
7.2.4. Healthcare
7.2.5. Transportation & Logistics
7.2.6. Oil & Gas
7.2.7. Others (Power & Energy, IT & Telecom, etc.)
7.3. Europe TMS Market Revenue, By Region, 2016 – 2026 (US$ Mn)
7.3.1. U.K.
7.3.1.1. U.K. TMS Market Revenue, By Product Type, 2016 – 2026 (US$ Mn)
7.3.1.2. U.K. TMS Market Revenue, By End-use Vertical, 2016 – 2026 (US$ Mn)
7.3.2. Germany
7.3.2.1. Germany TMS Market Revenue, By Product Type, 2016 – 2026 (US$ Mn)
7.3.2.2. Germany TMS Market Revenue, By End-use Vertical, 2016 – 2026 (US$ Mn)
7.3.3. France
7.3.3.1. France TMS Market Revenue, By Product Type, 2016 – 2026 (US$ Mn)
7.3.3.2. France TMS Market Revenue, By End-use Vertical, 2016 – 2026 (US$ Mn)
7.3.4. Rest of Europe
7.3.4.1. Rest of Europe TMS Market Revenue, By Product Type, 2016 – 2026 (US$ Mn)
7.3.4.2. Rest of Europe TMS Market Revenue, By End-use Vertical, 2016 – 2026 (US$ Mn)

8. Asia Pacific Temperature Monitoring Systems (TMS) Market Analysis, 2016 – 2026 (US$ Mn)
8.1. Asia Pacific TMS Market Revenue, By Product Type, 2016 – 2026 (US$ Mn)
8.1.1. Contact-based TMS
8.1.2. Non-contact-based TMS
8.2. Asia Pacific TMS Market Revenue, By End-use Vertical, 2016 – 2026 (US$ Mn)
8.2.1. Food & Beverage
8.2.2. Semiconductors & Electronics
8.2.3. Automotive
8.2.4. Healthcare
8.2.5. Transportation & Logistics
8.2.6. Oil & Gas
8.2.7. Others (Power & Energy, IT & Telecom, etc.)
8.3. Asia Pacific TMS Market Revenue, By Country, 2016 – 2026 (US$ Mn)
8.3.1. Japan
8.3.1.1. Japan TMS Market Revenue, By Product Type, 2016 – 2026 (US$ Mn)
8.3.1.2. Japan TMS Market Revenue, By End-use Vertical, 2016 – 2026 (US$ Mn)
8.3.2. China
8.3.2.1. China TMS Market Revenue, By Product Type, 2016 – 2026 (US$ Mn)
8.3.2.2. China TMS Market Revenue, By End-use Vertical, 2016 – 2026 (US$ Mn)
8.3.3. India
8.3.3.1. India TMS Market Revenue, By Product Type, 2016 – 2026 (US$ Mn)
8.3.3.2. India TMS Market Revenue, By End-use Vertical, 2016 – 2026 (US$ Mn)
8.3.4. Rest of Asia Pacific
8.3.4.1. Rest of Asia Pacific TMS Market Revenue, By Product Type, 2016 – 2026 (US$ Mn)
8.3.4.2. Rest of Asia Pacific TMS Market Revenue, By End-use Vertical, 2016 – 2026 (US$ Mn)

9. Rest of World Temperature Monitoring Systems (TMS) Market Analysis, 2016 – 2026 (US$ Mn)
9.1. Rest of World TMS Market Revenue, By Product Type, 2016 – 2026 (US$ Mn)
9.1.1. Contact-based TMS
9.1.2. Non-contact-based TMS
9.2. Rest of World TMS Market Revenue, By End-use Vertical, 2016 – 2026 (US$ Mn)
9.2.1. Food & Beverage
9.2.2. Semiconductors & Electronics
9.2.3. Automotive
9.2.4. Healthcare
9.2.5. Transportation & Logistics
9.2.6. Oil & Gas
9.2.7. Others (Power & Energy, IT & Telecom, etc.)
9.3. Rest of World TMS Market Revenue, By Region, 2016 – 2026 (US$ Mn)
9.3.1. Latin America
9.3.1.1. Latin America TMS Market Revenue, By Product Type, 2016 – 2026 (US$ Mn)
9.3.1.2. Latin America TMS Market Revenue, By End-use Vertical, 2016 – 2026 (US$ Mn)
9.3.2. Middle-East and Africa
9.3.2.1. Middle-East and Africa TMS Market Revenue, By Product Type, 2016 – 2026 (US$ Mn)
9.3.2.2. Middle-East and Africa TMS Market Revenue, By End-use Vertical, 2016 – 2026 (US$ Mn)

10. Company Profiles
10.1. 3M Company
10.2. ABB Ltd.
10.3. Emerson Electric
10.4. Honeywell International Inc.
10.5. Deltatrack
10.6. Siemens AG
10.7. Thermo Fisher Scientific
10.8. Testo AG
10.9. Fluke Corporation (Subsidiary of Fortive Corporation)
10.10. Kelsius, Ltd.
10.11. Rees Scientific
10.12. Omega Engineering (A Subsidiary of Spectris)
10.13. Monnit Corporation

List of Figures

FIG. 1 : Global Temperature Monitoring Systems (TMS): Market Segmentation
FIG. 2 : Global TMS Market: Research Methodology
FIG. 3 : Top-Down and Bottom Up Approach
FIG. 4 : Global TMS Market, by Product Type, 2017 (US$ Mn)
FIG. 5 : Global TMS Market, by End-use Vertical, 2017 (US$ Mn)
FIG. 7 : Global TMS Market, by Geography, 2017 (US$ Mn)
FIG. 8 : Global TMS Market Value and Growth, 2016 – 2026, (US$ Mn and % Y-o-Y)
FIG. 9 : See-Saw Analysis : Global TMS Market
FIG. 10 : Market Positioning of the Leading Manufacturers, 2017
FIG. 11 : Global TMS Market Value Contribution, by Product Type, 2017 & 2026 (Value %)
FIG. 12 : Global Contact-based TMS Market Value and Growth, 2016 – 2026, (Value %)
FIG. 13 : Global Non-contact-based TMS Market Value and Growth, 2016 – 2026, (US$ Mn)
FIG. 14 : Global TMS Market Value Contribution, by End-use Vertical, 2017 & 2026 (US$ Mn)
FIG. 15 : Global TMS Market Value and Growth in Food & Beverage Vertical, 2016 – 2026, (US$ Mn)
FIG. 16 : Global TMS Market Value and Growth in Semiconductors & Electronics Vertical, 2016 – 2026, (Value %)
FIG. 17 : Global TMS Market Value and Growth in Automotive Vertical, 2016 – 2026, (US$ Mn)
FIG. 18 : Global TMS Market Value and Growth in Healthcare Vertical, 2016 – 2026, (US$ Mn)
FIG. 19 : Global TMS Market Value and Growth in Transportation & Logistics Vertical, 2016 – 2026, (US$ Mn)
FIG. 20 : Global TMS Market Value and Growth in Oil & Gas Vertical, 2016 – 2026, (US$ Mn)
FIG. 21 : Global TMS Market Value and Growth in Other Verticals, 2016 – 2026, (US$ Mn)
FIG. 22 : North America TMS Market Value and Growth, 2016 – 2026, (US$ Mn) (Y-o-Y %)
FIG. 23 : Europe TMS Market Value and Growth, 2016 – 2026, (US$ Mn) (Y-o-Y %)
FIG. 24 : Asia Pacific TMS Market Value and Growth, 2016 – 2026, (US$ Mn) (Y-o-Y %)
FIG. 25 : RoW TMS Market Value and Growth, 2016 – 2026, (US$ Mn) (Y-o-Y %)

List of Tables

TABLE 1 : Market Snapshot: Global Temperature Monitoring Systems (TMS) Market
TABLE 2 : Key Trends in TMS Industry
TABLE 3 : Impact Indicators
TABLE 4 : Impact Analysis of Drivers and Restraints
TABLE 5 : North America TMS Market Value, by Product Type, 2016 – 2026 (US$ Mn)
TABLE 6 : North America TMS Market Value, by End-use Vertical, 2016 – 2026 (US$ Mn)
TABLE 7 : North America TMS Market Value, by Country, 2016 – 2026 (US$ Mn)
TABLE 8 : U.S. TMS Market Value, by Product Type, 2016 – 2026 (US$ Mn)
TABLE 9 : U.S. TMS Market Value, by End-use Vertical, 2016 – 2026 (US$ Mn)
TABLE 10 : Rest of North America TMS Market Value, by Product Type, 2016 – 2026 (US$ Mn)
TABLE 11 : Rest of North America TMS Market Value, by End-use Vertical, 2016 – 2026 (US$ Mn)
TABLE 12 : Europe TMS Market Value, by Product Type, 2016 – 2026 (US$ Mn)
TABLE 13 : Europe TMS Market Value, by End-use Vertical, 2016 – 2026 (US$ Mn)
TABLE 14 : Europe TMS Market Value, by Country, 2016 – 2026 (US$ Mn)
TABLE 15 : U.K. TMS Market Value, by Product Type, 2016 – 2026 (US$ Mn)
TABLE 16 : U.K. TMS Market Value, by End-use Vertical, 2016 – 2026 (US$ Mn)
TABLE 17 : France TMS Market Value, by Product Type, 2016 – 2026 (US$ Mn)
TABLE 18 : France TMS Market Value, by End-use Vertical, 2016 – 2026 (US$ Mn)
TABLE 19 : Germany TMS Market Value, by Product Type, 2016 – 2026 (US$ Mn)
TABLE 20 : Germany TMS Market Value, by End-use Vertical, 2016 – 2026 (US$ Mn)
TABLE 21 : Rest of Europe TMS Market Value, by Product Type, 2016 – 2026 (US$ Mn)
TABLE 22 : Rest of Europe TMS Market Value, by End-use Vertical, 2016 – 2026 (US$ Mn)
TABLE 23 : Asia Pacific TMS Market Value, by Product Type, 2016 – 2026 (US$ Mn)
TABLE 24 : Asia Pacific TMS Market Value, by End-use Vertical, 2016 – 2026 (US$ Mn)
TABLE 25 : Asia Pacific TMS Market Value, by Country, 2016 – 2026 (US$ Mn)
TABLE 26 : China TMS Market Value, by Product Type, 2015- 2025 (US$ Mn)
TABLE 27 : China TMS Market Value, by End-use Vertical, 2016 – 2026 (US$ Mn)
TABLE 28 : Japan TMS Market Value, by Product Type, 2016 – 2026 (US$ Mn)
TABLE 29 : Japan TMS Market Value, by End-use Vertical, 2016 – 2026 (US$ Mn)
TABLE 30 : India TMS Market Value, by Product Type, 2016 – 2026 (US$ Mn)
TABLE 31 : India TMS Market Value, by End-use Vertical, 2016 – 2026 (US$ Mn)
TABLE 32 : Rest of Asia Pacific TMS Market Value, by Product Type, 2016 – 2026 (US$ Mn)
TABLE 33 : Rest of Asia Pacifc TMS Market Value, by End-use Vertical, 2016 – 2026 (US$ Mn)
TABLE 34 : Rest of World TMS Market Value, by Product Type, 2016 – 2026 (US$ Mn)
TABLE 35 : Rest of World TMS Market Value, by End-use Vertical, 2016 – 2026 (US$ Mn)
TABLE 36 : Rest of World TMS Market Value, by Region, 2016 – 2026 (US$ Mn)
TABLE 37 : Latin America TMS Market Value, by Product Type, 2016 – 2026 (US$ Mn)
TABLE 38 : Latin America TMS Market Value, by End-use Vertical, 2016 – 2026 (US$ Mn)
TABLE 39 : Middle-East and Africa TMS Market Value, by Product Type, 2016 – 2026 (US$ Mn)
TABLE 40 : Middle-East TMS Market Value, by End-use Vertical, 2016 – 2026 (US$ Mn)

Frequently Asked Question:

What is the size of Temperature Monitoring Systems Market?

The market for Temperature Monitoring Systems Market is expected to reach USD$ 3,976.2 Mn in 2026

What is the Temperature Monitoring Systems Market CAGR?

The Temperature Monitoring Systems Market is expected to see significant CAGR growth over the coming years, at 4.2%.

What is the Forecast period considered for Temperature Monitoring Systems Market?

The report is forecasted from 2018 -2026.

What is the base year considered for Temperature Monitoring Systems Market?

The base year of this report is 2017.

Who are the major players in this market?

3M Company, ABB Ltd., Emerson Electric, Honeywell International Inc., Deltatrack, Siemens AG, Thermo Fisher Scientific. are some of the major players in the global market.

Low Voltage AC Drives Market

Published:
Report ID: 50049

Europe Robotic Laser Cutting Market

Published:
Report ID: 49791

Europe Fabric Cutting Machines Market

Published:
Report ID: 44478

Mechanized Irrigation Systems Market

Published:
Report ID: 8736

Busway-Bus Duct Market

Published:
Report ID: 49297

India Gas Cutting Machine Market

Published:
Report ID: 48869

Gas Cutting Machine Market

Published:
Report ID: 48840

Fabric Cutting Machines Market

Published:
Report ID: 5980

Middle East and Africa Fabric Cutting Machines Market

Published:
Report ID: 48649

Middle East and Africa Gas Cutting Machine Market

Published:
Report ID: 48650

Car Seat and Accessories Market

Published:
Report ID: 48515

Control Room Solution Market

Published:
Report ID: 48518

Purchase Options

The report comes as a view-only PDF document, optimized for individual clients. This version is recommended for personal digital use and does not allow printing.
$3699

To meet the needs of modern corporate teams, our report comes in two formats: a printable PDF and a data-rich Excel sheet. This package is optimized for internal analysis and multi-location access, making it an excellent choice for organizations with distributed workforce.
$4699

The report will be delivered in printable PDF format along with the report’s data Excel sheet. This license offers 100 Free Analyst hours where the client can utilize Credence Research Inc.’s research team. It is highly recommended for organizations seeking to execute short, customized research projects related to the scope of the purchased report.
$6699

Smallform of Sample request

Have a question?

User Profile

Don’t settle for less – trust Mitul to help you find the best solution.

Report delivery within 24 to 48 hours

– Other Info –

What people say?-

User Review

I am very impressed with the information in this report. The author clearly did their research when they came up with this product and it has already given me a lot of ideas.

Jana Schmidt
CEDAR CX Technologies

– Connect with us –

Phone

+91 6232 49 3207


support

24/7 Research Support


sales@credenceresearch.com

– Research Methodology –

Going beyond the basics: advanced techniques in research methodology

– Trusted By –

Pepshi, LG, Nestle
Motorola, Honeywell, Johnson and johnson
LG Chem, SIEMENS, Pfizer
Unilever, Samsonite, QIAGEN