Licensed brick sets and learning kits anchor spending
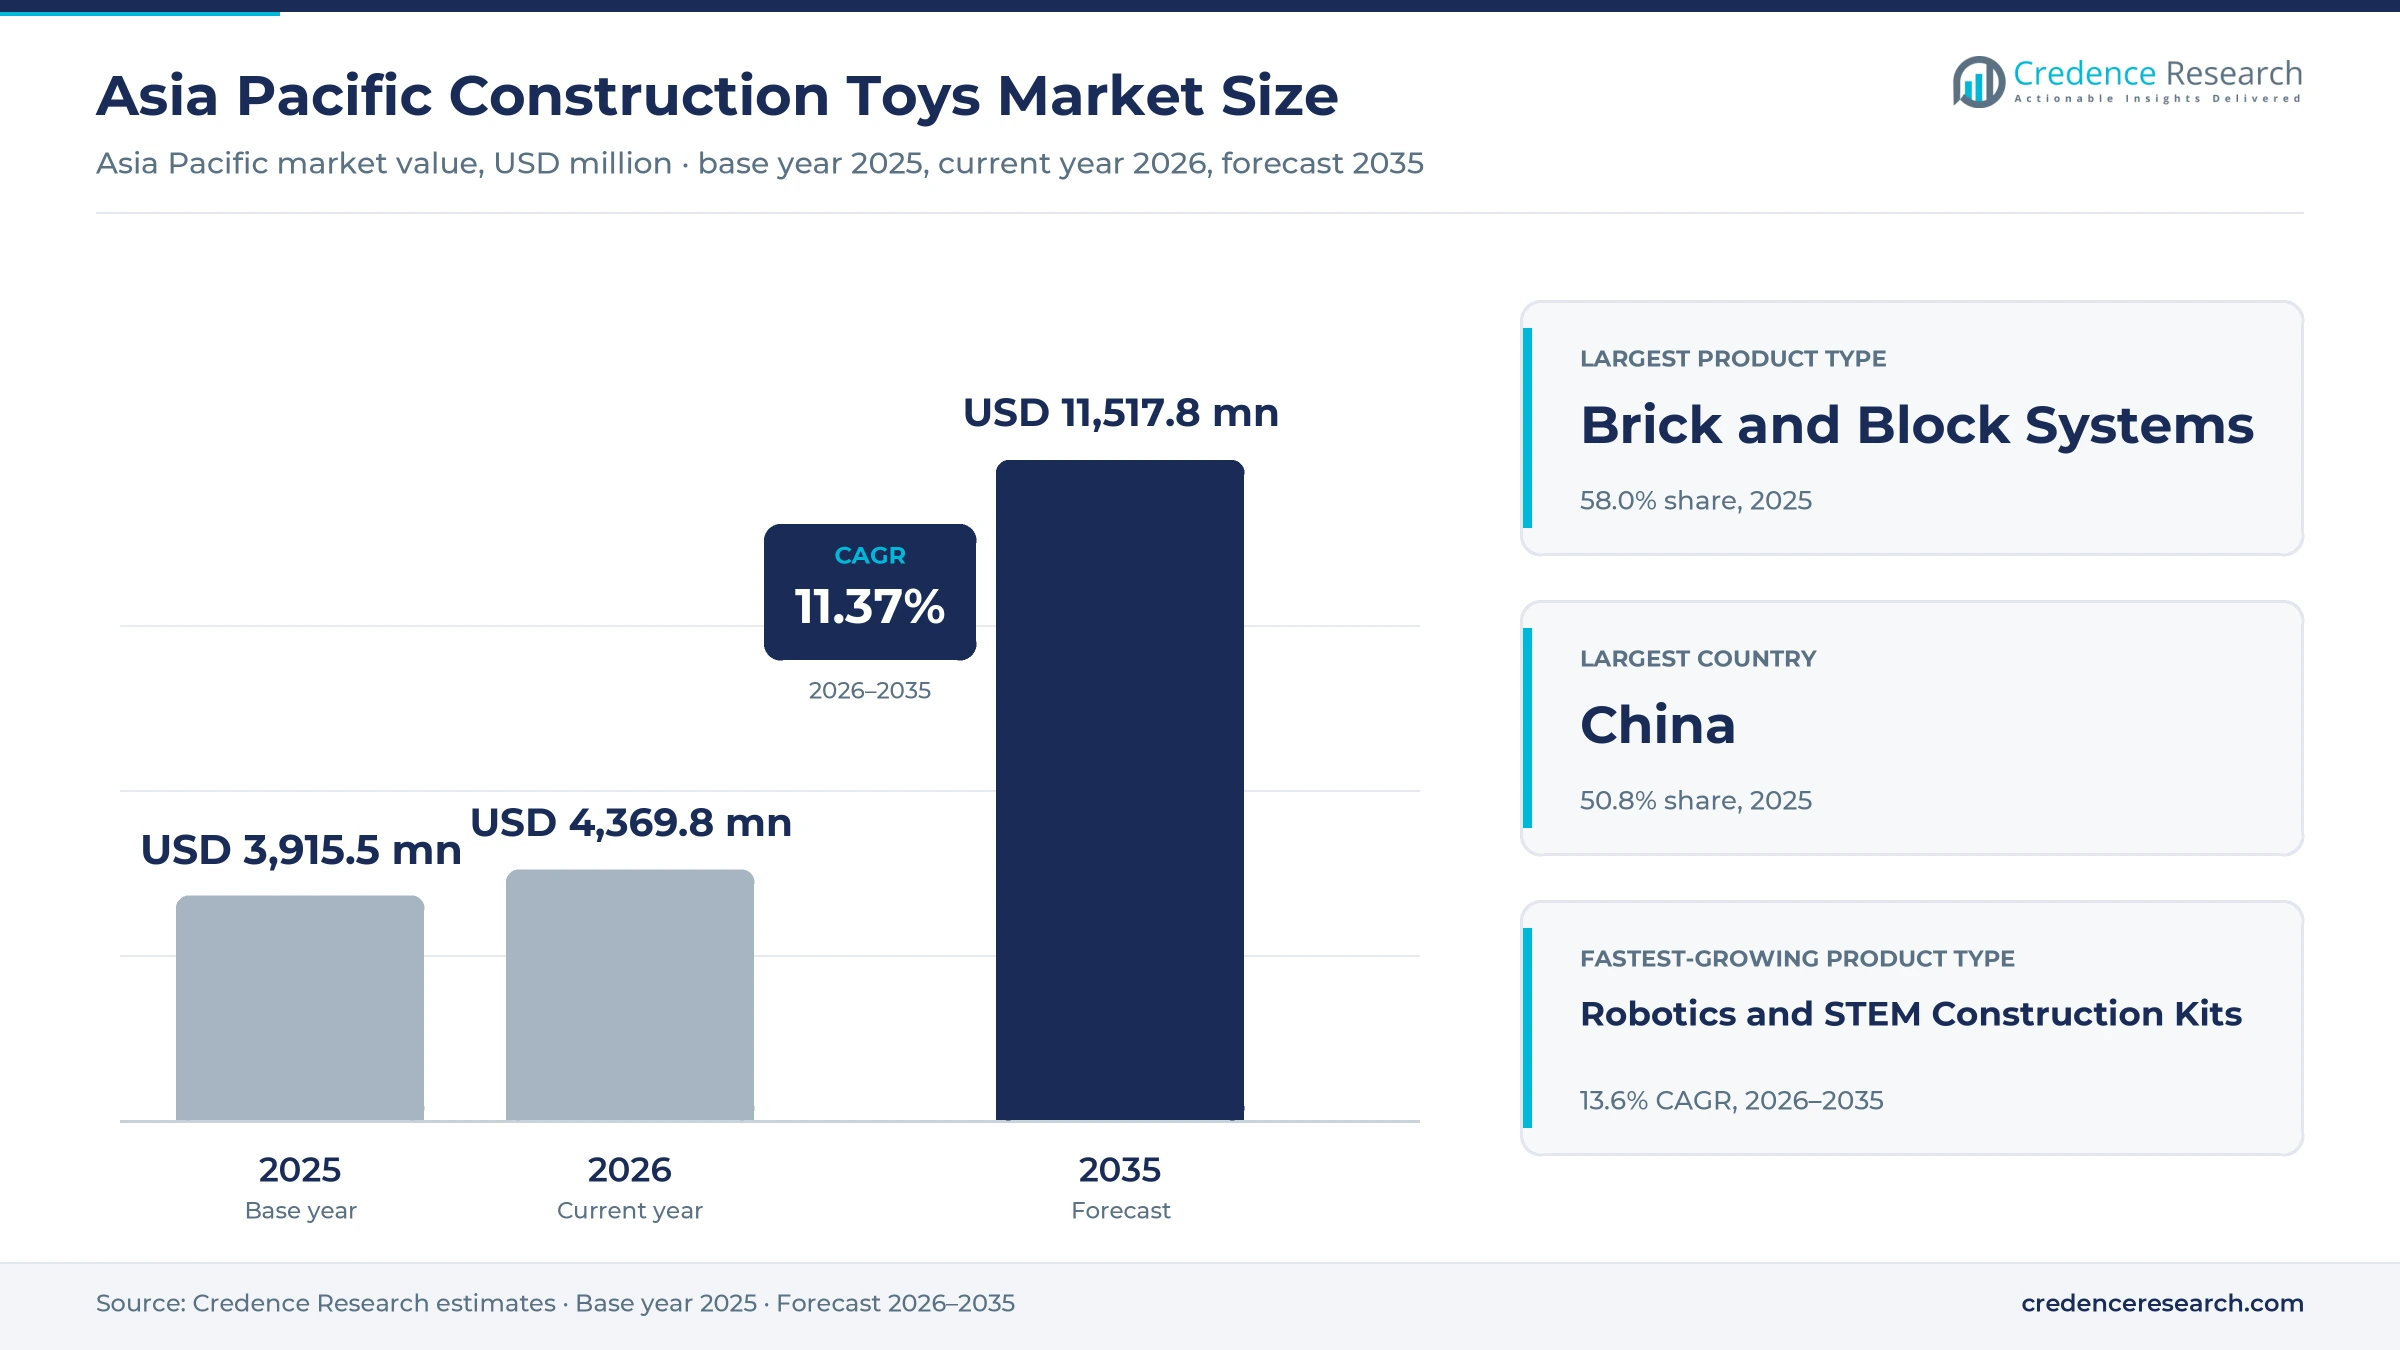
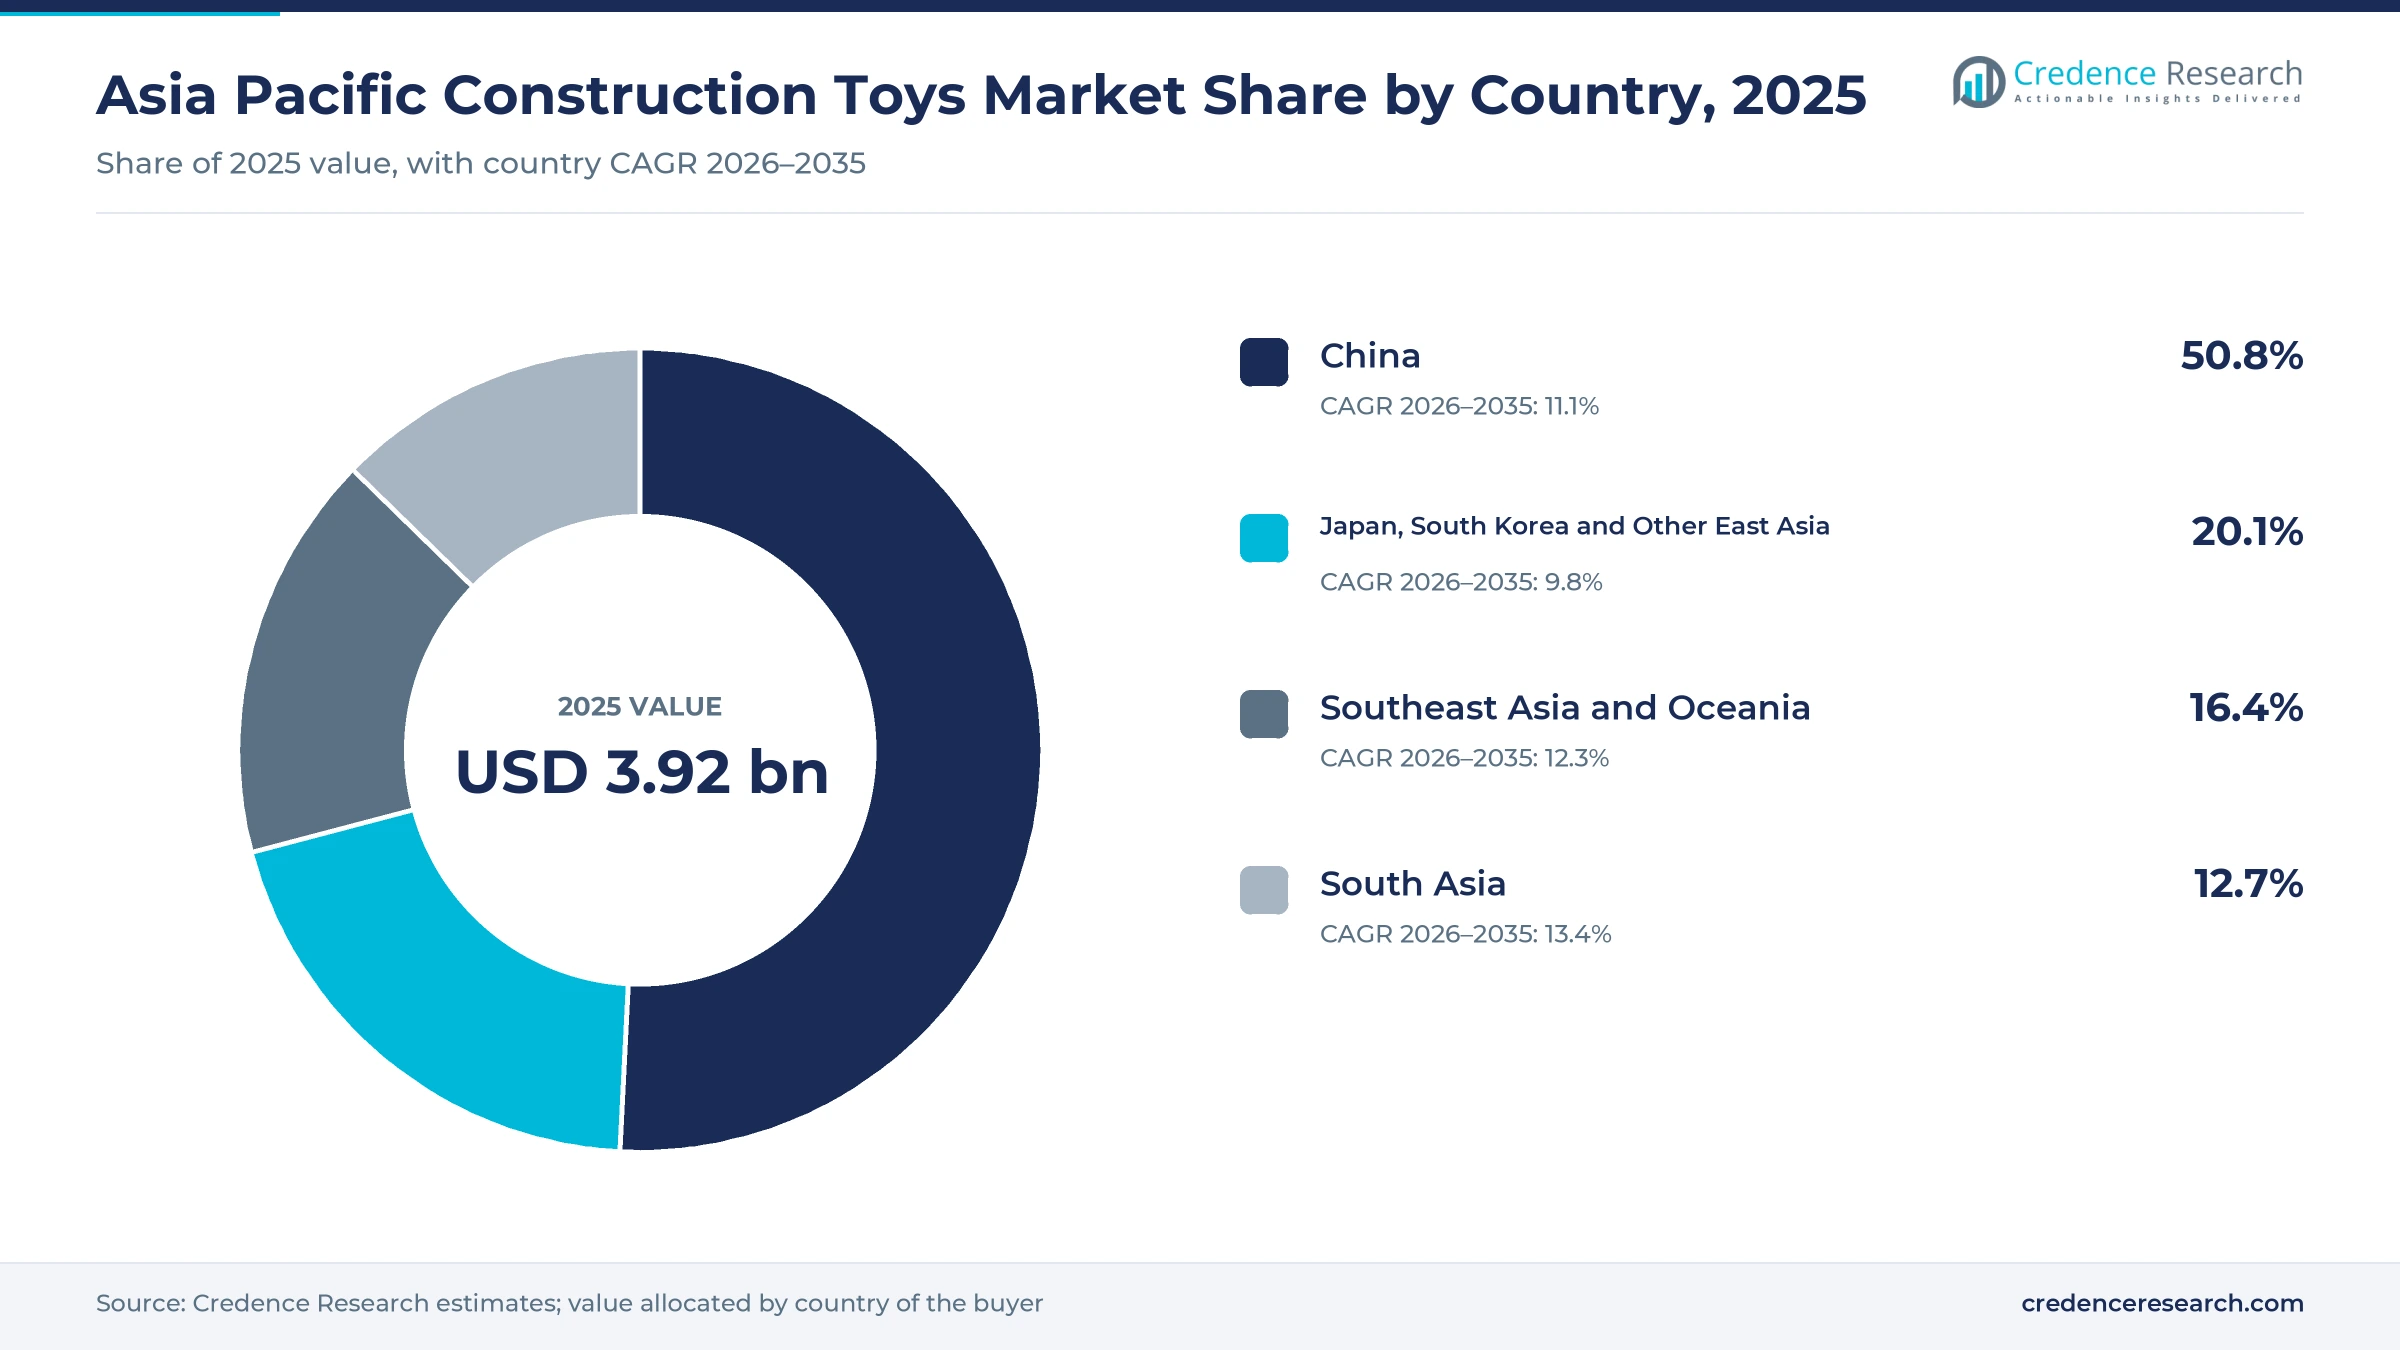
The Asia Pacific construction toys market was valued at USD 3.92 billion in 2025 and is projected to increase from USD 4.37 billion in 2026 to USD 11.52 billion by 2035, registering a CAGR of 11.37% during 2026–2035. Demand comes from parents who buy building sets as learning tools, from teenagers and adults who assemble licensed models for display, and from schools that add coding and robotics kits to lessons. China held the largest country share, 50.8% in 2025, because it combines about 225 million children with domestic brands and a dense network of LEGO stores. South Asia is the fastest-growing area at 13.4% a year, as branded stores reach Indian cities for the first time and school tinkering labs widen. The supply base is also shifting, since new brick and model kit factories in Vietnam and Japan add regional capacity, while low-priced Chinese character kits pull new buyers into the category.
Brick, magnetic, model and coding kits make up the count
The estimate counts new brick and block sets, magnetic tiles and sticks, mechanical and stacking sets including snap-fit plastic model kits built for display, and robotics and coding construction kits sold to buyers in Asia Pacific. Families account for most purchases, while schools, training centers and adult collectors buy through online marketplaces, mass retailers, brand stores and education distributors.
Ready-made figures, plush, puzzles, die-cast vehicles and digital building games are excluded, as are second-hand sets. Value is counted at the price paid by the end buyer, so sets molded in China, Vietnam or Japan for shipment to other regions do not enter the total.
Asia Pacific Construction Toys Market Insights
- The market rises from USD 3.92 billion in 2025 to USD 11.52 billion by 2035, an 11.37% pace, as building sets serve learning, hobby and gift needs at once.
- China held 50.8% of 2025 value, while South Asia grows fastest at 13.4% a year as branded retail reaches Indian cities.
- Brick and Block Systems held 58.0% of 2025 value, and Robotics and STEM Construction Kits grow fastest at 13.6% a year.
- LEGO opened its sixth factory worldwide in Binh Duong, Vietnam, on April 9, 2025, with 30,000 tons of initial annual capacity.
- LEGO sets the premium benchmark, while Bloks Group, Bandai Namco and Chenghai makers compete with licensed and lower-priced kits.
Brick systems lead while STEM kits grow fastest
Why do brick and block systems hold most of the value?
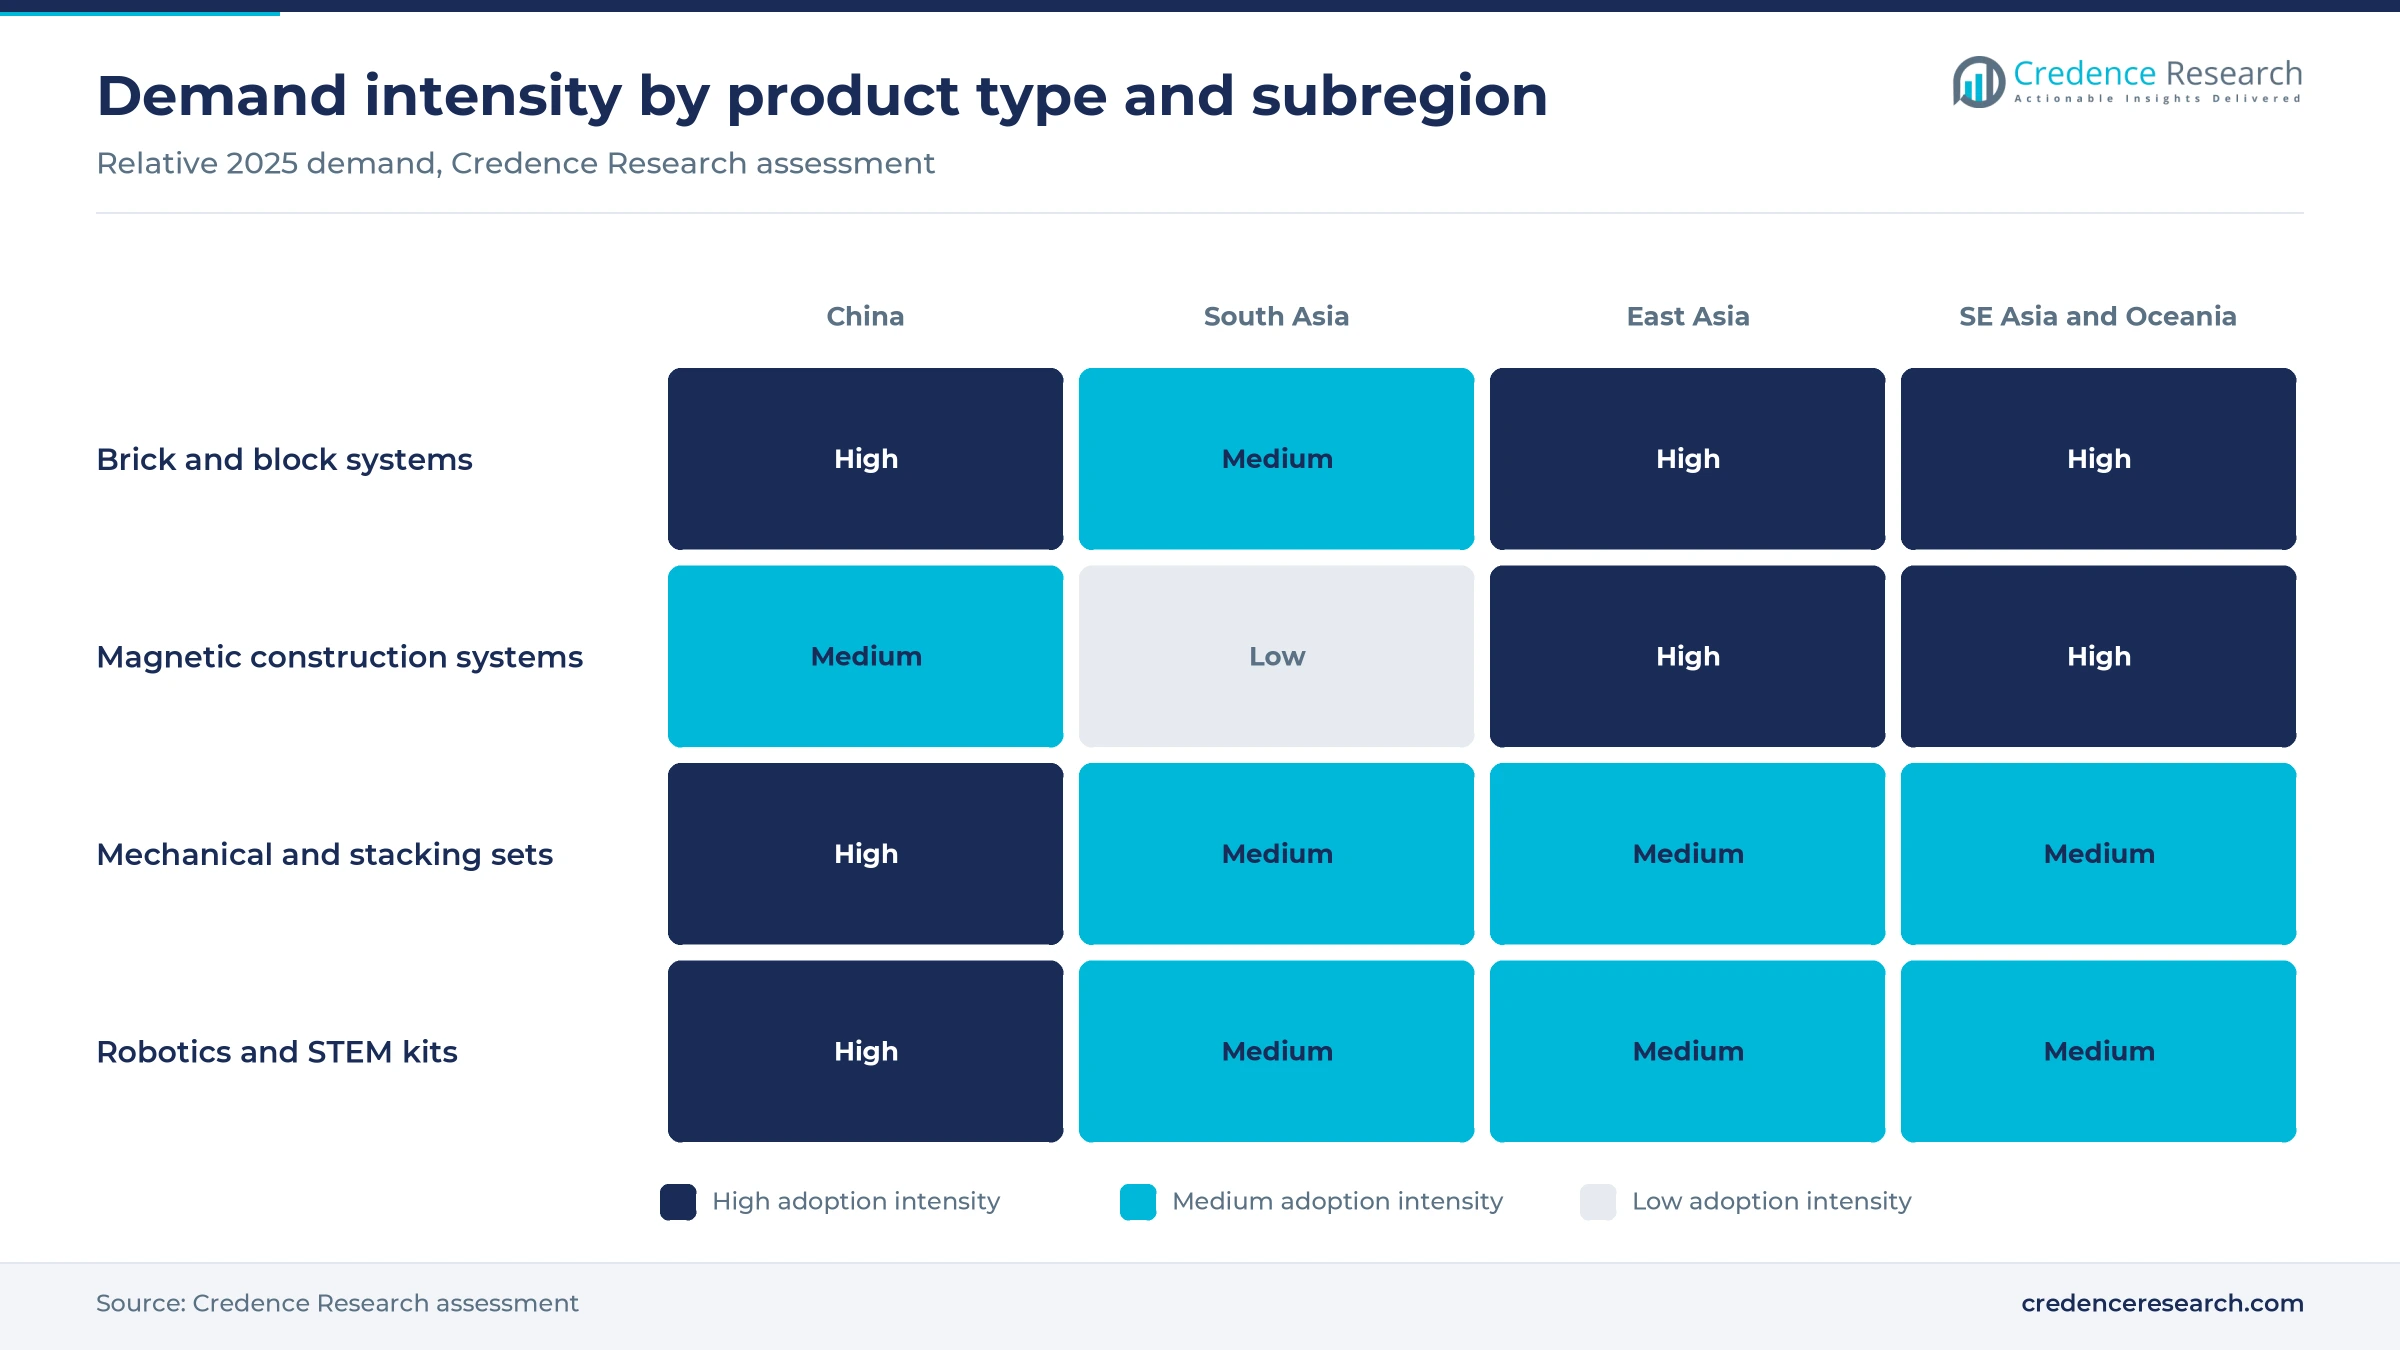
Based on product type, the market is categorized into brick and block systems, magnetic construction systems, mechanical and stacking construction systems, and robotics and STEM construction kits. Brick and Block Systems led with 58.0% of 2025 value because they are the most widely stocked format, and LEGO alone operates about 450 stores in China, according to China Daily in March 2026. Robotics and STEM Construction Kits grow fastest at 13.6% a year, as LEGO Education released a Computer Science and AI kit with 321 bricks, a motor and a color sensor for Years 3 to 6 in Australia in April 2026.
Why are buyers aged 12 and above the fastest-growing group?
Based on age group, the market is categorized into under three years, 3 to under five years, 5 to under 12 years, and 12 years and above. Children aged 5 to Under 12 Years led with 50.0% of 2025 value because primary-age children remain the core gift buyers, and consumers aged 6 to 16 produced 82.6% of Bloks Group revenue in the first half of 2025. Buyers aged 12 Years and Above grow fastest at 12.9% a year, as Bloks Group reported that buyers older than 16 rose to 14.8% of revenue in the first half of 2025 from 10.4% a year earlier. Japan adds a large adult hobby base, covered in the regional section.
How do themed sets and display models split the value?
Based on application, the market is categorized into open-ended play, guided learning, themed assembly and collector display. Themed Assembly led with 38.0% of 2025 value because licensed characters sell sets, and Bloks Group held 73 licensed IPs after adding 23 in 2025, including Toy Story and Zootopia, The Bamboo Works reported. Collector Display grows fastest at 12.7% a year, as Bandai Hobby Center started a new Shizuoka factory on July 24, 2025, lifting Gunpla capacity about 35% from 2023, according to Mantan Web. Glue-assembled and painted scale models are counted instead in the wider market for plastic model kits.
Which channels move the most sets and value?
Based on distribution channel, the market is categorized into online commerce, mass and department retail, specialty and brand retail, and educational and gift distribution. Mass and Department Retail led with 36.0% of 2025 value because toy shops, stationers and hypermarkets carry most low-priced kits, and Bloks Group made 90.6% of first-half 2025 revenue through offline distributors. Specialty and Brand Retail grows fastest at 12.2% a year, as LEGO and its franchise partner Ample Group opened India stores in the New Delhi area in May 2025 and in Chennai on Nov. 28, 2025.
| Segment Group | Leading Sub-segment | Share, 2025 | Fastest-growing Sub-segment | CAGR, 2026–2035 |
|---|---|---|---|---|
| By Product Type | Brick and Block Systems | 58.0% | Robotics and STEM Construction Kits | 13.6% |
| By Age Group | 5 to Under 12 Years | 50.0% | 12 Years and Above | 12.9% |
| By Application | Themed Assembly | 38.0% | Collector Display | 12.7% |
| By Distribution Channel | Mass and Department Retail | 36.0% | Specialty and Brand Retail | 12.2% |
Entry kits cost under USD 2 as collector sets top USD 900
Pricing runs in clear tiers set by brand, license, piece count and electronics. Chinese value kits sell near RMB 9.9 per blind box, micro-block and magnetic sets sit in the middle, and licensed collector sets and classroom robotics kits carry the highest tickets. Exchange rates, import duty and seasonal promotions move street prices, and India's 70% toy duty adds to imported sets. Margins are richest where a brand owns the system and its licenses, so value makers rely on volume and fast tooling while premium brands protect price through stores and themed releases.
| Offer or segment | Typical price or fee | Basis |
|---|---|---|
| Value character kit (China) | RMB 9.9 per blind box | Bloks Group interim report, first half of 2025 |
| Collector character kit (China) | RMB 100 to 200 per kit | The Bamboo Works on Bloks Group, 2026 |
| Micro-block kit (Japan) | 900 yen, nanoblock Tokyo Tower | HobbyLink Japan listing, November 2026 |
| Magnetic tile pack (Australia) | AUD 109, Connetix 42-piece square pack | My Playroom listing, November 2026 |
| Brick sets (India) | Rs 449 entry to more than Rs 80,000 | LEGO India launch, Storyboard18, May 2025 |
| Classroom coding kit | From USD 339.95, LEGO Education CS and AI | Brick Fanatics, January 2026 |
Request a Free Sample
Fill in your details and we'll send you a free sample report.
- Sample data tables & charts
- Research methodology
Learning goals, older builders and store networks lift sales
Toy-based learning gains support from schools and governments
Parents and schools in the region increasingly treat building sets as learning tools, which supports spending even where birth numbers fall. China's Ministry of Education issued guidelines in May 2025 that move artificial intelligence education from local pilots to all primary and secondary schools. India's Education Minister told the Rajya Sabha on Dec. 3, 2025, that 50,000 new Atal Tinkering Labs will be set up, on top of more than 10,000 already running. China's central government also introduced a national childcare subsidy of 3,600 yuan a year for each child under three in July 2025, freeing family budgets for learning toys. These programs favor kits that link to lessons, so Robotics and STEM Construction Kits gain value at 13.6% a year and suppliers of educational robots compete for the same school budgets.
Older children and adults broaden the building audience
The buyer base now stretches well beyond young children, which lifts average spending per set and evens out seasonal demand. Japan's toy market grew 7.9% to a record 1.1 trillion yen in fiscal 2024, according to the Japan Toy Association, with adults driving much of the gain. Single-person households without children spent 14,498 yen on toys in 2024, more than multi-person households, the South China Morning Post reported. LEGO told buyers at its first India store in May 2025 that adults use bricks for stress relief, and its sets there run up to more than Rs 80,000. As a result, 12 Years and Above grows at 12.9% a year, the fastest age group in the forecast.
Expandable construction ecosystems keep buyers coming back
Construction toys sell in families of compatible parts, so one starter set leads to add-on packs, themes and brand stores that hold buyers for years. LEGO opened 24 branded stores in the first half of 2025, reaching 1,079 stores in 54 markets, and its consumer sales rose 16% in 2025 against a 7% rise for the wider toy market, the company said on March 10, 2026. LEGOLAND Shanghai, the largest resort of its kind, opened on July 5, 2025, with more than 85 million bricks on 318,000 square meters, according to the Shanghai government, which adds the brand to the region's amusement parks. Magnetic tiles follow the same logic, since Connetix sells add-on ball runs beside its creative packs, and brand-led shelves help Specialty and Brand Retail grow at 12.2% a year.
Regional factories shorten supply to Asian shelves
Makers are adding capacity inside the region, which cuts lead times and lets them refresh themes faster for Asian buyers. LEGO inaugurated its first carbon-neutral factory in Binh Duong, Vietnam, on April 9, 2025, an investment of more than USD 1 billion that will create more than 4,000 jobs, according to the Vietnamese government news portal. The plant, the company's second in Asia, has an initial capacity of 30,000 tons a year and supports Asia Pacific growth. Bloks Group plans its first self-run factory after relying on six partner plants, The Bamboo Works reported. Local capacity helps fast-growing South Asian and Southeast Asian buyers get new themes without long import lead times.
Character kits and classroom coding reshape the category
Rise of low-priced licensed character kits
Character assembly kits at pocket-money prices are pulling new buyers into the category, especially in lower-tier Chinese cities. Bloks Group sold 48.6 million units of its blind-box value line in the first half of 2025, according to its interim report, after listing on the Hong Kong Stock Exchange on Jan. 10, 2025. The company launched 913 new products over 2025, The Bamboo Works reported, so new characters reach shelves almost weekly. This pace turns construction toys into impulse purchases at newsstands and stationers, not only planned gifts. Because licensed kits sell on characters, Themed Assembly keeps 38.0% of 2025 value, and rivals must secure strong IPs to compete.
Shift toward coding and AI in classroom building kits
Classroom kits are moving from simple motors to coding and data lessons, so each school order is worth more. LEGO Education announced a Computer Science and AI kit in January 2026 and retired its SPIKE line to make room, Brick Fanatics reported, with kits from USD 339.95 shipping in April 2026. The Australian version teaches six units, from loops to AI and data, with 1 device for every four students. These kits fit the Chinese AI guidelines of May 2025 and the Indian lab program noted above, so education distributors gain a steadier order book. Guided learning therefore grows faster than open-ended play, even though display models grow fastest of all.
Opportunity in branded retail across India
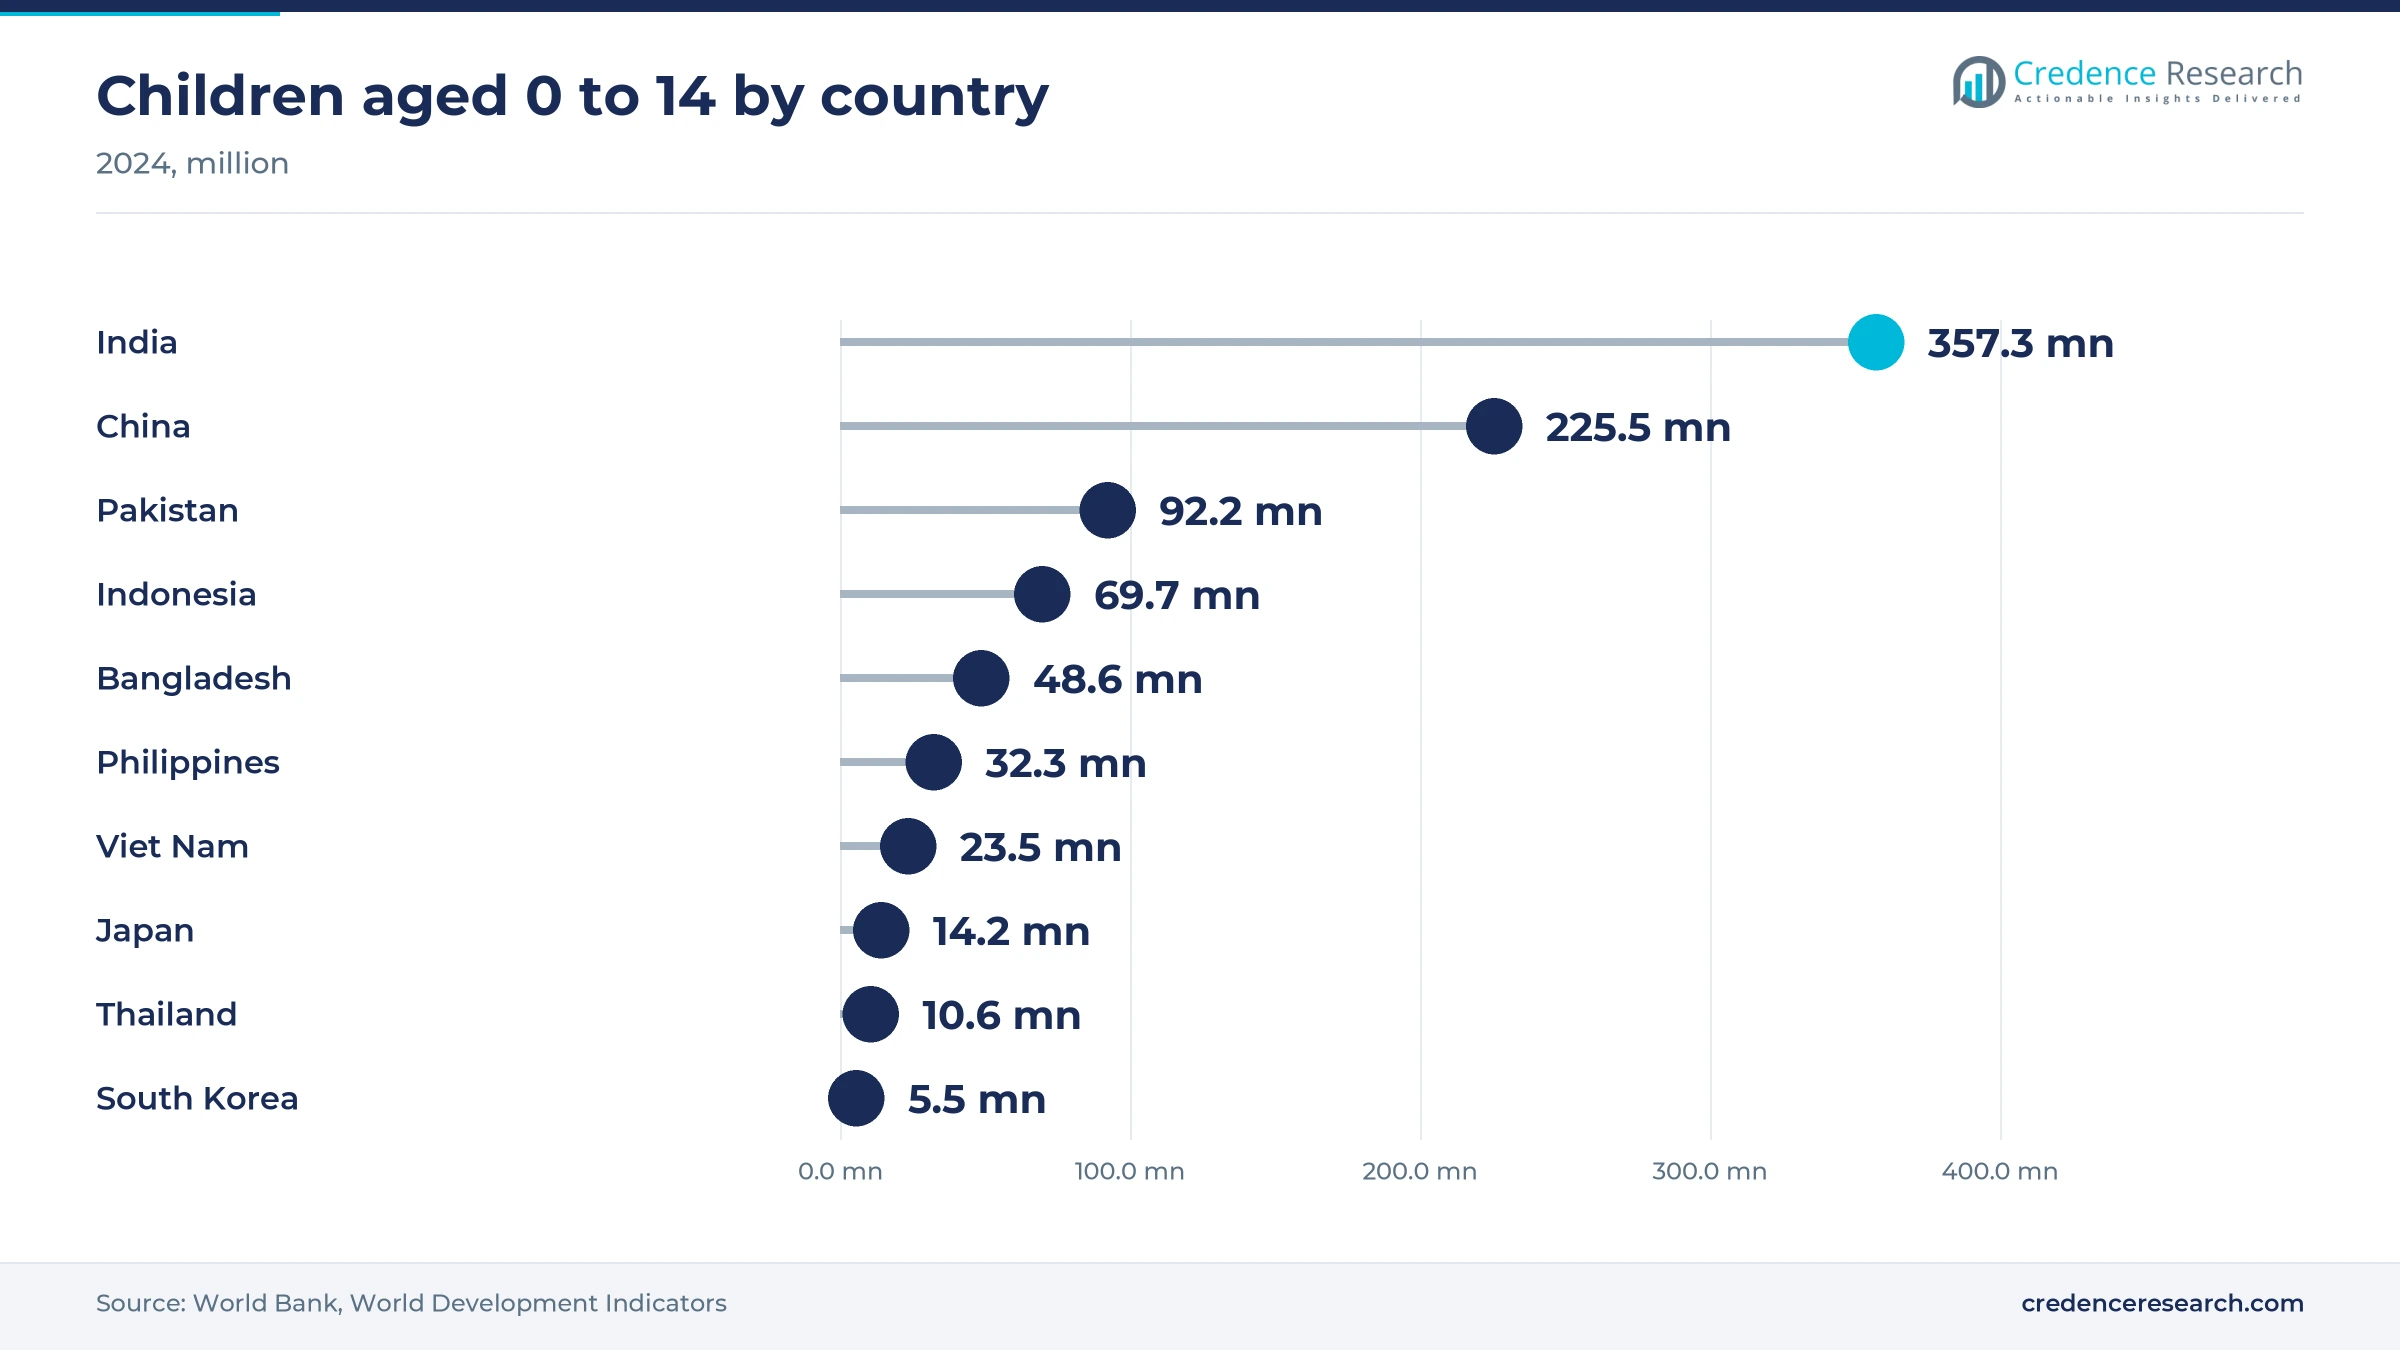
India offers the clearest white space because global brick brands arrived in physical retail only in 2025. LEGO opened its first certified store in the New Delhi area in May 2025 with franchise partner Ample Group, which targets more than 30% annual growth over five years, Storyboard18 reported. A Chennai store followed on Nov. 28, 2025, and a second Bengaluru store of about 4,393 square feet was due weeks later, according to Indian Television. India has 357.3 million children aged 0 to 14, according to the World Bank, the largest pool in the region. Suppliers that pair entry sets near Rs 449 with local distribution can grow with South Asia, the fastest subregion in the forecast.
Opportunity in magnetic tiles for preschool buyers
Magnetic tiles give suppliers a premium preschool format that parents and early learning centers buy in large sets. Connetix, an Australian brand, sells a 42-piece rainbow square pack for AUD 109 through Australian retailers such as My Playroom, and extends ranges with ball-run and pastel packs. Magformers, headquartered in South Korea, supplies classroom magnetic sets and Stick-O preschool kits for children from 18 months. Families in Australia and South Korea spend heavily per child, so magnetic construction systems take a growing slice of preschool budgets, while Brick and Block Systems hold 58.0% of value. Suppliers that pass magnet safety tests can charge well above plastic brick prices.
Copycats, magnet rules and thin value margins weigh
Copycat sets erode brand pricing
Counterfeit and copycat sets undercut licensed products and force brand owners into costly enforcement. A Shanghai court fined one company 600 million yuan for copying LEGO sets after an audit found illicit sales above 1.11 billion yuan, China Daily reported in May 2025. Two principal offenders received prison terms of nine and eight years. Such cases protect brand owners, but copies still sell online at a fraction of list prices, which caps how far premium sets can rise.
Magnet safety rules raise compliance costs
Magnetic sets face strict safety rules, and online sellers that ignore them create recalls and reputational risk for the whole format. The Australian Competition and Consumer Commission sent takedown requests to Amazon, eBay, Kogan and Fruugo on June 2, 2026 for toys and games containing small, high-powered magnets. Such magnets have been banned in construction and modeling kits since 2012, except in experimental sets for children 8 and over. Compliant brands bear testing costs, while non-compliant imports compete on price until removed.
Low-price strategies squeeze value-tier margins
The race to sell kits at very low prices raises volume but compresses margins across the value tier. Bloks Group's gross margin fell 5.8 points to 46.8% in 2025 on tooling costs and thin value-line margins, The Bamboo Works reported, while its blind-box line earned about RMB 4.4 per unit at wholesale in the first half. Smaller Chenghai makers face the same pressure with less scale, so many depend on licenses or contract work for foreign brands.
Falling births shrink the youngest buyer pools
Lower birth numbers in East Asia reduce the base of preschool and primary-age buyers. Japan recorded 671,236 births in 2025, a record low and 14,937 fewer than in 2024, with a fertility rate of 1.14, according to the health ministry via Jiji Press. The decline weighs most on under-3 and preschool sets, while buyers aged 12 and above are far less exposed to it. Suppliers respond by raising piece counts, adding adult themes and selling more per child.
China holds half of value as South Asia grows fastest
| Country | Value, 2025 (USD billion) | Share, 2025 | CAGR, 2026–2035 |
|---|---|---|---|
| China | 1.99 | 50.8% | 11.1% |
| Japan, South Korea and Other East Asia | 0.79 | 20.1% | 9.8% |
| Southeast Asia and Oceania | 0.64 | 16.4% | 12.3% |
| South Asia | 0.50 | 12.7% | 13.4% |
China leads on scale and domestic challengers
China held 50.8% of 2025 value and grows at 11.1% a year, close to the regional rate. It has about 225 million children aged 0 to 14, according to the World Bank, and LEGO sold China-specific themes such as Monkie Kid through more than 400 certified stores in over 120 cities by September 2025, China Daily reported. Domestic brands add depth, since Bloks Group, Double Eagle in Chenghai and wooden toy maker Hape in Ningbo all build for local and export buyers. Competition is therefore sharper here than in any other part of the region.
Japan, South Korea and other East Asia rely on adult hobby demand
Japan, South Korea and other East Asia held 20.1% of 2025 value but grow at only 9.8% a year, the slowest rate in the region. Bandai Namco's Gunpla kits and Kawada's nanoblock micro-builds sell mainly to adult hobbyists, and Ravensburger demonstrated its GraviTrax marble run at the Tokyo Toy Show 2026 with a starter set priced at 8,800 yen. Adult hobbyists and gift buyers keep prices high even as child numbers fall.
Southeast Asia and Oceania mix young families and premium buyers
Southeast Asia and Oceania held 16.4% of 2025 value and grow at 12.3% a year. Indonesia, with 69.7 million children aged 0 to 14 in 2024, was the top non-China Asian market for Bloks Group, while the Philippines and Viet Nam add 32.3 million and 23.5 million, according to the World Bank. Australia is a premium market for magnetic tiles and brick sets, and Vietnam now hosts LEGO molding capacity close to these buyers.
South Asia grows fastest from a low base
South Asia held 12.7% of 2025 value but grows fastest at 13.4% a year. India had 357.3 million children aged 0 to 14 in 2024 and Pakistan 92.2 million, according to World Bank population data, so the child base is the largest in the region. India raised basic customs duty on toys to 70% in March 2023 and has enforced a toy quality control order since Jan. 1, 2021, which cut toy imports 52% between fiscal 2015 and fiscal 2023, Governance Now reported. Brands that assemble or certify their sets locally therefore gain the most.
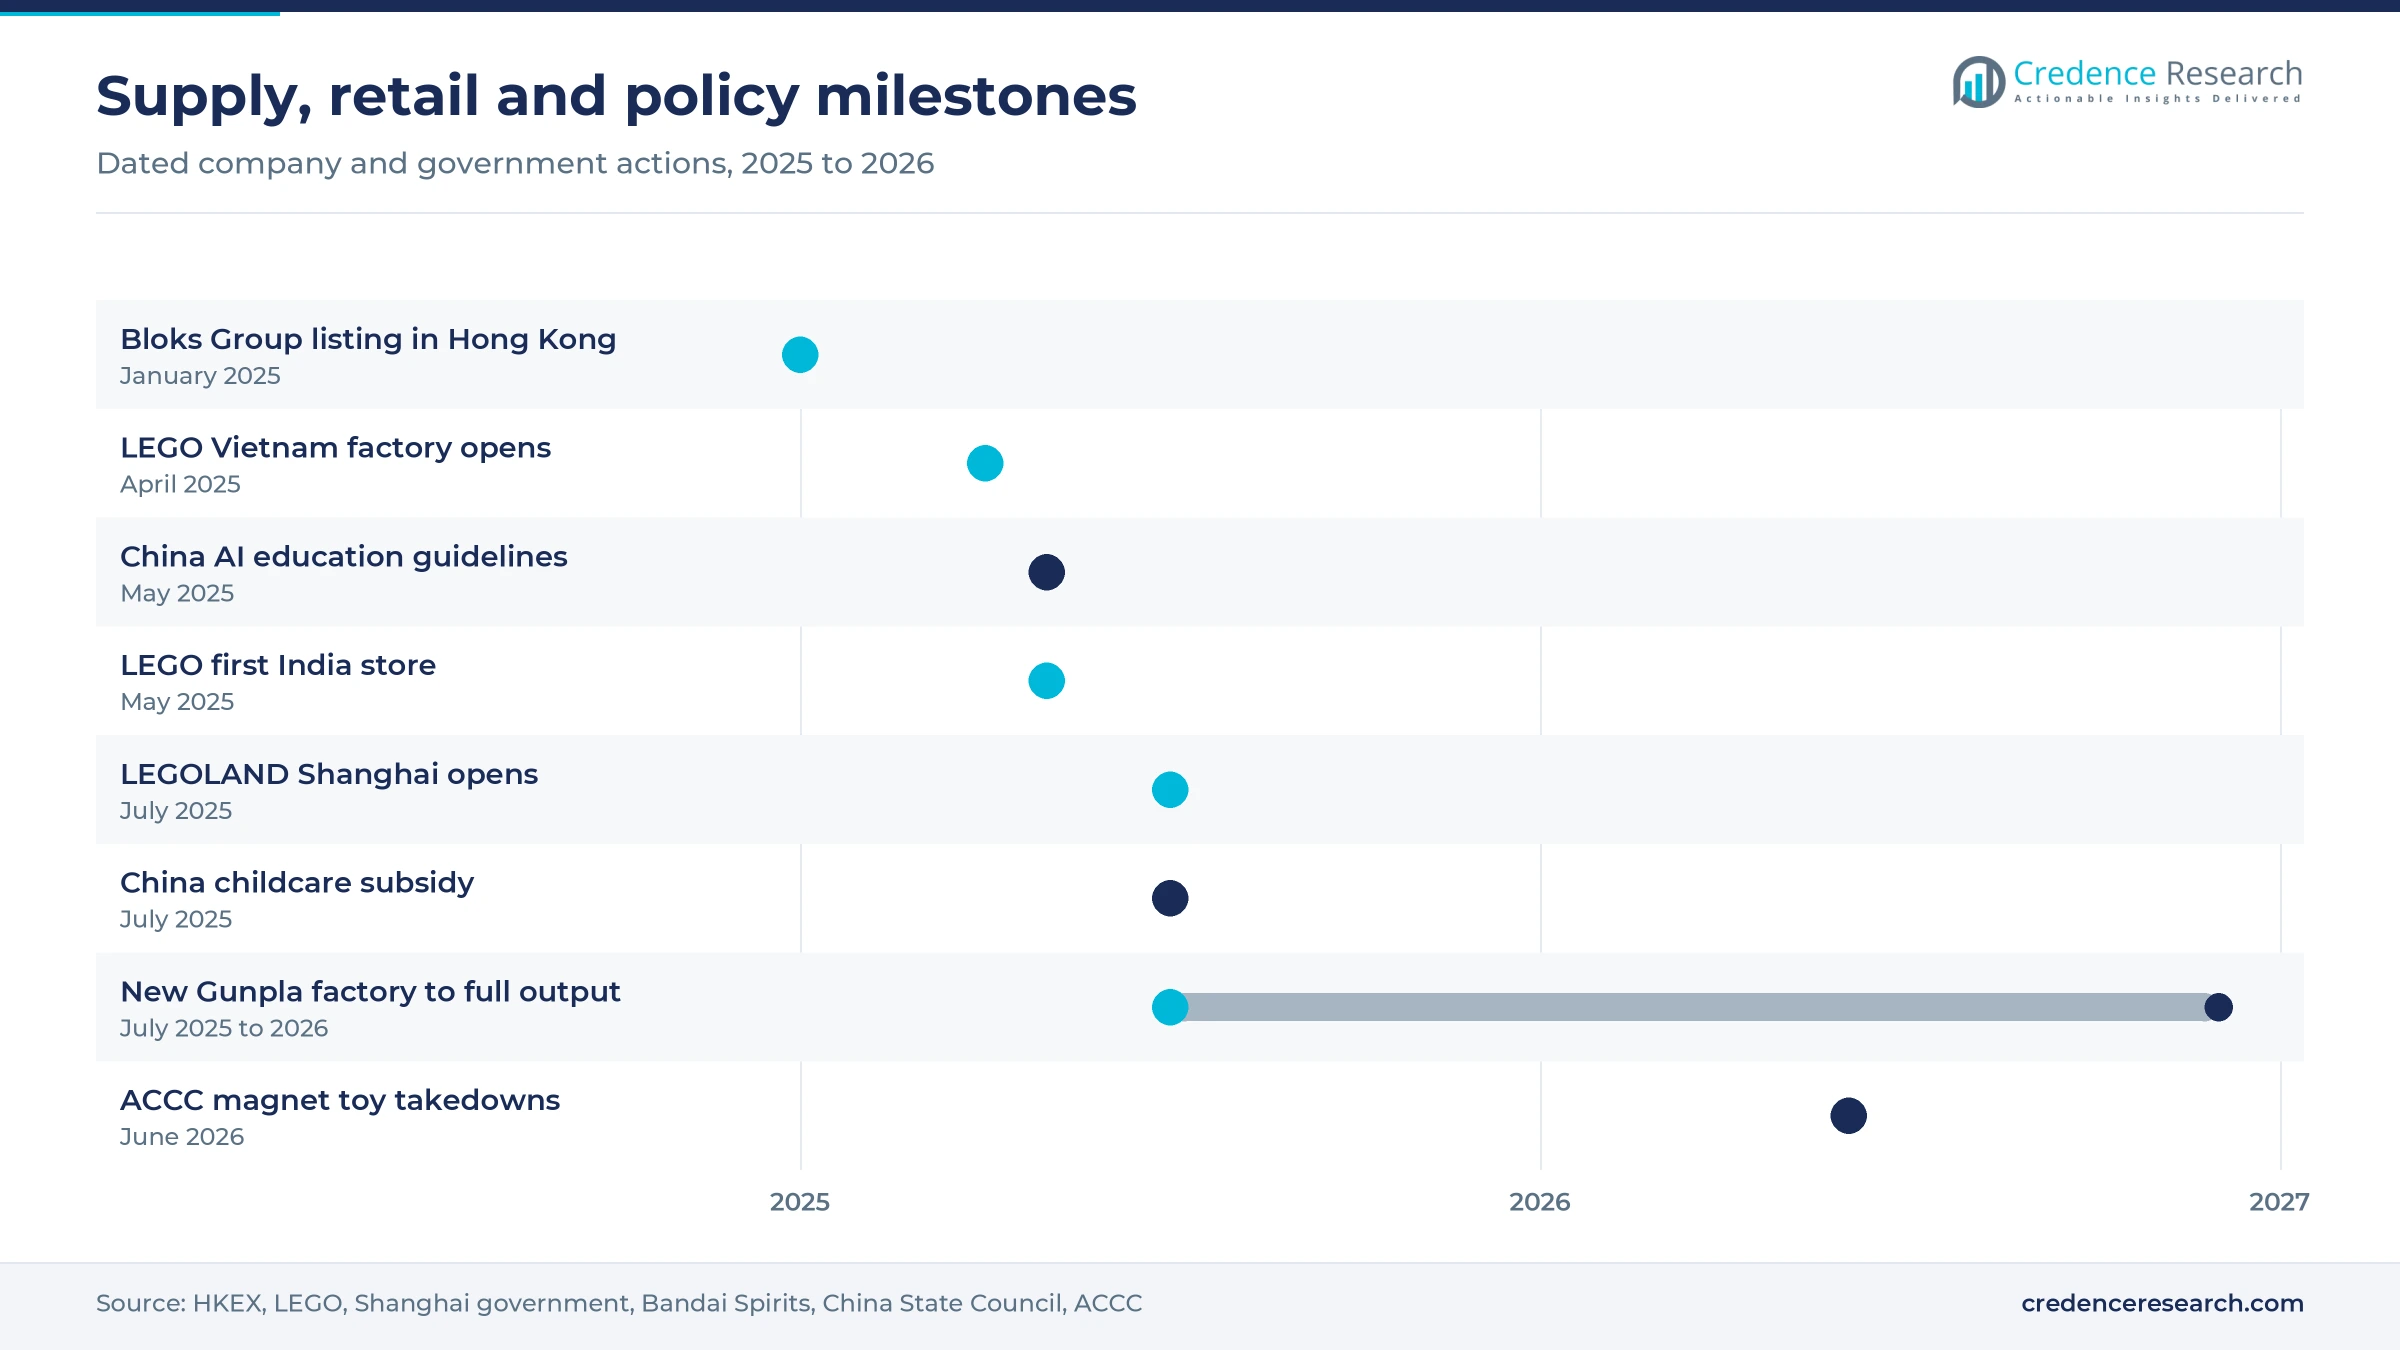
New plants, listings and stores mark 2025 and 2026
| Development | Status and market relevance |
|---|---|
| In January 2025, Bloks Group listed on the Main Board of the Hong Kong Stock Exchange, on Jan. 10. | Completed; funds licensed kit expansion and overseas sales |
| In April 2025, LEGO inaugurated a carbon-neutral factory in Binh Duong, Vietnam, its second plant in Asia. | Operating; initial capacity of 30,000 tons a year |
| In July 2025, LEGOLAND Shanghai opened on July 5 in Jinshan district with more than 85 million bricks. | Open; largest LEGOLAND resort worldwide |
| In July 2025, Bandai Hobby Center began operations at a new Gunpla factory in Shizuoka on July 24. | Operating; full-scale output due in 2026 |
| In November 2025, LEGO and Ample Group opened a certified store in Chennai on Nov. 28. | Open; extends LEGO retail to Tamil Nadu after the New Delhi area and Bengaluru |
Clutch molds, magnets and code set the product tiers
- Precision clutch molding keeps bricks from different years compatible, which protects add-on sales and requires costly steel tools.
- Enclosed magnet design seals high-powered magnets inside tiles and sticks so that sets pass Australian and other toy safety tests.
- Coding hubs and sensors let learners program motors and color sensors from a tablet, which links kits to school curricula.
- Recycled and renewable resins now make up 52% of LEGO purchased brick materials, up from 33% in 2024, according to the company.
Need a Custom Version of This Report?
Tailor the scope, geography, or segments to your exact requirements.
- Custom geography or segment scope
- Direct access to our analyst team
A global brick leader faces fast Chinese challengers
Competition turns on licenses, compatibility and shelf presence rather than on raw material cost. LEGO Group leads with proprietary systems, its own factories in China and Vietnam and a growing store network from Shanghai to Chennai. Bloks Group challenges it in China with licensed character kits at much lower prices and is expanding into Indonesia. Bandai Namco and Kawada serve display and micro-build hobbyists from Japan, while Mattel competes with MEGA and Mattel Brick Shop sets. Hape and Double Eagle Group combine their own brands with export manufacturing, and Magformers and Connetix lead magnetic tiles for preschool buyers. Ravensburger adds marble-run construction through GraviTrax, which grew 10% in 2025. Smaller rivals win on price, while leaders defend share through new themes, store experiences and school programs.
How is supply organized between the global leader and local makers?
Supply in the regional market is concentrated at the top and fragmented below. LEGO sets the premium benchmark through its own molding plants in China and Vietnam, branded stores and long-running themes, while Bandai Namco dominates display model kits in Japan. A second tier of Chinese brands, led by Bloks Group, competes on licensed characters and low prices, often with outsourced molding. Hundreds of Chenghai and Ningbo factories make generic or contract sets. Barriers lie in precision tooling, licenses and shelf access rather than raw materials such as acrylonitrile butadiene styrene, and margins sit with system owners.
Leading suppliers in the regional market
| Company | Type | Role in the market |
|---|---|---|
| LEGO Group | Global system owner | Brick sets, LEGO Education kits and branded stores across the region |
| Bloks Group Limited | Chinese brand | Licensed character assembly kits sold mainly through offline distributors in China |
| Bandai Namco Holdings | Japanese hobby leader | Gunpla plastic model kits made at Bandai Hobby Center in Shizuoka |
| Mattel | Global toy company | MEGA and Mattel Brick Shop building sets for children and collectors |
| Hape | Wooden toy maker | Wooden blocks and building toys produced in Ningbo for local and export buyers |
| Kawada | Japanese specialist | Nanoblock micro-building kits, including licensed characters and landmarks |
| Magformers | Korean specialist | Magnetic construction sets and Stick-O kits for preschool and classroom use |
| Connetix | Australian specialist | Magnetic tiles, ball runs and expansion packs sold through Australian retailers |
| Double Eagle Group | Chinese manufacturer | CaDA brick sets and licensed vehicle builds from Chenghai plants |
| Ravensburger | Global games maker | GraviTrax marble-run construction systems, including a Japanese starter set |
Licensed value kits and school programs will win
Credence Research's view is that the strongest growth will go to suppliers that serve two very different buyers well. The first is the price-sensitive family in lower-tier Chinese, Indian and Indonesian cities, reached through licensed value kits and wide distribution. The second is the older builder or school that pays for display models, compatible systems and coding kits. Brands stuck between these poles, with generic designs and no license or curriculum link, face the sharpest margin pressure. Branded retail in India began only in May 2025, so the market there still has few certified stores outside the largest metro areas. Import rules there also favor local assembly and certified supply.
Company filings, store counts and child populations
The report uses 2025 as the base year and forecasts to 2035 from the Credence Research market model. Country and segment splits are Credence Research estimates built from company filings and releases, store counts, published list prices, government policy documents and World Bank child population data. Values are cross-checked against bottom-up estimates of brand sales by subregion. No interviews or surveys were used, and only the source types listed here informed the estimates.
Older buyers and India shape growth through 2035
The market should more than double by 2035 as older builders, schools and newly reached Indian families add spending. China will stay the largest market, but its share drifts lower as South Asia and Southeast Asia grow faster from a smaller base. South Asia should lift its share of regional demand in each year through 2035 as Indian stores and school labs multiply. Robotics and coding kits and display models gain share at the expense of simple stacking sets. Supply will move further into the region through plants in Vietnam, China and Japan, which shortens lead times. Licenses, safety compliance and store reach will decide which brands capture that growth.
How wide is the range of outcomes to 2035?
The spread between cases depends on how far older buyers keep spending on display sets and how quickly India and Southeast Asia adopt branded construction toys. A weak Chinese consumer, tougher copycat competition or a sharp drop in births would push results toward the downside. Faster school adoption of coding kits, more brand stores in Indian cities and strong licensed releases would lift results toward the upside.
| Scenario | CAGR, 2026–2035 | Value, 2035 | What has to hold |
|---|---|---|---|
| Downside | 9.4% | USD 9.78 billion | Chinese spending stalls and value-tier price wars spread across the region |
| Base | 11.37% | USD 11.52 billion | Licensed releases, store openings and school programs continue at the current pace |
| Upside | 13.2% | USD 13.31 billion | India retail scales quickly and classroom coding kits reach most urban schools |
Frequently Asked Questions
How big is the Asia Pacific construction toys market?
Which country leads the regional market?
Which subregion grows fastest?
Which product type holds the largest share?
Why are older buyers important for this market?
What do construction toys cost in the region?
What are the main challenges for suppliers?
Who are the leading companies in the market?
Table of Content
Chapter 1 Market Segmentation
- 1.1 Segmentation Framework
- 1.1.1 Product and Service Classification
- 1.1.2 Application and End-Use Classification
- 1.1.3 Technology and Solution Classification
- 1.1.4 Customer and Distribution Channel Classification
- 1.1.5 Geographic Segmentation
- 1.1.6 Market Segment Definitions and Boundaries
- 1.2 By Product Type
- 1.2.1 Brick and Block Systems
- 1.2.2 Magnetic Construction Systems
- 1.2.3 Mechanical and Stacking Construction Systems
- 1.2.4 Robotics and STEM Construction Kits
- 1.3 By Age Group
- 1.3.1 Under 3 Years
- 1.3.2 3 to Under 5 Years
- 1.3.3 5 to Under 12 Years
- 1.3.4 12 Years and Above
- 1.4 By Application
- 1.4.1 Open-Ended Play
- 1.4.2 Guided Learning
- 1.4.3 Themed Assembly
- 1.4.4 Collector Display
- 1.5 By Country
- 1.5.1 China
- 1.5.2 South Asia
- 1.5.3 Japan, South Korea and Other East Asia
- 1.5.4 Southeast Asia and Oceania
Chapter 2 Introduction
- 2.1 Report Objectives and Scope
- 2.2 Product Definition and Industry Terminology
- 2.3 Market Inclusions and Exclusions
- 2.4 Research Process
- 2.4.1 Primary Research and Expert Interviews
- 2.4.2 Secondary Research and Source Review
- 2.4.3 Top-Down and Bottom-Up Estimation
- 2.4.4 Data Triangulation and Verification
- 2.5 Market Size Measurement Basis
- 2.5.1 2025: USD 3.92 billion → 2035: USD 11.52 billion
- 2.6 Historical and Forecast Reference Periods
- 2.6.1 Historical Period: 2018-2025
- 2.6.2 Base Year: 2025
- 2.6.3 Forecast Period: 2025-2035
- 2.7 Research Assumptions and Limitations
Chapter 3 Executive Summary
- 3.1 Market Snapshot and Key Findings
- 3.2 Base-Year Market Size, 2025
- 3.3 Forecast Market Size, 2035
- 3.4 Revenue and Volume Growth Outlook
- 3.5 Key Demand and Supply Indicators
- 3.6 Leading Market Segments
- 3.7 Fastest-Growing Market Opportunities
- 3.8 Regional Performance Highlights
- 3.9 Technology and Industry Transformation
- 3.10 Competitive Landscape Summary
- 3.11 Analyst View and Strategic Implications
Chapter 4 Asia Pacific Construction Toys Market Trends and Developments
- 4.1 Historical Industry Development, 2018-2025
- 4.2 Recent Market Trends and Developments
- 4.3 Demand and Customer Behavior Trends
- 4.4 Technology and Product Innovation
- 4.5 Artificial Intelligence, Automation and Digitalization
- 4.6 Local Manufacturing and Supply Chain Realignment
- 4.7 Industry Partnerships, Mergers and Acquisitions
- 4.8 Sustainability and Circular Economy Developments
- 4.9 Government and Private Sector Investment Trends
- 4.10 Emerging Business Models and Commercialization
- 4.11 Industry Developments and Announcements
Chapter 5 Asia Pacific Construction Toys Market Production, Supply and Demand Analysis
- 5.1 Demand Trend and Consumption Analysis, 2018-2025
- 5.2 Demand Forecast, 2025-2035
- 5.3 Production and Output Trend, 2018-2025
- 5.4 Production and Output Forecast, 2025-2035
- 5.5 Installed Capacity and Capacity Utilization
- 5.6 Company-Wise Production Plants and Statistics
- 5.6.1 Installed Production Capacity
- 5.6.2 Actual Production
- 5.6.3 Planned Capacity and Expansion Targets
- 5.7 Supply Chain Structure and Procurement Trends
- 5.8 Supply-Demand Gap and Bottlenecks
- 5.9 Import Dependence and Sourcing Structure
- 5.10 Contract Manufacturing and Outsourcing
- 5.11 Regional Supply and Demand Concentration
Chapter 6 Asia Pacific Construction Toys Market Pricing Analysis
- 6.1 Pricing Structure and Measurement
- 6.2 Historical Pricing Trends, 2018-2025
- 6.3 Pricing Outlook, 2025-2035
- 6.4 Average Selling Price and Unit Economics
- 6.5 Pricing by Product and Market Segment
- 6.6 Geographic Pricing Differences
- 6.7 Key Input, Energy, Labor and Logistics Costs
- 6.8 Contract Pricing and Purchasing Models
- 6.9 Pricing Sensitivity and Competitive Positioning
- 6.10 Price, Margin and Profitability Implications
Chapter 7 Asia Pacific Construction Toys Market Dynamics
- 7.1 Market Growth Drivers
- 7.1.1 Demand-Side Drivers
- 7.1.2 Technology and Innovation Drivers
- 7.1.3 Infrastructure and Investment Drivers
- 7.1.4 Regulatory and Policy Drivers
- 7.2 Market Restraints
- 7.2.1 Cost and Affordability Constraints
- 7.2.2 Technology and Adoption Barriers
- 7.2.3 Supply Chain and Operational Constraints
- 7.3 Market Challenges
- 7.3.1 Competitive Pressure and Margin Erosion
- 7.3.2 Skills, Infrastructure and Implementation Gaps
- 7.4 Emerging Market Opportunities
- 7.5 Market Dynamics Impact and Time-Horizon Assessment
Chapter 8 Asia Pacific Construction Toys Value Chain Analysis
- 8.1 Industry Value Chain Overview
- 8.2 Upstream Suppliers and Critical Inputs
- 8.3 Technology and Component Providers
- 8.4 Manufacturing or Service Delivery
- 8.5 Distribution, Channel Partners and Integrators
- 8.6 Downstream Applications and End Users
- 8.7 Value Addition and Profit Pools
- 8.8 Vertical Integration and Outsourcing
- 8.9 Supplier Concentration and Risk
- 8.10 Supply Chain Localization and Resilience
Chapter 9 Asia Pacific Construction Toys Market Regulations and Policies
- 9.1 Relevant Laws, Standards and Compliance Frameworks
- 9.2 Product, Service, Safety and Quality Requirements
- 9.3 Government Policies, Incentives and Subsidies
- 9.4 Imports, Exports and Trade Barriers
- 9.5 Public Procurement and Local Content Requirements
- 9.6 Environmental and Sustainability Compliance
- 9.7 Upcoming Policy Changes and Market Implications
Chapter 10 Asia Pacific Construction Toys Market Hotspots and Opportunities
- 10.1 Market Opportunity Mapping and Growth Hotspots
- 10.2 High-Growth Applications and Customer Groups
- 10.3 Underserved Markets and White-Space Opportunities
- 10.4 Emerging Technology and Product Opportunities
- 10.5 New Capacity and Investment Hotspots
- 10.6 Market Entry and Expansion Opportunities
- 10.7 Distribution and Partnership Opportunities
- 10.8 Near-Term and Long-Term Commercial Potential
- 10.9 Opportunity Attractiveness and Execution Risks
Chapter 11 Asia Pacific Construction Toys Market Outlook, 2025-2035
- 11.1 Market Size and Analysis
- 11.1.1 Revenue (Market Measurement: 2025: USD 3.92 billion → 2035: USD 11.52 billion)
- 11.1.2 Market Volume and Quantity Sold
- 11.1.3 Historical Market Size, 2018-2025
- 11.1.4 Base-Year Market Size, 2025
- 11.2 Market Forecast, 2025-2035
- 11.2.1 Revenue Forecast to 2035
- 11.2.2 Volume Forecast to 2035
- 11.2.3 CAGR and Year-on-Year Growth
- 11.2.4 Incremental Revenue Opportunity
- 11.3 Forecast Assumptions and Scenario Analysis
- 11.3.1 Base-Case Forecast
- 11.3.2 Optimistic and Conservative Scenarios
- 11.3.3 Technology, Pricing and Policy Sensitivities
- 11.4 Market Attractiveness and Growth Outlook
Chapter 12 Asia Pacific Construction Toys Market Segmentation and Outlook
- 12.1 Segmentation Summary and Market Shares, 2025
- 12.2 Largest and Fastest-Growing Segments
- 12.3 By Product Type - Market Size and Forecast, 2025-2035
- 12.3.1 Segment Definition and Scope
- 12.3.2 Historical Market Size, 2018-2025
- 12.3.3 Revenue Forecast, 2025-2035
- 12.3.4 Volume Forecast, 2025-2035
- 12.3.5 Base-Year Market Share, 2025
- 12.3.6 Segment CAGR and Growth Drivers
- 12.3.7 Subsegment Market Size and Forecast
- 12.3.7.1 Brick and Block Systems
- 12.3.7.2 Magnetic Construction Systems
- 12.3.7.3 Mechanical and Stacking Construction Systems
- 12.3.7.4 Robotics and STEM Construction Kits
- 12.3.8 Subsegment Pricing and Adoption Trends
- 12.3.9 Leading Suppliers and Competition
- 12.3.10 Regional Demand and Opportunities
- 12.4 By Age Group - Market Size and Forecast, 2025-2035
- 12.4.1 Segment Definition and Scope
- 12.4.2 Historical Market Size, 2018-2025
- 12.4.3 Revenue Forecast, 2025-2035
- 12.4.4 Volume Forecast, 2025-2035
- 12.4.5 Base-Year Market Share, 2025
- 12.4.6 Segment CAGR and Growth Drivers
- 12.4.7 Subsegment Market Size and Forecast
- 12.4.7.1 Under 3 Years
- 12.4.7.2 3 to Under 5 Years
- 12.4.7.3 5 to Under 12 Years
- 12.4.7.4 12 Years and Above
- 12.4.8 Subsegment Pricing and Adoption Trends
- 12.4.9 Leading Suppliers and Competition
- 12.4.10 Regional Demand and Opportunities
- 12.5 By Application - Market Size and Forecast, 2025-2035
- 12.5.1 Segment Definition and Scope
- 12.5.2 Historical Market Size, 2018-2025
- 12.5.3 Revenue Forecast, 2025-2035
- 12.5.4 Volume Forecast, 2025-2035
- 12.5.5 Base-Year Market Share, 2025
- 12.5.6 Segment CAGR and Growth Drivers
- 12.5.7 Subsegment Market Size and Forecast
- 12.5.7.1 Open-Ended Play
- 12.5.7.2 Guided Learning
- 12.5.7.3 Themed Assembly
- 12.5.7.4 Collector Display
- 12.5.8 Subsegment Pricing and Adoption Trends
- 12.5.9 Leading Suppliers and Competition
- 12.5.10 Regional Demand and Opportunities
- 12.6 By Country - Market Size and Forecast, 2025-2035
- 12.6.1 Segment Definition and Scope
- 12.6.2 Historical Market Size, 2018-2025
- 12.6.3 Revenue Forecast, 2025-2035
- 12.6.4 Volume Forecast, 2025-2035
- 12.6.5 Base-Year Market Share, 2025
- 12.6.6 Segment CAGR and Growth Drivers
- 12.6.7 Subsegment Market Size and Forecast
- 12.6.7.1 China
- 12.6.7.2 South Asia
- 12.6.7.3 Japan, South Korea and Other East Asia
- 12.6.7.4 Southeast Asia and Oceania
- 12.6.8 Subsegment Pricing and Adoption Trends
- 12.6.9 Leading Suppliers and Competition
- 12.6.10 Regional Demand and Opportunities
- 12.7 Segment Growth Comparison
- 12.8 Segment Attractiveness and Priority Matrix
Chapter 13 Asia Pacific Construction Toys End-Use and Application Market Outlook
- 13.1 End-Use Industry and Customer Demand Structure
- 13.2 Leading Applications and Customer Groups
- 13.3 End-Use Market Size, Share and Forecast
- 13.4 Major End-Use Industry Deep Dives
- 13.4.1 Customer Requirements and Use Cases
- 13.4.2 Demand and Replacement Cycles
- 13.4.3 Technical and Regulatory Considerations
- 13.4.4 Purchasing and Procurement Models
- 13.4.5 Leading Vendors and Distribution Channels
- 13.4.6 Forecast and Commercial Opportunities
- 13.5 Emerging Applications and Cross-Segment Demand
- 13.6 End-Use Industry Investment Priorities
Chapter 14 Asia Pacific Construction Toys Geographic Market Outlook, 2025-2035
- 14.1 Regional Market Size and Country-Level Shares, 2025
- 14.2 Country Market Size Comparison, 2025
- 14.3 Country Market Forecasts, 2025-2035
- 14.4 Subregional Industrial and Demand Clusters
- 14.5 Intra-Regional Pricing and Cost Differences
- 14.6 Cross-Border Trade and Supply Networks
- 14.7 Regional Supply and Demand Balances
- 14.8 Country Opportunity Comparison and Prioritization
Note: Every listed country is covered on the structure shown under the first country.
Chapter 15 Asia Pacific Construction Toys Technology, Innovation and Sustainability Outlook
- 15.1 Technology Landscape and Maturity
- 15.2 Product, Process and Service Innovation
- 15.3 AI, Automation and Digital Tools in the Industry
- 15.4 Technology Adoption and Performance Benchmarking
- 15.5 Innovation Pipeline and R&D Investment
- 15.6 Patent and Intellectual Property Trends
- 15.7 Energy Efficiency and Resource Management
- 15.8 Sustainability, Recycling and Circularity
- 15.9 Technology Roadmap, 2025-2035
- 15.10 Risks of Obsolescence and Technology Substitution
Chapter 16 Asia Pacific Construction Toys Market Key Strategic Imperatives
- 16.1 Growth and Market Entry Priorities
- 16.2 High-Return Products and Segments
- 16.3 Pricing, Profitability and Cost Optimization
- 16.4 Technology Investment and Product Differentiation
- 16.5 Supply Chain Localization and Resilience
- 16.6 Distribution and Customer Acquisition
- 16.7 Partnership, Acquisition and Capacity Strategy
- 16.8 Regional Expansion Priorities
- 16.9 Short-, Medium- and Long-Term Actions
Chapter 17 Competition Outlook
- 17.1 Industry Competition Characteristics
- 17.2 Market Structure and Concentration
- 17.3 Market Share and Competitive Positioning, 2025
- 17.4 Company-Wise Revenue and Product Benchmarking
- 17.5 Production and Service Capacity Benchmarking
- 17.6 Technology, Pricing and Differentiation
- 17.7 Regional Footprint and Distribution Strength
- 17.8 Mergers, Acquisitions and Strategic Alliances
- 17.9 New Entrants and Competitive Threats
- 17.10 Porter's Five Forces and Industry Attractiveness
- 17.11 Competitive Outlook, 2025-2035
Chapter 18 Company Profiles
- 18.1 Company Coverage and Selection Criteria
- 18.2 LEGO Group
- 18.2.1 Business Description
- 18.2.2 Company Ownership and Geographic Presence
- 18.2.3 Product and Service Portfolio
- 18.2.4 Manufacturing and Operating Footprint
- 18.2.5 Production Capacity and Expansion Plans
- 18.2.6 Financial Performance and Investment
- 18.2.7 Market Share and Competitive Position
- 18.2.8 Technology and Innovation Capabilities
- 18.2.9 Strategic Alliances or Partnerships
- 18.2.10 Recent Developments
- 18.2.11 Growth Strategy and Outlook
- 18.3 Bloks Group Limited
- 18.4 Bandai Namco Holdings
- 18.5 Mattel
- 18.6 Hape
- 18.7 Kawada
- 18.8 Magformers
- 18.9 Connetix
- 18.10 Double Eagle Group
- 18.11 Ravensburger
- 18.12 Other Relevant Market Participants
Note: Every listed company is profiled on the structure shown under the first company. The company list is preliminary and may change based on research findings, market developments, data availability and client requirements.
Chapter 19 Disclaimer
- 19.1 Research and Forecast Disclaimer
- 19.2 Data Source and Estimation Limitations
Note: The depth of individual sections depends on data availability for this market. Volume, capacity, trade and other unit-based metrics are included where applicable.