Asia Pacific contactless payments shift from QR to tap
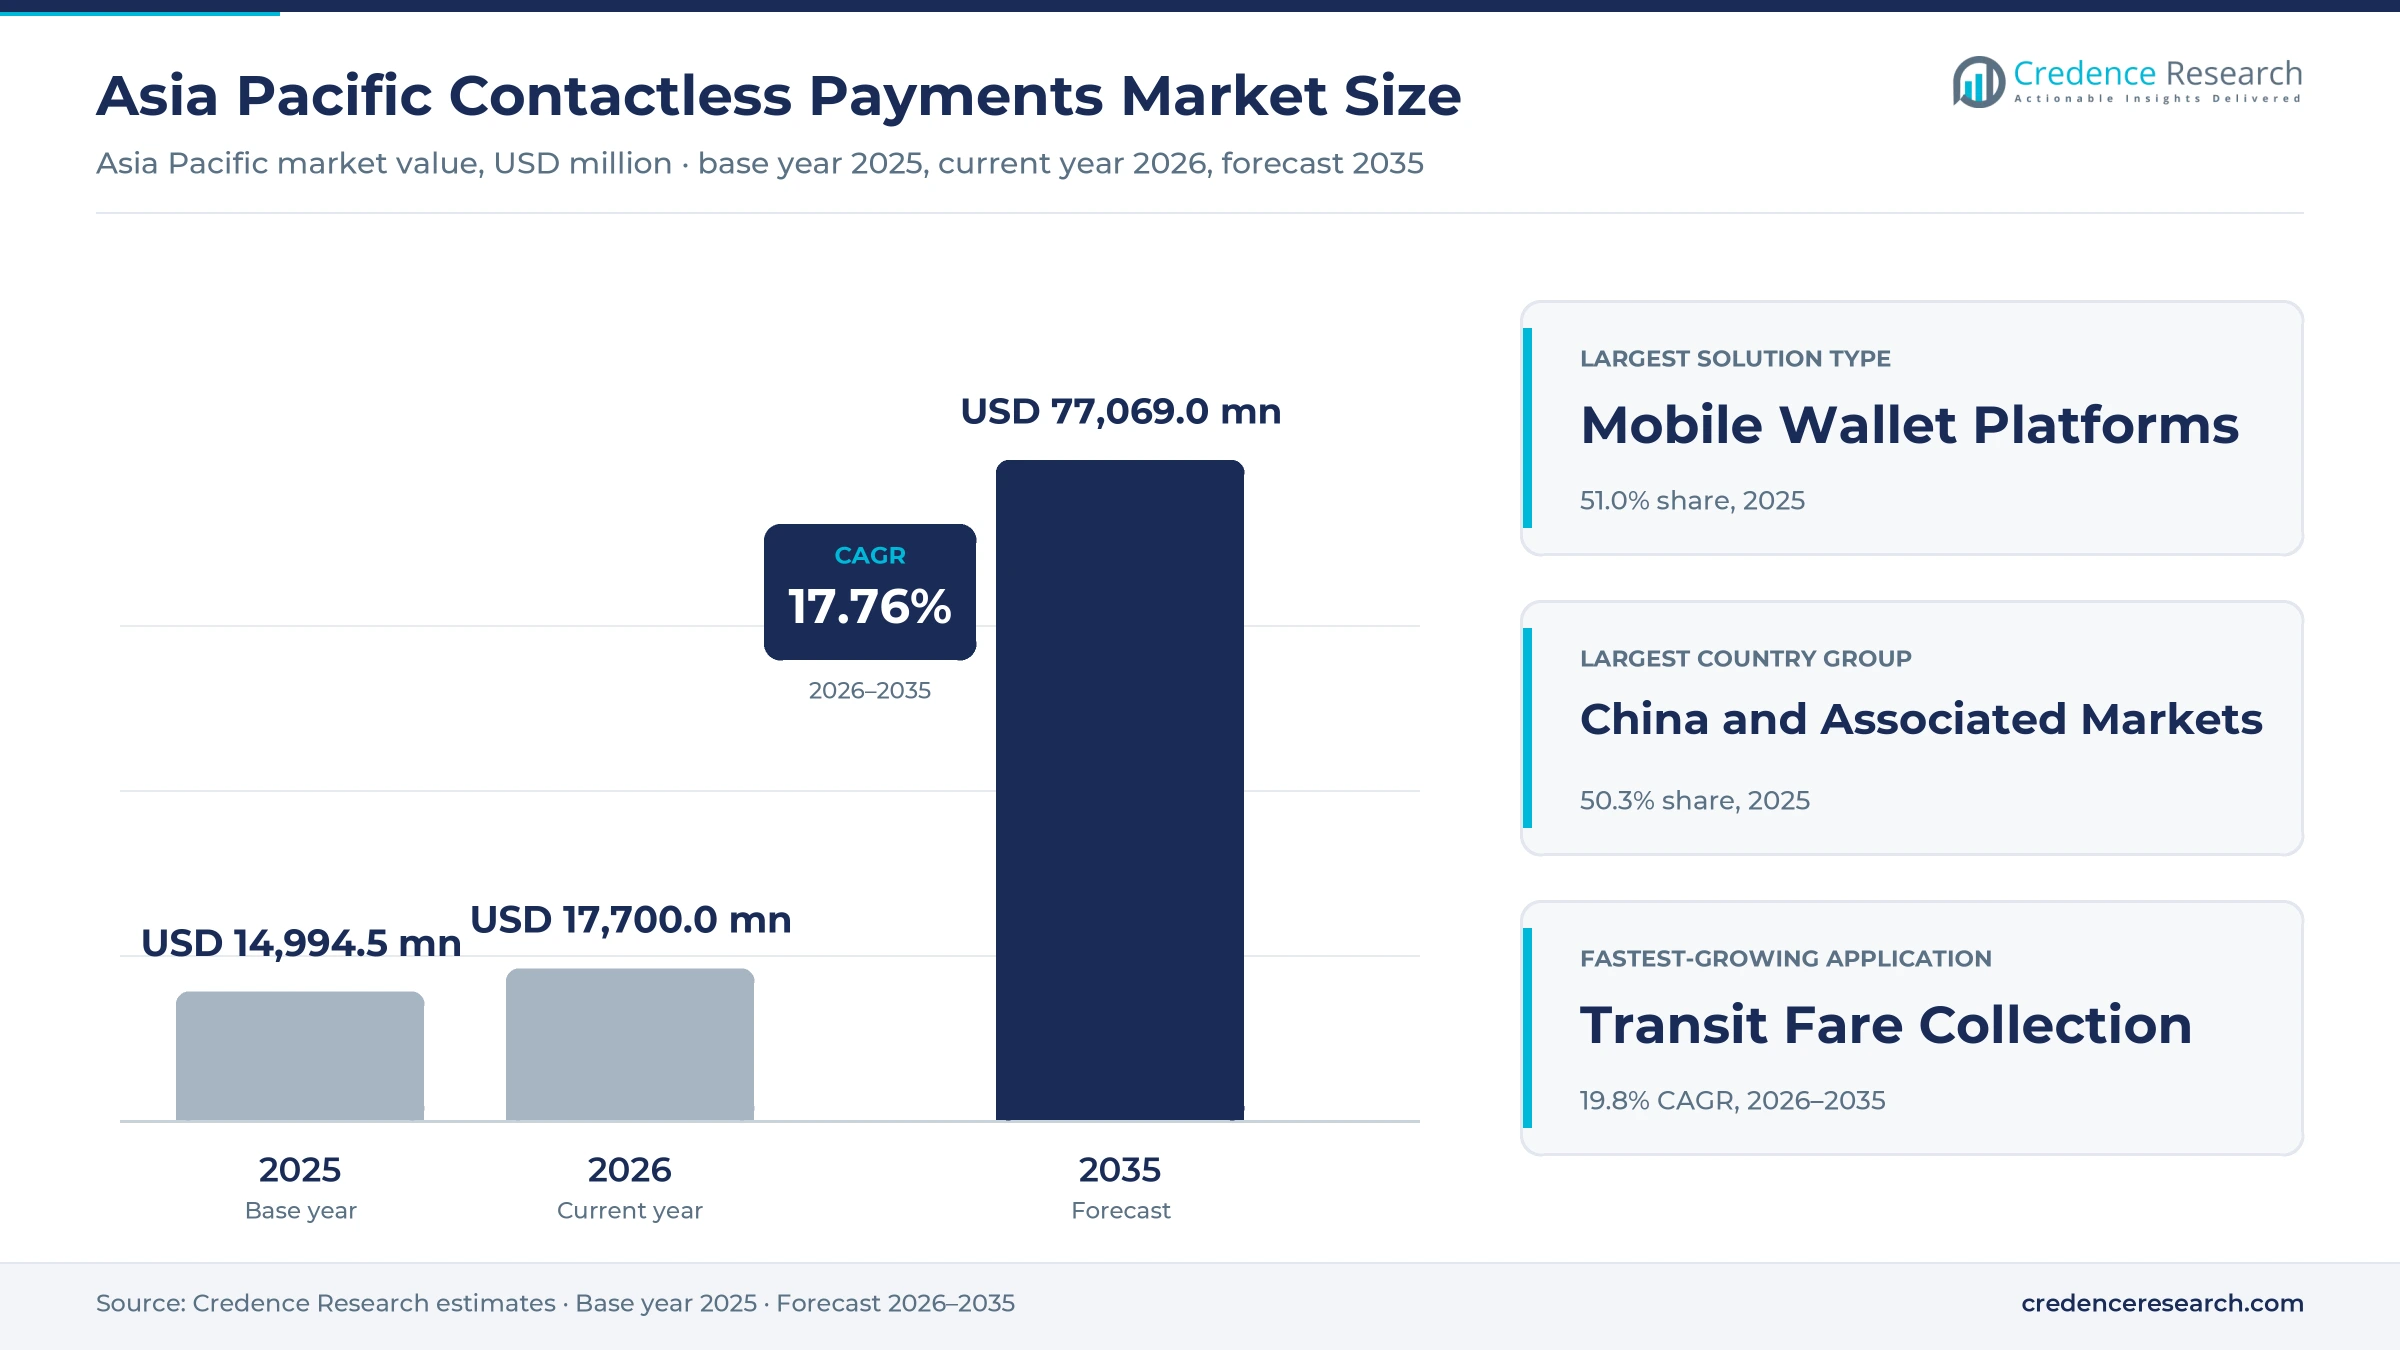
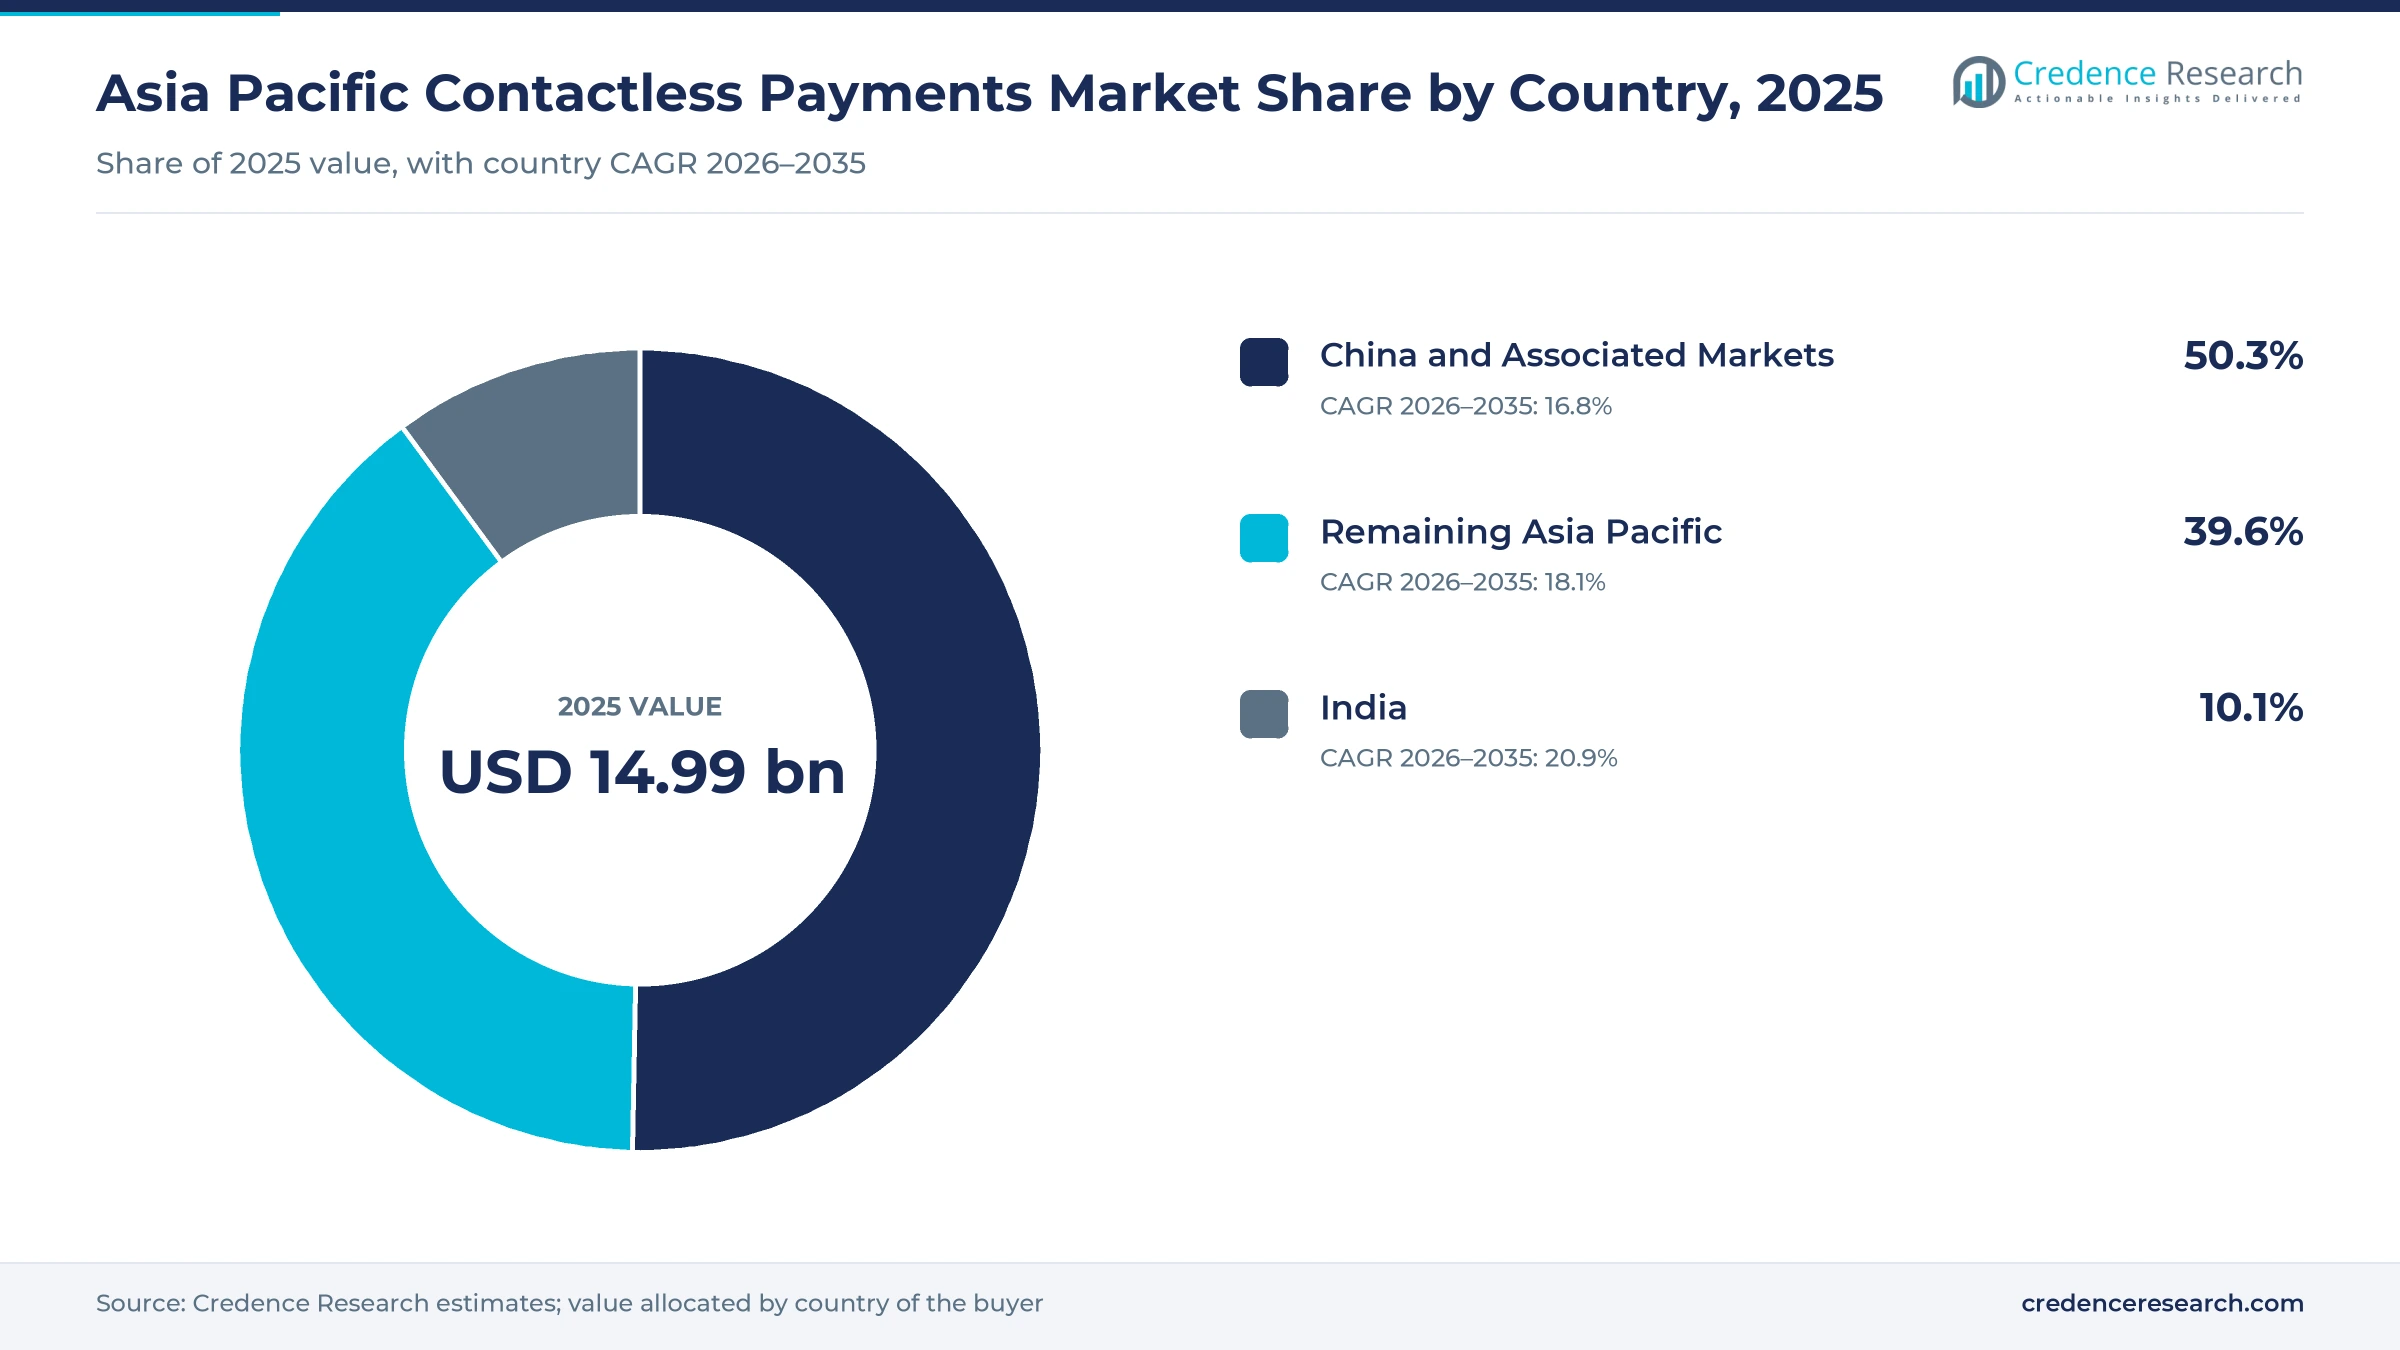
The Asia Pacific contactless payments market was valued at USD 14.99 billion in 2025 and is projected to increase from USD 17.70 billion in 2026 to USD 77.07 billion by 2035, registering a CAGR of 17.76% during 2026–2035. Demand comes from merchants replacing cash and swipe terminals, transit operators opening gates to bank cards and phones, and wallet providers turning QR networks into tap-ready acceptance. China and Associated Markets held the largest country share, 50.3% in 2025, because super-app wallets already handle most in-store spending and earn fees on very large volumes. India is the fastest-growing country at 20.9% a year, as merchant devices, card acceptance on payment speakers and small-ticket wallet payments widen revenue beyond zero-fee transfers. A notable change came in March 2025, when Bank Indonesia added NFC tapping to its national QR standard. Providers now compete on acceptance software, device services and cross-border wallet links as much as on transaction fees.
Provider revenue, not spending value, defines the market
The market counts the revenue that wallet platforms, card networks and acceptance providers in Asia Pacific earn from contactless in-person payments, made by tapping a card, phone or wearable or by scanning a QR code at the point of sale. It covers transaction-linked fees, recurring merchant subscriptions for devices and software, and sales of terminals and implementation services, delivered as cloud-hosted, merchant-hosted or hybrid systems.
The count excludes the value of goods paid for, online card-not-present payments, person-to-person transfers and lending income. Value flows from consumers and issuers through wallets and card schemes to acquirers, payment aggregators and terminal makers, which sell acceptance to micro-merchants, multi-outlet chains and institutions such as transit operators and hospitals.
Asia Pacific Contactless Payments Market Insights
- The market rises from USD 14.99 billion in 2025 to USD 77.07 billion by 2035, a 17.76% CAGR, as QR networks add tap acceptance and merchants rent payment devices.
- China and Associated Markets held 50.3% of 2025 value, because Alipay and Weixin Pay handle most in-store spending across Mainland China.
- Mobile Wallet Platforms led with 51.0% of 2025 value, since super-app wallets own both the consumer account and the merchant QR code.
- India is the fastest-growing country at 20.9% a year during 2026–2035, helped by speaker devices that now take card taps beside UPI.
- Bank Indonesia launched QRIS Tap on March 14, 2025, adding NFC tapping to a national QR scheme that already reached 42 million merchants.
Wallet platforms lead while acceptance devices grow fastest
Why do wallet platforms keep the largest share?
Based on solution type, the market is categorized into mobile wallet platforms, card network services and acceptance infrastructure. Mobile Wallet Platforms led with 51.0% of 2025 value because super-app wallets control both the shopper account and the merchant code, and Ant International said in September 2025 that Alipay+ links international wallets to 80 million Alipay merchants across China. Acceptance Infrastructure grows fastest at 19.1% a year as tap acceptance moves onto phones and smart devices, and PAX Global Technology says its PAXSTORE platform connected more than 16 million terminals at the end of 2025. Demand for card terminal hardware shifts toward Android devices managed remotely.
What makes transit gates the fastest-growing use?
Based on application, the market is categorized into attended checkout, unattended acceptance and transit fare collection. Attended Checkout led with 69.0% of 2025 value because most taps and scans still happen at staffed counters, and the Bangko Sentral ng Pilipinas reported that QR Ph handled 2.47 billion transactions in 2025, exceeding debit and credit card transactions for the first time. Transit Fare Collection grows fastest at 19.8% a year as operators open gates to bank cards and phones, and Tokyo's Toei Subway and Keikyu began accepting tap-and-go cards at 36 stations on Dec. 21, 2024. Each gate converts frequent small fares into steady card and wallet volume.
Why are hospitals and public offices growing fastest?
Based on end-use industry, the market is categorized into retail and hospitality, transport and mobility, and healthcare and public services. Retail and Hospitality led with 63.0% of 2025 value because shops and restaurants hold most acceptance points, and PhonePe's draft prospectus counts 47.19 million registered merchants, covering 98.61% of India's PIN codes in September 2025. Healthcare and Public Services grow fastest at 19.1% a year as states push fee-free acceptance into public counters, and three Jakarta hospitals were among the first QRIS Tap sites in March 2025. Public payers tend to value faster queues more than they value low fees.
Why are device subscriptions the fastest-growing revenue line?
Based on revenue model, the market is categorized into transaction-linked fees, recurring merchant subscriptions and hardware and implementation sales. Transaction-Linked Fees led with 62.0% of 2025 value because card and wallet providers still price most acceptance per payment, and Square lists in-person tap and QR rates from 2.5% in Japan with no monthly charge. Recurring Merchant Subscriptions grow fastest at 20.1% a year as zero-fee rails push providers toward rentals, and One97 Communications reported 13.7 million merchant device subscriptions in September 2025, up 2.5 million in a year. Subscriptions give providers a revenue stream that survives cuts to per-payment fees.
| Segment Group | Leading Sub-segment | Share, 2025 | Fastest-growing Sub-segment | CAGR, 2026–2035 |
|---|---|---|---|---|
| By Solution Type | Mobile Wallet Platforms | 51.0% | Acceptance Infrastructure | 19.1% |
| By Application | Attended Checkout | 69.0% | Transit Fare Collection | 19.8% |
| By End-Use Industry | Retail and Hospitality | 63.0% | Healthcare and Public Services | 19.1% |
| By Revenue Model | Transaction-Linked Fees | 62.0% | Recurring Merchant Subscriptions | 20.1% |
Per-payment fees fall as device rentals rise
Contactless acceptance is priced per payment, per month for devices, or as a one-off terminal sale, and the balance is moving. Regulators push per-payment fees down, with zero rates on UPI and public service QRIS payments and lower card interchange caps in Australia, as the table shows. Card payments by foreign visitors stay the most profitable, because wallets and networks charge a cross-border premium. Providers protect margins by bundling devices, software and credit into monthly plans, so the cheapest headline rate rarely decides which provider a merchant picks.
| Offer or segment | Typical price or fee | Basis |
|---|---|---|
| UPI payments by small Indian merchants | 0% merchant fee, 0.15% government incentive up to Rs 2,000 | Prime Minister's Office, March 2025 (FY2024-25 scheme) |
| QRIS Tap at Indonesian public service agencies | 0% merchant discount rate | Bank Indonesia, March 2025 |
| In-person tap and QR payments in Japan | From 2.5% a payment, no monthly fee | Square Japan fee page, 2026 |
| Foreign card payments through Weixin Pay | 3% above RMB 200, none below | China Briefing, 2025 |
| Australian consumer credit interchange cap | 0.3% of value, down from 0.8% | Reserve Bank of Australia, March 2026 |
Request a Free Sample
Fill in your details and we'll send you a free sample report.
- Sample data tables & charts
- Research methodology
Shared QR rules and phone terminals drive acceptance growth
National QR standards unify merchant acceptance
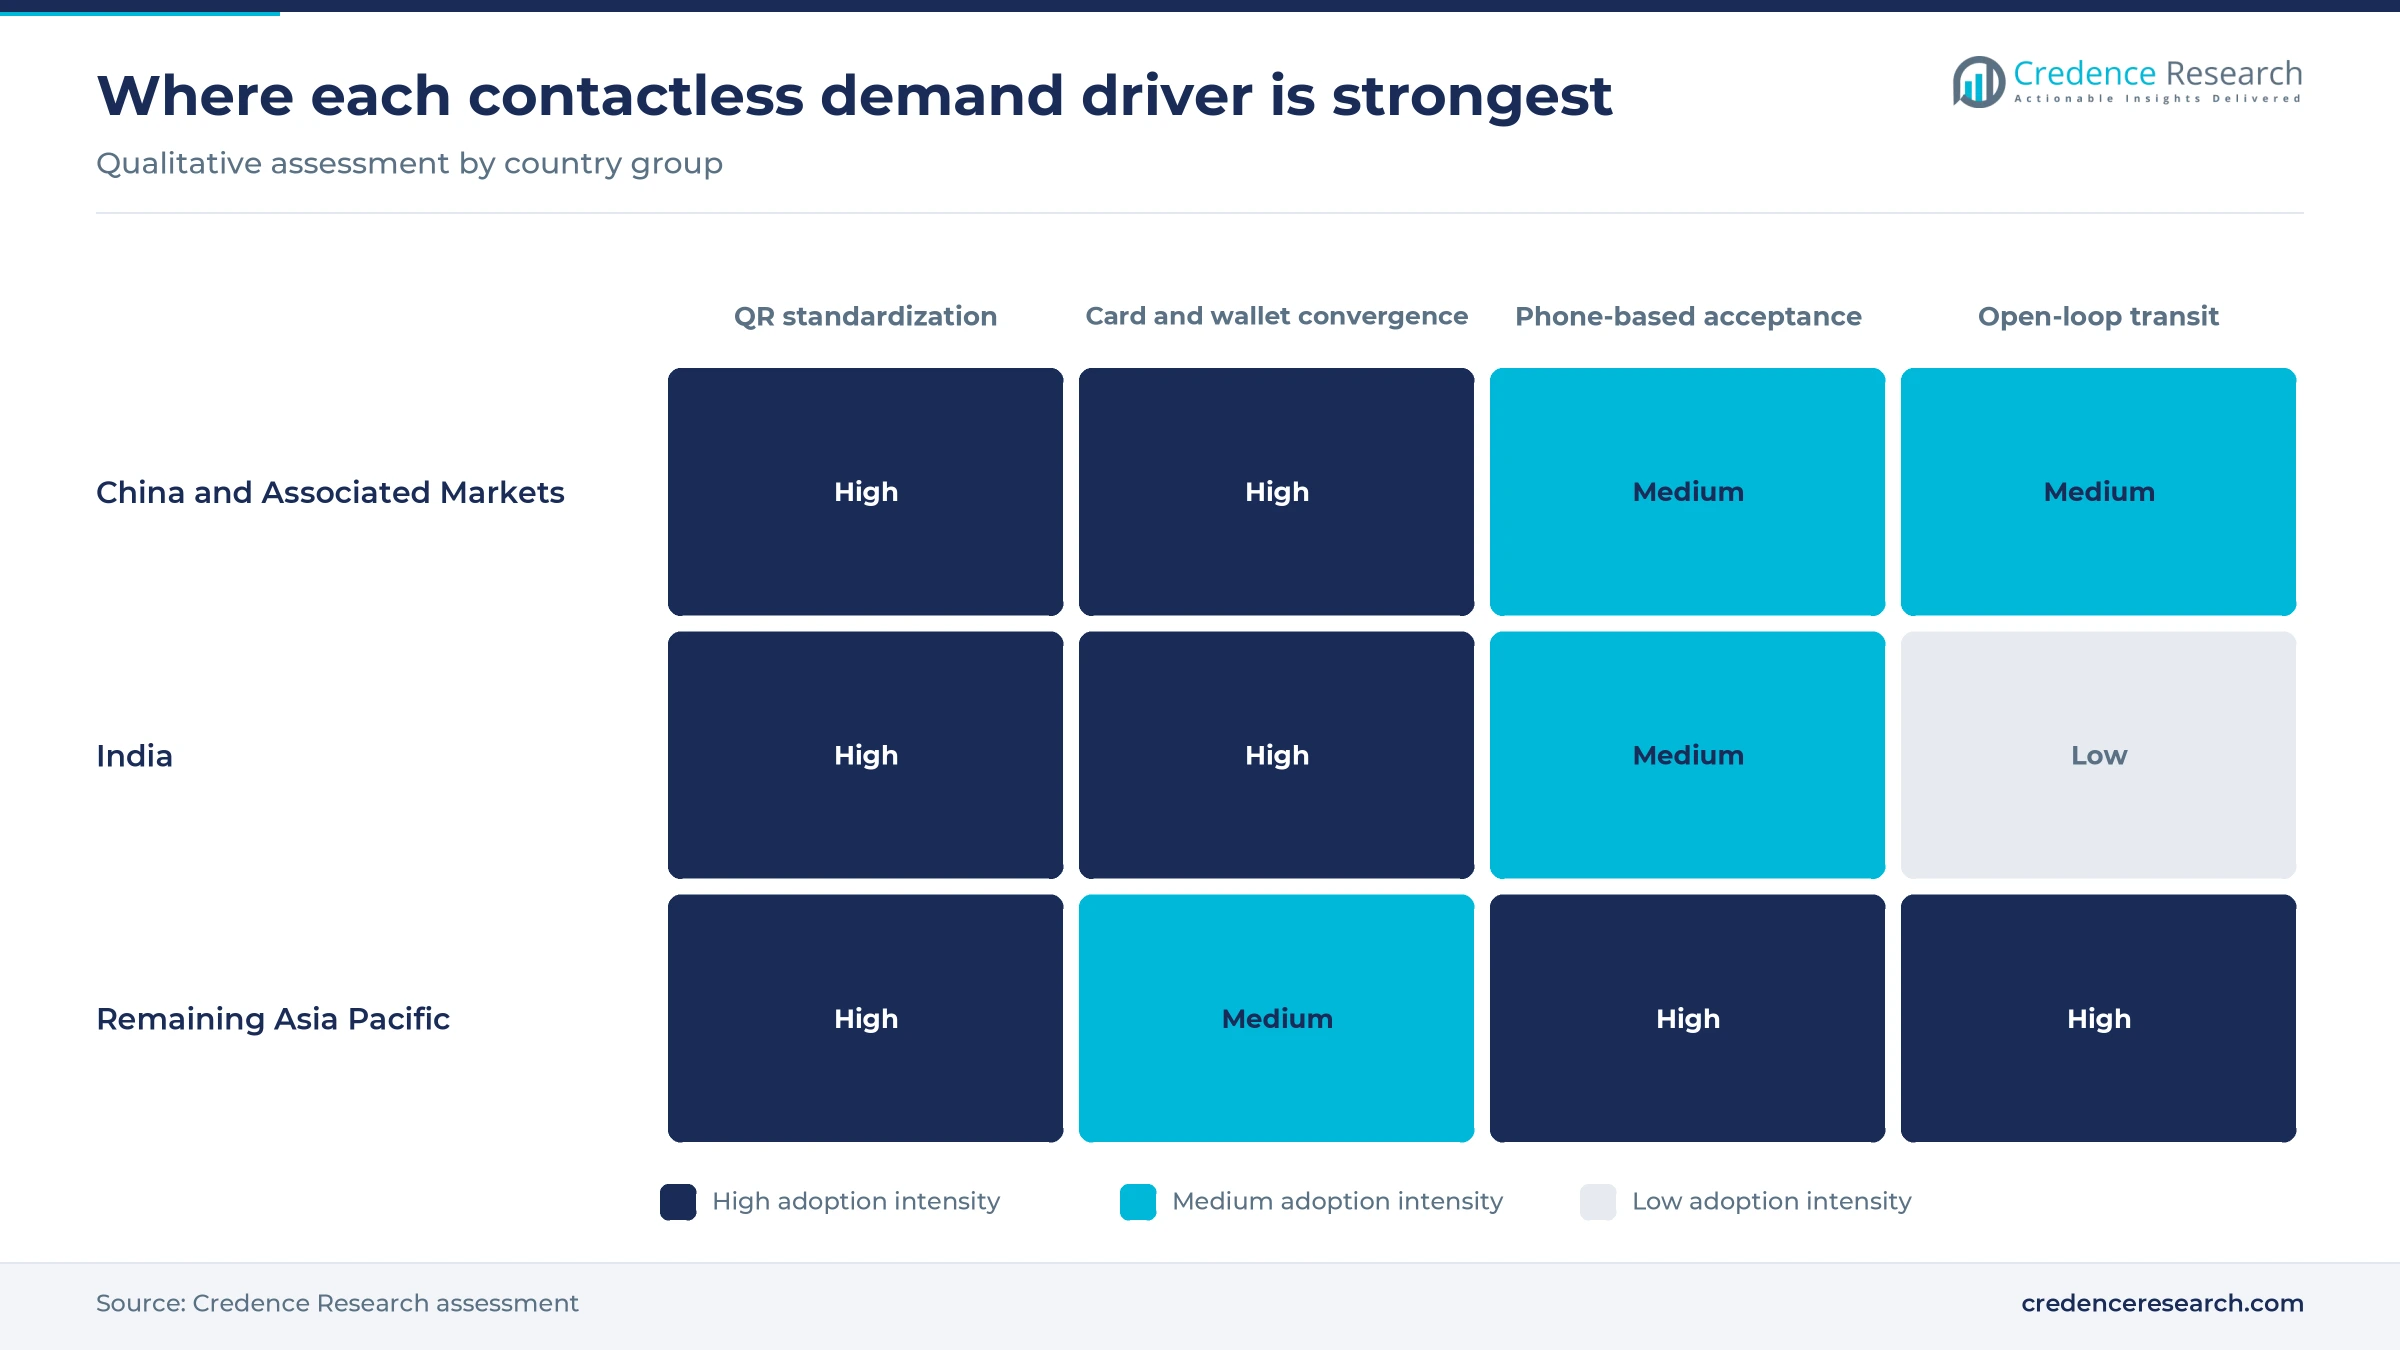
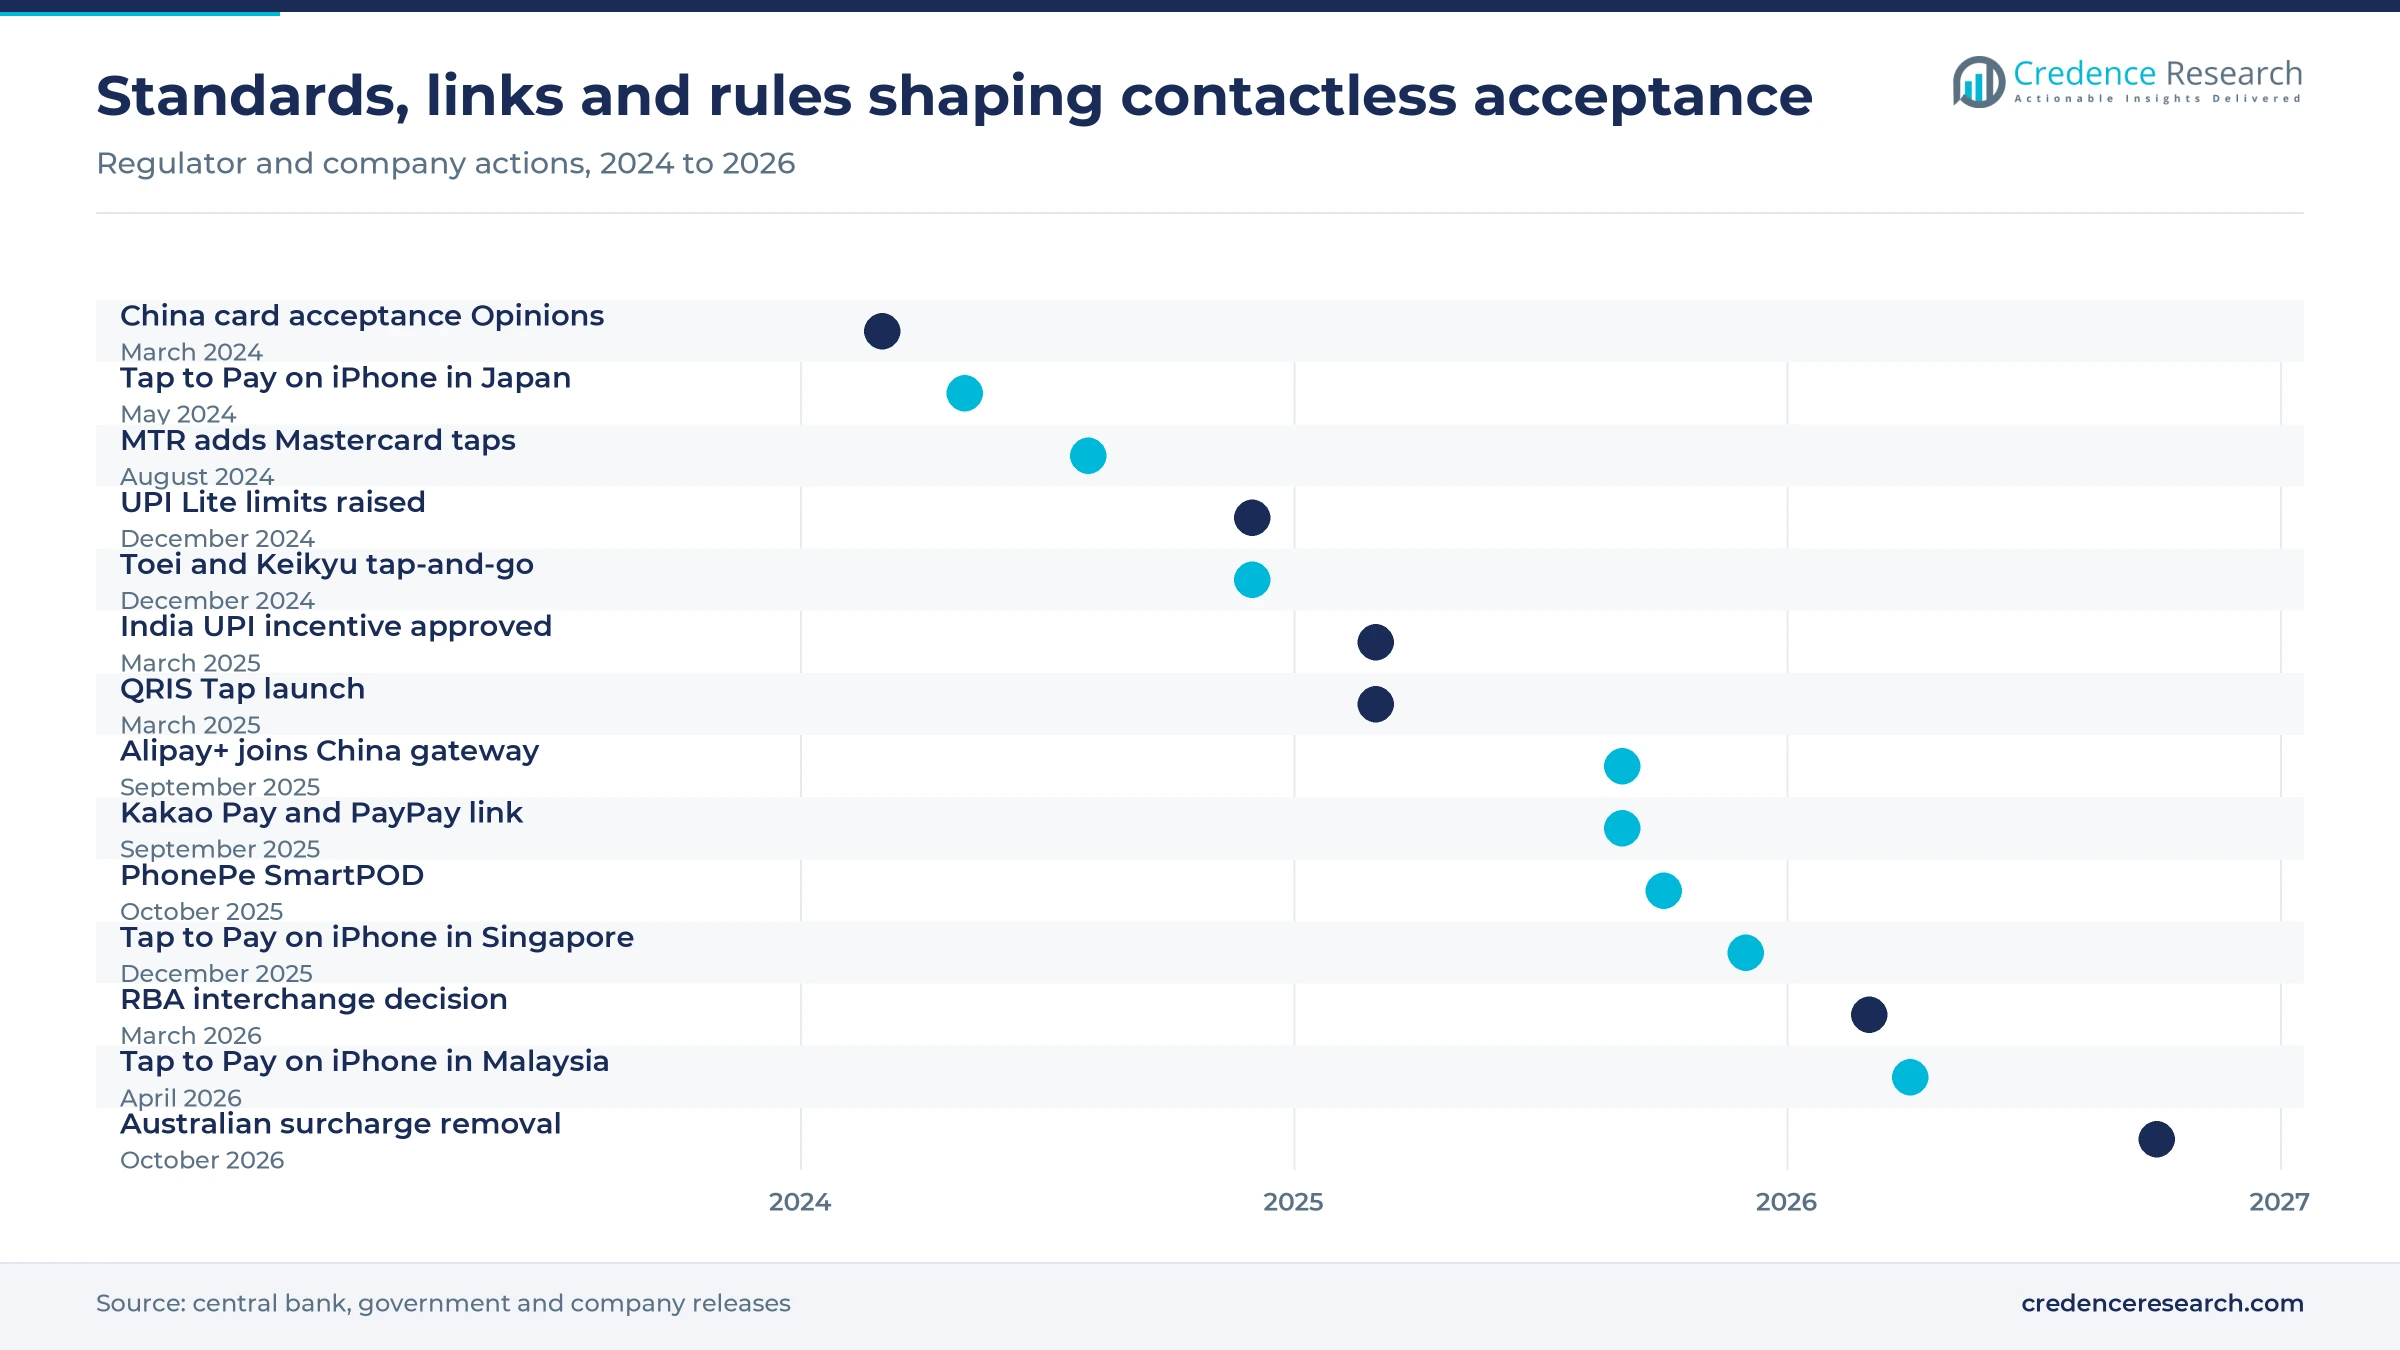
Common national QR standards let one merchant code accept every bank and wallet, which removes the main reason small sellers refused digital payments. Bank Indonesia launched QRIS Tap on March 14, 2025, adding NFC tapping to the national QR scheme at MRT stations, parking operators and hospitals. Bank Indonesia reported in December 2025 that QRIS reached 42 million merchants, ahead of its 40 million target. In the Philippines, digital payments reached 64.7% of retail payment volume in 2025, up from 57.4% a year earlier, according to the Bangko Sentral ng Pilipinas. Standard codes are the strongest driver of acceptance demand in Indonesia, where micro and small firms make up about 90% of QRIS merchants. Providers then earn on devices, settlement and services sold to them.
Card and wallet acceptance converges at checkout
Merchants increasingly accept cards and wallets on one device, so card networks and super apps now sell into the same checkout. Tencent lets inbound visitors link Visa, Mastercard, JCB and Discover cards to Weixin Pay, charging no fee on single payments up to RMB 200, according to China Briefing. UnionPay said in September 2026 that its QR acceptance network covers more than 38 million merchants across all ten ASEAN countries. PhonePe unveiled SmartPOD on Oct. 7, 2025, a device that adds NFC card taps and chip payments to its UPI payment speaker, letting small Indian shops take mobile wallet apps and cards together. Convergence raises card volume at small merchants, while wallets gain the card customers they once missed.
Phones replace terminals for small sellers
Software acceptance turns a seller's phone into a terminal, which removes hardware cost for the smallest merchants. Apple introduced Tap to Pay on iPhone in Japan on May 16, 2024 with GMO Financial Gate, Recruit and Square as launch partners. Apple extended it to Singapore on Dec. 2, 2025 and to Malaysia on April 22, 2026, where it also supports the local MyDebit scheme and UnionPay cards. Visa reported on March 3, 2025 that demand for its Tap to Phone service grew 200% in a year, with nearly 30% of tap sellers being new small businesses. Acquirers can now sign market stalls, delivery riders and home businesses without shipping devices, which is why acceptance infrastructure is the fastest-growing solution type.
Open-loop transit turns daily fares into tap volume
Transit operators that accept bank cards and phones at the gate create high-frequency, low-value volume that card networks and wallets value highly. Hong Kong's MTR extended tap-to-ride to Mastercard cards and phones on Aug. 24, 2024, after Visa cards were first accepted at MTR gates on Dec. 23, 2023, according to Visa and Mastercard releases. The Toei and Keikyu demonstration, which covers the route between Haneda Airport and central Tokyo, accepts Visa, JCB, American Express, Diners Club, Discover and UnionPay cards, according to the Tokyo Metropolitan Bureau of Transportation. Bank Indonesia added tap-in and tap-out QRIS Tap at transit gates in October 2025, after which demand for QRIS Tap rose 1,200% in one month to 508,000 transactions. Fare taps build daily habits that spill over into retail use.
Device subscriptions and inbound wallets reshape revenue
Shift from one-off terminal sales to device subscriptions
Providers increasingly rent payment devices by the month instead of selling them, because subscriptions earn where transaction fees are capped or zero. Paytm cut capital spending on devices from Rs 814 crore in fiscal 2024 to Rs 317 crore in fiscal 2025 by refurbishing older units instead of buying new ones, YourStory reported in November 2025. PhonePe's draft prospectus lists 9.19 million deployed devices, including SmartSpeakers, supported by 25,657 field staff. Paytm is also piloting an AI version of its Soundbox that it plans to charge for as a merchant service. Recurring revenue lowers provider exposure to fee rules, so subscriptions are the fastest-growing revenue model.
Rise of linked wallets across borders
Domestic wallets now connect to each other so travelers can pay with their home app abroad, which adds acceptance revenue without new merchant signups. Ant International said on Sept. 16, 2025 that Alipay+ connects 36 e-wallets and eight national QR schemes to more than 100 million merchants and 1.8 billion consumer accounts. Kakao Pay, PayPay and Alipay+ opened Korean stores to Japanese PayPay users in September 2025, covering more than 2 million merchants, The Korea Herald reported. UnionPay linked Chinese and Indonesian QR payments in June 2026, according to TechNode Global. These links let one merchant code serve visitors from many countries, so cross-border fees become a larger share of wallet income.
Opportunity in inbound visitor payments in China
Inbound tourism gives wallets and card networks a fast-growing, higher-fee customer group in Mainland China. China's State Council issued Opinions on March 7, 2024 directing better bank card acceptance in catering, hotels, transport, sightseeing, shopping and medical care, according to the People's Bank of China. Weixin Pay waived commission for new international card users on spending up to RMB 1,000 a day for 60 days during 2025, and reported that overseas customers, payment counts and value nearly tripled during the May 1 to 5 holiday. Cross-border card payments carry fees well above domestic wallet rates. Providers that combine card acceptance with wallet onboarding at airports and hotels can capture most of this spending.
Opportunity in low-use markets of India and Southeast Asia
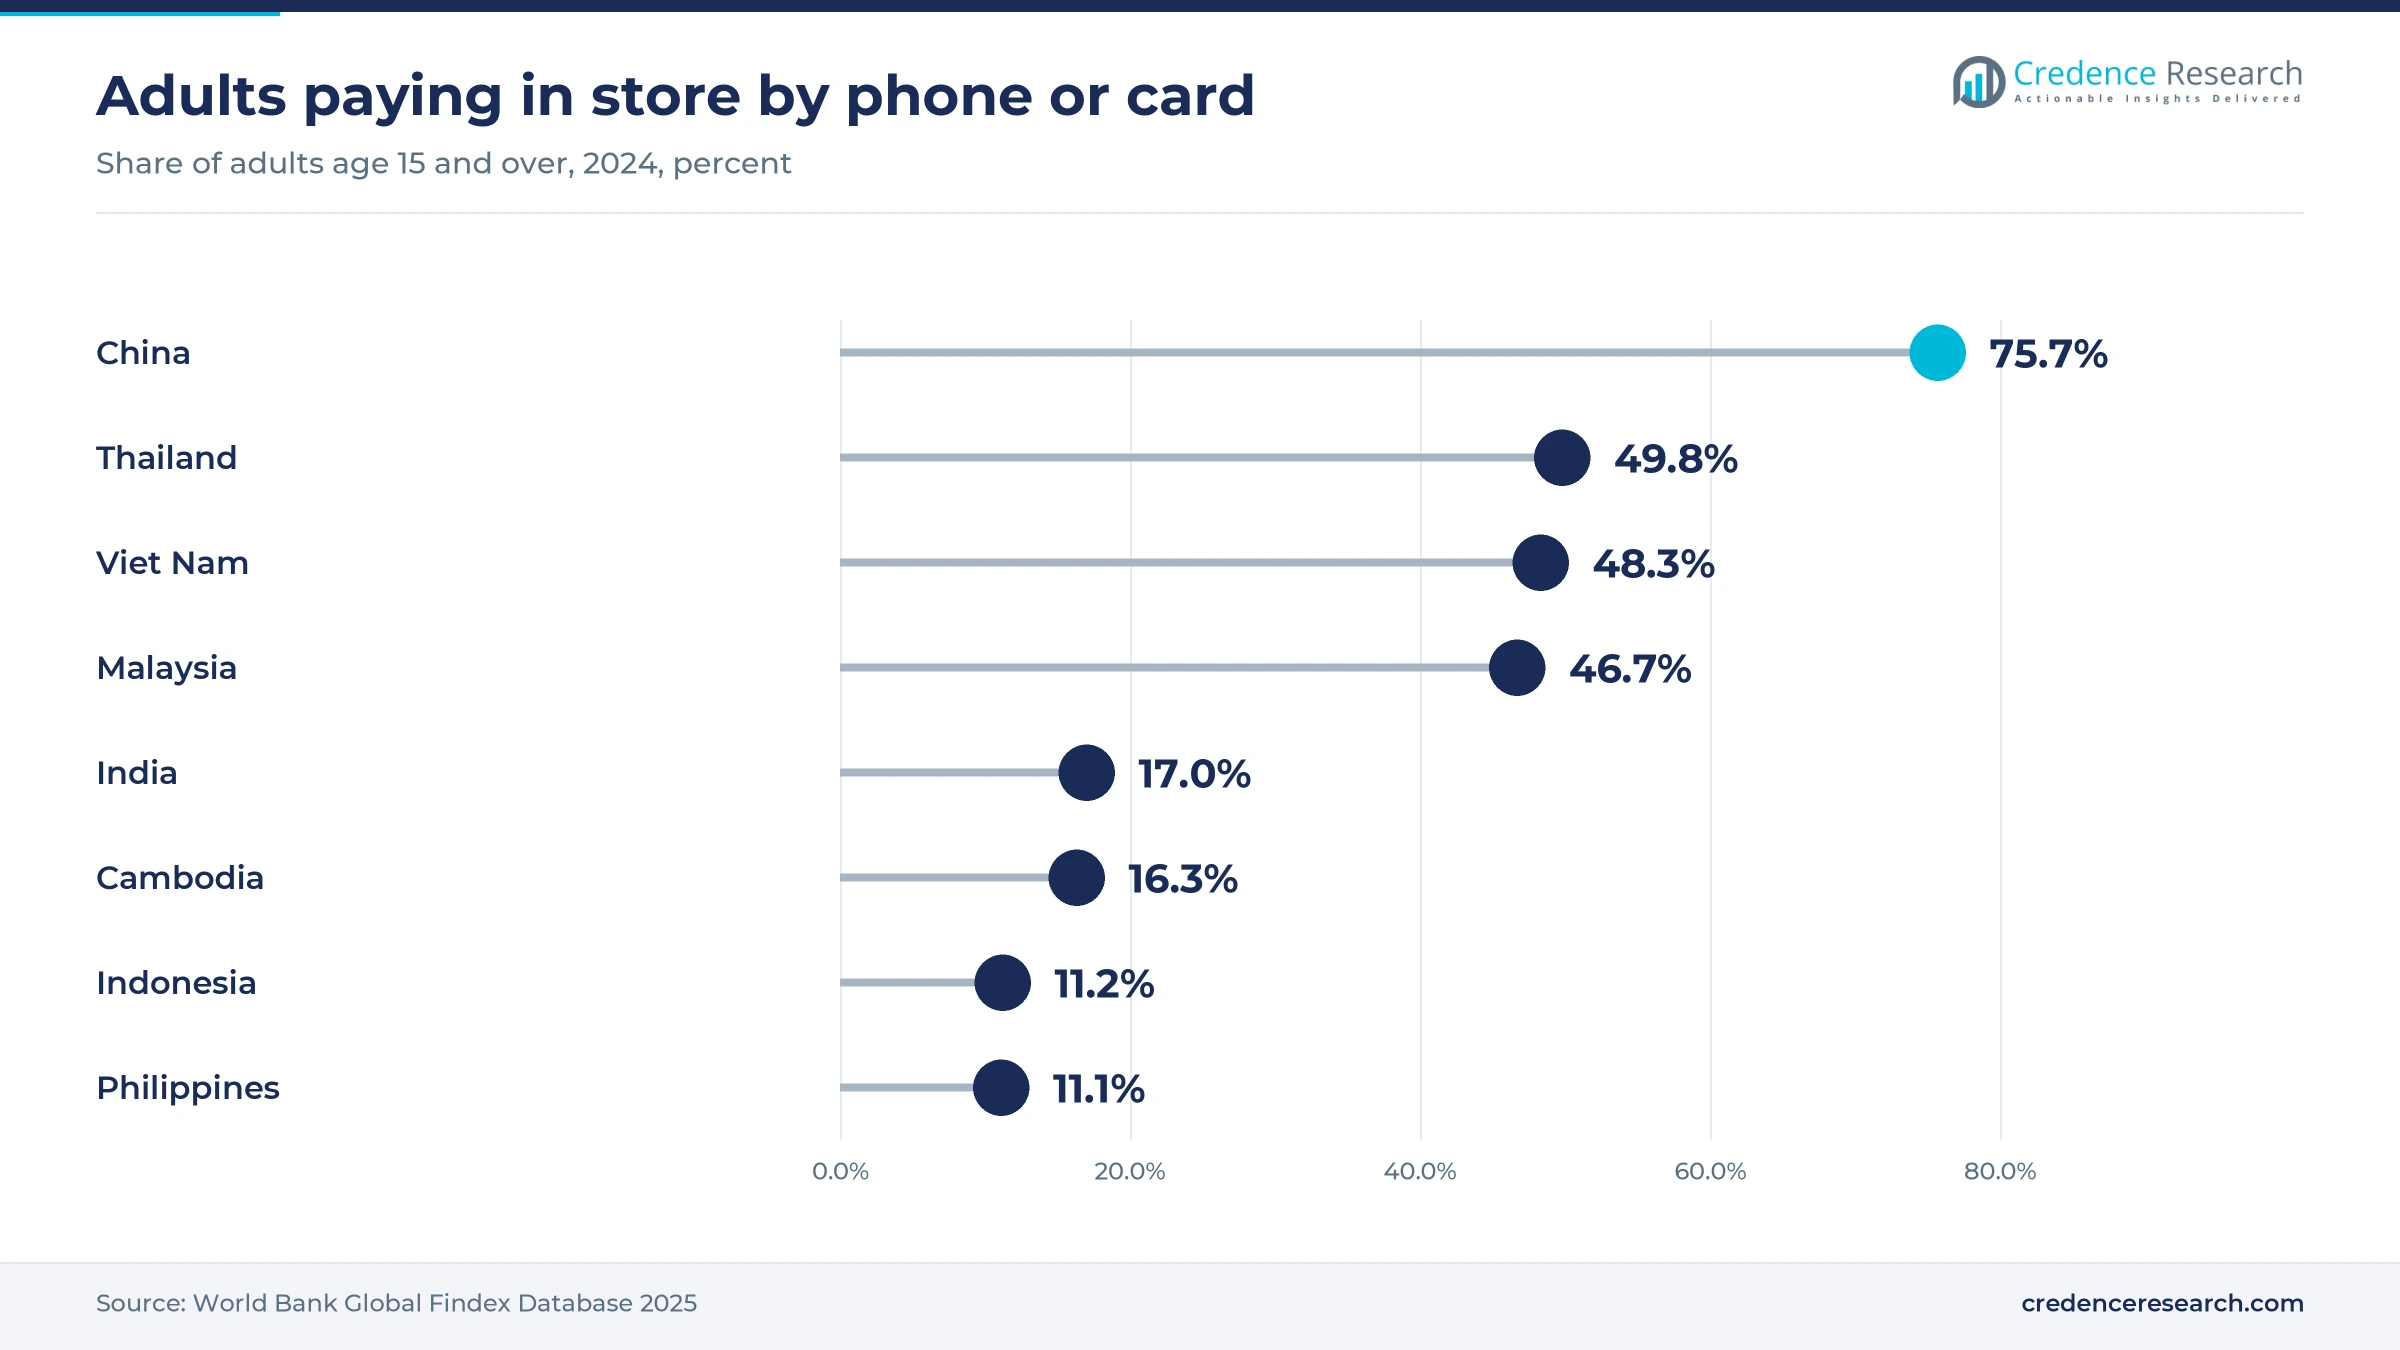
The largest untapped pool sits in countries where accounts are common but in-store digital payment is still rare. The World Bank reported that 42% of adults in low- and middle-income economies made a digital merchant payment in 2024, up from 35% in 2021. Its Global Findex 2025 data show only 17.0% of adults in India, 11.2% in Indonesia and 11.1% in the Philippines paid in store by phone or card, against 75.7% in China, the region's leader. Rising smartphone ownership across these countries narrows that gap a little each year. Providers that pair free QR codes with cheap tap devices and simple credit offers can win these first-time merchants before rivals lock them in.
Zero fees, fraud and fee caps squeeze provider margins
Zero merchant fees on UPI cap transaction revenue
India's largest contactless rail earns almost nothing per payment, so providers depend on public subsidy and device rentals. BHIM-UPI payments have carried zero merchant discount rate since January 2020, and the Cabinet approved a Rs 1,500 crore incentive on March 19, 2025 paying 0.15% on small-merchant payments up to Rs 2,000 for fiscal 2024-25. Wallet apps and banks absorb processing costs on every larger payment. Unless a fee returns for big merchants, revenue growth in India will lag volume growth by a wide margin.
Fraud on QR and wallet payments raises costs
Fraud on QR and wallet payments raises compliance and refund costs for every provider. India's finance ministry told the Lok Sabha in December 2025 that UPI fraud reached Rs 805 crore across 10.64 lakh incidents between April and November 2025, after Rs 981 crore in the previous fiscal year. GCash has blocked more than 7,000 merchants since 2025 over suspected illegal gambling and suspicious activity, The Philippine Star reported in May 2026. Providers must spend more on merchant checks and transaction monitoring, which slows onboarding of the micro-merchants that drive growth.
Lower interchange caps cut card revenue in Australia
Regulators in mature card markets are cutting the fees that fund contactless acceptance. The Reserve Bank of Australia decided in March 2026 to lower the consumer credit interchange cap to 0.3% from 0.8% and the debit cap to eight cents or 0.16%, and to remove surcharging from Oct. 1, 2026. The bank expects merchants to save about AUD 910 million a year, which shrinks the fee pool behind card acceptance demand. Issuers lose income that paid for card rewards, which may push them to promote cheaper debit and wallet tokens.
Market-share limits leave Indian providers uncertain
A pending limit on wallet market share makes long-term planning hard for India's largest apps. NPCI has pushed the deadline for its 30% cap on any single UPI app to Dec. 31, 2026, while PhonePe holds close to 50% of UPI volume and PhonePe and Google Pay together exceed 85%, according to Angel One. If the cap is enforced, leaders must slow merchant growth or shift users to rivals, and investors price this risk into valuations.
China holds half the value while India grows fastest
| Country | Value, 2025 (USD billion) | Share, 2025 | CAGR, 2026–2035 |
|---|---|---|---|
| China and Associated Markets | 7.54 | 50.3% | 16.8% |
| Remaining Asia Pacific | 5.94 | 39.6% | 18.1% |
| India | 1.51 | 10.1% | 20.9% |
China and associated markets lead on wallet scale
China and Associated Markets held 50.3% of 2025 value and grows at 16.8% a year, below the regional rate, because wallet use is already near saturation and domestic fees are low. This report groups Mainland China with Hong Kong, Macau and Taiwan, and World Bank Findex data show 75.7% of Chinese adults already pay in store by phone or card. Alipay and Weixin Pay dominate everyday spending, while UnionPay links cards and QR payments. New revenue comes mainly from inbound travelers and card acceptance at hotels, airports and transit gates, such as the MTR network in Hong Kong.
Remaining Asia Pacific mixes card markets and QR markets
Remaining Asia Pacific held 39.6% of 2025 value and grows at 18.1% a year, combining card-heavy Japan, Australia and Korea with QR-led Southeast Asia. Japan's cashless payment ratio reached 42.8% in 2024, worth JPY 141.0 trillion, with code payments at 9.6% of that value, according to METI, which feeds cashless spending in Japan. Kakao Pay reported in May 2026 about 6 million monthly offline users and 650,000 offline merchants in Korea. Indonesia and the Philippines add volume through national QR schemes, and GCash reported more than 60 million registered users in September 2025.
India grows fastest as devices add card taps
India held 10.1% of 2025 value and is the fastest-growing country at 20.9% a year, because providers now earn on devices and card taps around a very large, mostly fee-free UPI base. Demand on UPI reached more than 228 billion transactions worth nearly Rs 300 trillion in 2025, up 32.5% by volume, Business Standard reported from NPCI data. The Reserve Bank of India raised UPI Lite limits in December 2024 to Rs 1,000 a payment and Rs 5,000 in the wallet, widening small-ticket offline use. Payment speakers that accept cards add revenue where UPI alone pays little.
Tap standards, wallet links and fee rules mark 2025 and 2026
| Development | Status and market relevance |
|---|---|
| In March 2025, Bank Indonesia launched QRIS Tap, adding NFC tapping to the national QR standard at Jakarta transit and hospital sites. | Live, extended to tap-in and tap-out transit gates in October 2025. |
| In September 2025, Ant International became an inaugural foreign partner of China's Cross-border Interconnection Payment Gateway. | Operating, linking overseas wallets to Alipay merchants in Mainland China. |
| In October 2025, PhonePe unveiled SmartPOD, combining its UPI payment speaker with NFC card taps and chip payments. | Launched for small Indian merchants that mainly accept UPI. |
| In December 2025, Apple brought Tap to Pay on iPhone to Singapore with Adyen, Stripe, HitPay and other platforms. | Available, letting sellers accept cards and wallets on an iPhone. |
| In March 2026, the Reserve Bank of Australia lowered card interchange caps and decided to remove surcharging. | Most changes take effect on Oct. 1, 2026. |
NFC on QR rails and phone terminals change acceptance
- NFC on national QR schemes lets a phone tap at the same terminal that reads a QR code, which speeds payments at gates and busy counters without a new scheme.
- Tap to pay on phones turns an ordinary smartphone into a certified card terminal, which removes hardware cost for market stalls and mobile sellers.
- Hybrid payment speakers combine audio payment alerts with card readers and displays, which brings card acceptance to shops that started with free QR codes.
- Remote terminal management lets acquirers update software, add wallets and monitor fleets of Android terminals from one console, cutting field service visits.
Need a Custom Version of This Report?
Tailor the scope, geography, or segments to your exact requirements.
- Custom geography or segment scope
- Direct access to our analyst team
Super apps and card networks compete for the same checkout
Competition in Asia Pacific contactless payments turns on who owns the merchant checkout. Ant Group and Tencent Holdings dominate wallet payments in Mainland China and extend their reach abroad through partner wallets. Visa, Mastercard and UnionPay International compete on tap acceptance, tokens and transit deals, and increasingly sell services to wallet partners. PhonePe and One97 Communications fight for Indian merchants with payment speakers and credit, while GCash and Kakao Pay lead wallet payments in the Philippines and Korea. PAX Global Technology supplies terminals and device management to many acquirers. Merchants compare fees, device costs, settlement speed and the customers each brand brings, and switching costs rise once a provider also supplies credit and software. Cross-border wallet links let rivals cooperate on acceptance while still competing for consumers at home.
How concentrated is contactless acceptance supply?
Supply is concentrated in consumer wallets and card schemes and fragmented in merchant acquiring. A few super apps, Alipay and Weixin Pay in Mainland China and PhonePe and Google Pay in India, handle most wallet volume. Visa, Mastercard and UnionPay run the card rails, alongside domestic schemes such as RuPay, MyDebit and NETS. Thousands of banks, aggregators and payment platforms sell acceptance to merchants, often on terminals from PAX Global Technology and similar makers. Entry barriers are highest for wallets, which need hundreds of millions of users, while margins are richest in cross-border payments and merchant software.
Companies profiled and their roles in this market
| Company | Type | Role in the market |
|---|---|---|
| Ant Group (Alipay and Ant International) | Wallet and cross-border platform | Runs Alipay in China and Alipay+ links for overseas wallets and merchants |
| Tencent Holdings (Weixin Pay) | Wallet platform | Runs Weixin Pay QR and card-linked payments for Chinese and visiting users |
| Visa | Card network | Runs contactless card, token and Tap to Phone services across the region |
| Mastercard | Card network | Runs contactless card acceptance, including open-loop transit fare payments |
| UnionPay International | Card and QR network | Runs UnionPay card taps and QR acceptance across Asian markets |
| PhonePe | Wallet and merchant services | Sells UPI acceptance, SmartSpeaker devices and card-enabled SmartPOD units in India |
| One97 Communications (Paytm) | Wallet and merchant services | Rents Soundbox and card devices and processes UPI payments for Indian merchants |
| GCash (Mynt) | Wallet platform | Runs the leading Philippine wallet and QR Ph merchant payments |
| Kakao Pay | Wallet platform | Runs offline QR and card-linked wallet payments in Korea and abroad |
| PAX Global Technology | Terminal maker | Sells Android payment terminals and PAXSTORE device management to acquirers |
Merchant services, not payment fees, will carry returns
Credence Research's view is that merchant services, not per-payment fees, will carry provider returns in Asia Pacific through 2035. Regulators keep pushing domestic fees toward zero, yet merchants pay readily for devices, software, credit and faster settlement. Card networks gain where QR schemes add tap acceptance, because NFC taps bring card tokens into wallet-led markets. Cross-border visitor payments remain the richest pool of fees for every provider. Buyers should favor providers that bundle cards, wallets and device management on one terminal and that offer clear exit terms.
Estimates rest on regulator data and provider disclosures
The report uses 2025 as the base year and 2026 to 2035 as the forecast period. Market values come from the Credence Research model, and country, solution, application, industry and revenue model splits are Credence Research estimates informed by public data. Sources include central bank and government releases, official statistics, company filings and press releases, published merchant fee schedules and regional news publishers. No interviews or surveys were used to build these estimates.
Software acceptance and transit taps set the pace to 2035
Credence Research expects Asia Pacific contactless payments revenue to reach USD 77.07 billion by 2035 as national QR schemes add tap acceptance and phones replace terminals at small merchants. India should keep the fastest pace as device rentals and card taps grow around UPI, while China and Associated Markets stays the largest source of value. Revenue will move toward subscriptions, software acceptance and transit gates. Fee caps and fraud remain the main risks, because both can slow how quickly new merchants turn into paying customers.
Fee rules and tap adoption set the range to 2035
The range of outcomes depends mainly on whether regulators keep cutting per-payment fees and how fast software acceptance reaches micro-merchants. Strict fee caps across more countries would shift revenue to devices but slow the total, while quick NFC adoption on QR schemes would add card and wallet volume. Tourism flows matter too, because cross-border payments carry the highest fees.
| Scenario | CAGR, 2026–2035 | Value, 2035 | What has to hold |
|---|---|---|---|
| Downside | 15.3% | USD 63.54 billion | More countries cap fees at zero and fraud losses slow onboarding of small merchants |
| Base | 17.76% | USD 77.07 billion | QR schemes add tap acceptance on current schedules and fee rules stay broadly as announced |
| Upside | 19.3% | USD 86.38 billion | Phone acceptance spreads quickly and inbound travel lifts higher-fee cross-border payments |
Frequently Asked Questions
How big is the Asia Pacific contactless payments market?
Which country group leads the market?
Which country is growing fastest?
Which solution type holds the largest share?
Why does tap acceptance on QR schemes matter?
What holds the market back?
How is contactless acceptance priced in the region?
Who are the main companies in this market?
Table of Content
Chapter 1 Market Segmentation
- 1.1 Segmentation Framework
- 1.1.1 Product and Service Classification
- 1.1.2 Application and End-Use Classification
- 1.1.3 Technology and Solution Classification
- 1.1.4 Customer and Distribution Channel Classification
- 1.1.5 Geographic Segmentation
- 1.1.6 Market Segment Definitions and Boundaries
- 1.2 By Solution Type
- 1.2.1 Mobile Wallet Platforms
- 1.2.2 Card Network Services
- 1.2.3 Acceptance Infrastructure
- 1.3 By Application
- 1.3.1 Attended Checkout
- 1.3.2 Unattended Acceptance
- 1.3.3 Transit Fare Collection
- 1.4 By End-Use Industry
- 1.4.1 Retail and Hospitality
- 1.4.2 Transport and Mobility
- 1.4.3 Healthcare and Public Services
- 1.5 By Revenue Model
- 1.5.1 Transaction-Linked Fees
- 1.5.2 Hardware and Implementation Sales
- 1.5.3 Recurring Merchant Subscriptions
- 1.6 By Country
- 1.6.1 China and Associated Markets
- 1.6.2 India
- 1.6.3 Remaining Asia Pacific
Chapter 2 Introduction
- 2.1 Report Objectives and Scope
- 2.2 Product Definition and Industry Terminology
- 2.3 Market Inclusions and Exclusions
- 2.4 Research Process
- 2.4.1 Primary Research and Expert Interviews
- 2.4.2 Secondary Research and Source Review
- 2.4.3 Top-Down and Bottom-Up Estimation
- 2.4.4 Data Triangulation and Verification
- 2.5 Market Size Measurement Basis
- 2.5.1 2025: USD 14.99 billion → 2035: USD 77.07 billion
- 2.6 Historical and Forecast Reference Periods
- 2.6.1 Historical Period: 2018-2025
- 2.6.2 Base Year: 2025
- 2.6.3 Forecast Period: 2025-2035
- 2.7 Research Assumptions and Limitations
Chapter 3 Executive Summary
- 3.1 Market Snapshot and Key Findings
- 3.2 Base-Year Market Size, 2025
- 3.3 Forecast Market Size, 2035
- 3.4 Revenue and Volume Growth Outlook
- 3.5 Key Demand and Supply Indicators
- 3.6 Leading Market Segments
- 3.7 Fastest-Growing Market Opportunities
- 3.8 Regional Performance Highlights
- 3.9 Technology and Industry Transformation
- 3.10 Competitive Landscape Summary
- 3.11 Analyst View and Strategic Implications
Chapter 4 Asia Pacific Contactless Payments Market Trends and Developments
- 4.1 Historical Industry Development, 2018-2025
- 4.2 Recent Market Trends and Developments
- 4.3 Demand and Customer Behavior Trends
- 4.4 Technology and Product Innovation
- 4.5 Artificial Intelligence, Automation and Digitalization
- 4.6 Local Manufacturing and Supply Chain Realignment
- 4.7 Industry Partnerships, Mergers and Acquisitions
- 4.8 Sustainability and Circular Economy Developments
- 4.9 Government and Private Sector Investment Trends
- 4.10 Emerging Business Models and Commercialization
- 4.11 Industry Developments and Announcements
Chapter 5 Asia Pacific Contactless Payments Market Supply and Demand Analysis
- 5.1 Demand Trend and Consumption Analysis, 2018-2025
- 5.2 Demand Forecast, 2025-2035
- 5.3 Supply Chain Structure and Procurement Trends
- 5.4 Supply-Demand Gap and Bottlenecks
- 5.5 Import Dependence and Sourcing Structure
- 5.6 Regional Supply and Demand Concentration
Chapter 6 Asia Pacific Contactless Payments Market Pricing Analysis
- 6.1 Pricing Structure and Measurement
- 6.2 Historical Pricing Trends, 2018-2025
- 6.3 Pricing Outlook, 2025-2035
- 6.4 Pricing by Product and Market Segment
- 6.5 Geographic Pricing Differences
- 6.6 Key Input, Energy, Labor and Logistics Costs
- 6.7 Contract Pricing and Purchasing Models
- 6.8 Pricing Sensitivity and Competitive Positioning
- 6.9 Price, Margin and Profitability Implications
Chapter 7 Asia Pacific Contactless Payments Market Dynamics
- 7.1 Market Growth Drivers
- 7.1.1 Demand-Side Drivers
- 7.1.2 Technology and Innovation Drivers
- 7.1.3 Infrastructure and Investment Drivers
- 7.1.4 Regulatory and Policy Drivers
- 7.2 Market Restraints
- 7.2.1 Cost and Affordability Constraints
- 7.2.2 Technology and Adoption Barriers
- 7.2.3 Supply Chain and Operational Constraints
- 7.3 Market Challenges
- 7.3.1 Competitive Pressure and Margin Erosion
- 7.3.2 Skills, Infrastructure and Implementation Gaps
- 7.4 Emerging Market Opportunities
- 7.5 Market Dynamics Impact and Time-Horizon Assessment
Chapter 8 Asia Pacific Contactless Payments Value Chain Analysis
- 8.1 Industry Value Chain Overview
- 8.2 Upstream Suppliers and Critical Inputs
- 8.3 Technology and Component Providers
- 8.4 Manufacturing or Service Delivery
- 8.5 Distribution, Channel Partners and Integrators
- 8.6 Downstream Applications and End Users
- 8.7 Value Addition and Profit Pools
- 8.8 Vertical Integration and Outsourcing
- 8.9 Supplier Concentration and Risk
- 8.10 Supply Chain Localization and Resilience
Chapter 9 Asia Pacific Contactless Payments Market Regulations and Policies
- 9.1 Relevant Laws, Standards and Compliance Frameworks
- 9.2 Product, Service, Safety and Quality Requirements
- 9.3 Government Policies, Incentives and Subsidies
- 9.4 Imports, Exports and Trade Barriers
- 9.5 Public Procurement and Local Content Requirements
- 9.6 Data Protection, AI and Cybersecurity Compliance
- 9.7 Upcoming Policy Changes and Market Implications
Chapter 10 Asia Pacific Contactless Payments Market Hotspots and Opportunities
- 10.1 Market Opportunity Mapping and Growth Hotspots
- 10.2 High-Growth Applications and Customer Groups
- 10.3 Underserved Markets and White-Space Opportunities
- 10.4 Emerging Technology and Product Opportunities
- 10.5 New Capacity and Investment Hotspots
- 10.6 Market Entry and Expansion Opportunities
- 10.7 Distribution and Partnership Opportunities
- 10.8 Near-Term and Long-Term Commercial Potential
- 10.9 Opportunity Attractiveness and Execution Risks
Chapter 11 Asia Pacific Contactless Payments Market Outlook, 2025-2035
- 11.1 Market Size and Analysis
- 11.1.1 Revenue (Market Measurement: 2025: USD 14.99 billion → 2035: USD 77.07 billion)
- 11.1.2 Historical Market Size, 2018-2025
- 11.1.3 Base-Year Market Size, 2025
- 11.2 Market Forecast, 2025-2035
- 11.2.1 Revenue Forecast to 2035
- 11.2.2 CAGR and Year-on-Year Growth
- 11.2.3 Incremental Revenue Opportunity
- 11.3 Forecast Assumptions and Scenario Analysis
- 11.3.1 Base-Case Forecast
- 11.3.2 Optimistic and Conservative Scenarios
- 11.3.3 Technology, Pricing and Policy Sensitivities
- 11.4 Market Attractiveness and Growth Outlook
Chapter 12 Asia Pacific Contactless Payments Market Segmentation and Outlook
- 12.1 Segmentation Summary and Market Shares, 2025
- 12.2 Largest and Fastest-Growing Segments
- 12.3 By Solution Type - Market Size and Forecast, 2025-2035
- 12.3.1 Segment Definition and Scope
- 12.3.2 Historical Market Size, 2018-2025
- 12.3.3 Revenue Forecast, 2025-2035
- 12.3.4 Base-Year Market Share, 2025
- 12.3.5 Segment CAGR and Growth Drivers
- 12.3.6 Subsegment Market Size and Forecast
- 12.3.6.1 Mobile Wallet Platforms
- 12.3.6.2 Card Network Services
- 12.3.6.3 Acceptance Infrastructure
- 12.3.7 Subsegment Pricing and Adoption Trends
- 12.3.8 Leading Suppliers and Competition
- 12.3.9 Regional Demand and Opportunities
- 12.4 By Application - Market Size and Forecast, 2025-2035
- 12.4.1 Segment Definition and Scope
- 12.4.2 Historical Market Size, 2018-2025
- 12.4.3 Revenue Forecast, 2025-2035
- 12.4.4 Base-Year Market Share, 2025
- 12.4.5 Segment CAGR and Growth Drivers
- 12.4.6 Subsegment Market Size and Forecast
- 12.4.6.1 Attended Checkout
- 12.4.6.2 Unattended Acceptance
- 12.4.6.3 Transit Fare Collection
- 12.4.7 Subsegment Pricing and Adoption Trends
- 12.4.8 Leading Suppliers and Competition
- 12.4.9 Regional Demand and Opportunities
- 12.5 By End-Use Industry - Market Size and Forecast, 2025-2035
- 12.5.1 Segment Definition and Scope
- 12.5.2 Historical Market Size, 2018-2025
- 12.5.3 Revenue Forecast, 2025-2035
- 12.5.4 Base-Year Market Share, 2025
- 12.5.5 Segment CAGR and Growth Drivers
- 12.5.6 Subsegment Market Size and Forecast
- 12.5.6.1 Retail and Hospitality
- 12.5.6.2 Transport and Mobility
- 12.5.6.3 Healthcare and Public Services
- 12.5.7 Subsegment Pricing and Adoption Trends
- 12.5.8 Leading Suppliers and Competition
- 12.5.9 Regional Demand and Opportunities
- 12.6 By Revenue Model - Market Size and Forecast, 2025-2035
- 12.6.1 Segment Definition and Scope
- 12.6.2 Historical Market Size, 2018-2025
- 12.6.3 Revenue Forecast, 2025-2035
- 12.6.4 Base-Year Market Share, 2025
- 12.6.5 Segment CAGR and Growth Drivers
- 12.6.6 Subsegment Market Size and Forecast
- 12.6.6.1 Transaction-Linked Fees
- 12.6.6.2 Hardware and Implementation Sales
- 12.6.6.3 Recurring Merchant Subscriptions
- 12.6.7 Subsegment Pricing and Adoption Trends
- 12.6.8 Leading Suppliers and Competition
- 12.6.9 Regional Demand and Opportunities
- 12.7 By Country - Market Size and Forecast, 2025-2035
- 12.7.1 Segment Definition and Scope
- 12.7.2 Historical Market Size, 2018-2025
- 12.7.3 Revenue Forecast, 2025-2035
- 12.7.4 Base-Year Market Share, 2025
- 12.7.5 Segment CAGR and Growth Drivers
- 12.7.6 Subsegment Market Size and Forecast
- 12.7.6.1 China and Associated Markets
- 12.7.6.2 India
- 12.7.6.3 Remaining Asia Pacific
- 12.7.7 Subsegment Pricing and Adoption Trends
- 12.7.8 Leading Suppliers and Competition
- 12.7.9 Regional Demand and Opportunities
- 12.8 Segment Growth Comparison
- 12.9 Segment Attractiveness and Priority Matrix
Chapter 13 Asia Pacific Contactless Payments End-Use and Application Market Outlook
- 13.1 End-Use Industry and Customer Demand Structure
- 13.2 Leading Applications and Customer Groups
- 13.3 End-Use Market Size, Share and Forecast
- 13.4 Major End-Use Industry Deep Dives
- 13.4.1 Customer Requirements and Use Cases
- 13.4.2 Demand and Replacement Cycles
- 13.4.3 Technical and Regulatory Considerations
- 13.4.4 Purchasing and Procurement Models
- 13.4.5 Leading Vendors and Distribution Channels
- 13.4.6 Forecast and Commercial Opportunities
- 13.5 Emerging Applications and Cross-Segment Demand
- 13.6 End-Use Industry Investment Priorities
Chapter 14 Asia Pacific Contactless Payments Geographic Market Outlook, 2025-2035
- 14.1 Regional Market Size and Country-Level Shares, 2025
- 14.2 Country Market Size Comparison, 2025
- 14.3 Country Market Forecasts, 2025-2035
- 14.4 Subregional Industrial and Demand Clusters
- 14.5 Intra-Regional Pricing and Cost Differences
- 14.6 Cross-Border Trade and Supply Networks
- 14.7 Regional Supply and Demand Balances
- 14.8 Country Opportunity Comparison and Prioritization
Note: Every listed country is covered on the structure shown under the first country.
Chapter 15 Asia Pacific Contactless Payments Technology, Innovation and Sustainability Outlook
- 15.1 Technology Landscape and Maturity
- 15.2 Product, Process and Service Innovation
- 15.3 AI, Automation and Digital Tools in the Industry
- 15.4 Technology Adoption and Performance Benchmarking
- 15.5 Innovation Pipeline and R&D Investment
- 15.6 Energy Efficiency and Resource Management
- 15.7 Sustainability, Recycling and Circularity
- 15.8 Technology Roadmap, 2025-2035
- 15.9 Risks of Obsolescence and Technology Substitution
Chapter 16 Asia Pacific Contactless Payments Market Key Strategic Imperatives
- 16.1 Growth and Market Entry Priorities
- 16.2 High-Return Products and Segments
- 16.3 Pricing, Profitability and Cost Optimization
- 16.4 Technology Investment and Product Differentiation
- 16.5 Supply Chain Localization and Resilience
- 16.6 Distribution and Customer Acquisition
- 16.7 Partnership, Acquisition and Capacity Strategy
- 16.8 Regional Expansion Priorities
- 16.9 Short-, Medium- and Long-Term Actions
Chapter 17 Competition Outlook
- 17.1 Industry Competition Characteristics
- 17.2 Market Structure and Concentration
- 17.3 Market Share and Competitive Positioning, 2025
- 17.4 Company-Wise Revenue and Product Benchmarking
- 17.5 Production and Service Capacity Benchmarking
- 17.6 Technology, Pricing and Differentiation
- 17.7 Regional Footprint and Distribution Strength
- 17.8 Mergers, Acquisitions and Strategic Alliances
- 17.9 New Entrants and Competitive Threats
- 17.10 Porter's Five Forces and Industry Attractiveness
- 17.11 Competitive Outlook, 2025-2035
Chapter 18 Company Profiles
- 18.1 Company Coverage and Selection Criteria
- 18.2 Ant Group (Alipay and Ant International)
- 18.2.1 Business Description
- 18.2.2 Company Ownership and Geographic Presence
- 18.2.3 Product and Service Portfolio
- 18.2.4 Manufacturing and Operating Footprint
- 18.2.5 Financial Performance and Investment
- 18.2.6 Market Share and Competitive Position
- 18.2.7 Technology and Innovation Capabilities
- 18.2.8 Strategic Alliances or Partnerships
- 18.2.9 Recent Developments
- 18.2.10 Growth Strategy and Outlook
- 18.3 Tencent Holdings (Weixin Pay)
- 18.4 Visa
- 18.5 Mastercard
- 18.6 UnionPay International
- 18.7 PhonePe
- 18.8 One97 Communications (Paytm)
- 18.9 GCash (Mynt)
- 18.10 Kakao Pay
- 18.11 PAX Global Technology
- 18.12 Other Relevant Market Participants
Note: Every listed company is profiled on the structure shown under the first company. The company list is preliminary and may change based on research findings, market developments, data availability and client requirements.
Chapter 19 Disclaimer
- 19.1 Research and Forecast Disclaimer
- 19.2 Data Source and Estimation Limitations
Note: The depth of individual sections depends on data availability for this market. Volume, capacity, trade and other unit-based metrics are included where applicable.